Estimated zip code population in 2022: 53,515 Zip code population in 2010: 56,149 Zip code population in 2000: 57,079
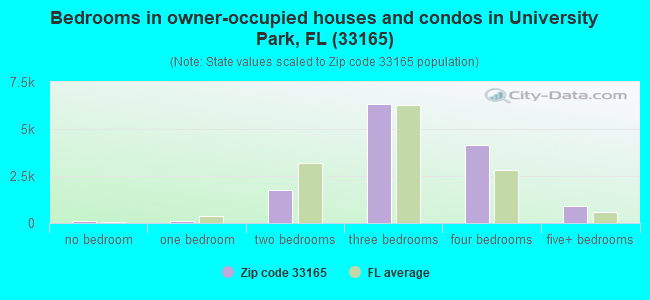
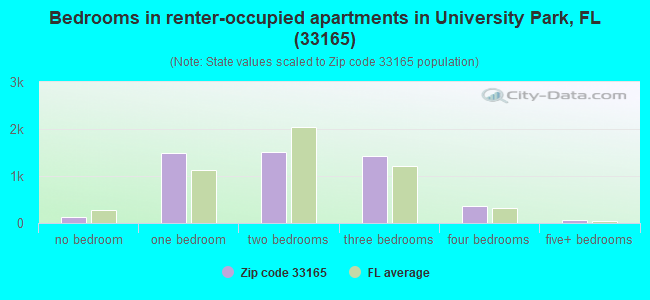
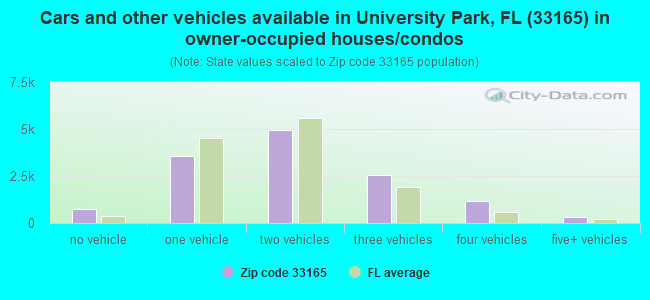
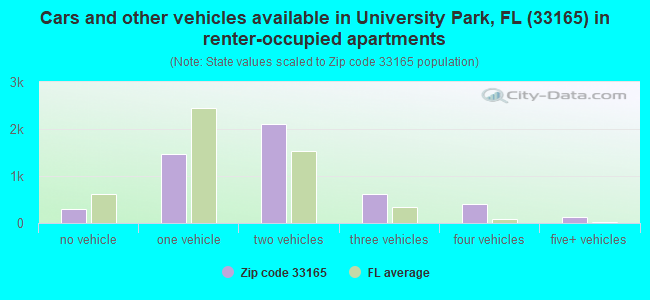
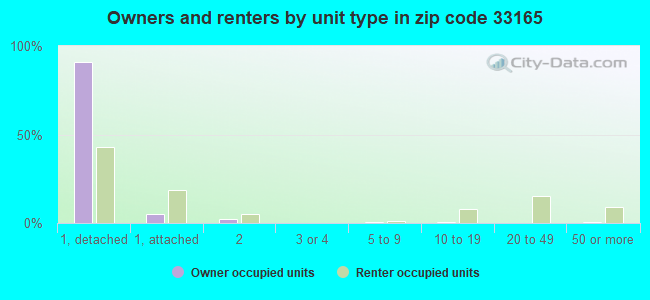
Houses and condos: 18,433 Renter-occupied apartments: 5,021
% of renters here:
27%
State:
33%
March 2022 cost of living index in zip code 33165: 105.3 (more than average, U.S. average is 100)
Land area: 7.6 sq. mi. Water area: 0.3 sq. mi.
Population density: 7,024 people per square mile
(high).
OSM Map
General Map
Google Map
MSN Map
OSM Map
General Map
Google Map
MSN Map
OSM Map
General Map
Google Map
MSN Map
OSM Map
General Map
Google Map
MSN Map
Please wait while loading the map...
Real estate property taxes paid for housing units in 2022:
This zip code:
0.7% ($3,551)
Florida:
0.7% ($2,529)
Median real estate property taxes paid for housing units with mortgages in 2022: $3,807 (0.7%) Median real estate property taxes paid for housing units with no mortgage in 2022: $3,194 (0.6%)
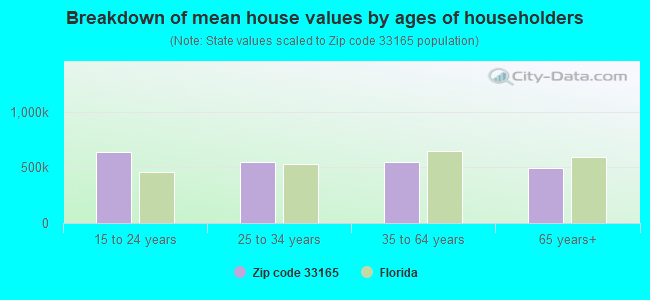
Estimated median house/condo value in 2022: $534,058
33165:
$534,058
Florida:
$354,100
According to our research of Florida and other state lists, there were 24 registered sex offenders living in 33165 zip code as of April 27, 2024. The ratio of all residents to sex offenders in zip code 33165 is 2,399 to 1. The ratio of registered sex offenders to all residents in this zip code is much lower than the state average.
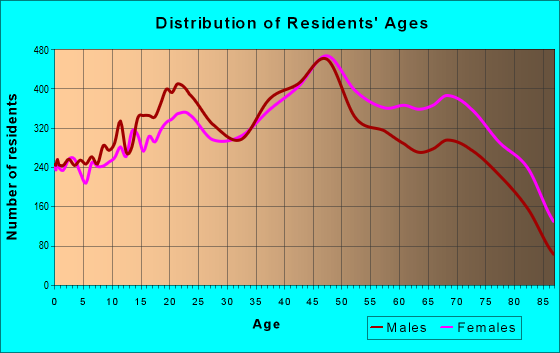
Median resident age:
This zip code:
49.1 years
Florida median age:
42.7 years
Average household size:
This zip code:
2.9 people
Florida:
2.5 people
Averages for the 2020 tax year for zip code 33165, filed in 2021:
Average Adjusted Gross Income (AGI) in 2020: $50,258 (Individual Income Tax Returns)
Here:
$50,258
State:
$82,200
Salary/wage: $47,786 (reported on 73.2% of returns)
Here:
$47,786
State:
$58,347
(% of AGI for various income ranges: 1073.2% for AGIs below $25k, 3748.8% for AGIs $25k-50k, 6783.8% for AGIs $50k-75k, 10044.3% for AGIs $75k-100k, 18270.2% for AGIs $100k-200k, 69040.8% for AGIs over 200k)
Taxable interest for individuals: $2,018 (reported on 17.1% of returns)
This zip code:
$2,018
Florida:
$4,272
(% of AGI for various income ranges: 11.0% for AGIs below $25k, 19.3% for AGIs $25k-50k, 31.5% for AGIs $50k-75k, 96.1% for AGIs $75k-100k, 177.9% for AGIs $100k-200k, 1523.3% for AGIs over 200k)
Ordinary dividends: $3,980 (reported on 8.0% of returns)
Here:
$3,980
State:
$15,863
(% of AGI for various income ranges: 6.6% for AGIs below $25k, 11.1% for AGIs $25k-50k, 36.4% for AGIs $50k-75k, 76.7% for AGIs $75k-100k, 178.7% for AGIs $100k-200k, 1584.2% for AGIs over 200k)
Net capital gain/loss in AGI: +$13,823 (reported on 9.0% of returns)
Here:
+$13,823
State:
+$62,983
(% of AGI for various income ranges: 1.8% for AGIs below $25k, 13.0% for AGIs $25k-50k, 48.7% for AGIs $50k-75k, 206.9% for AGIs $75k-100k, 536.5% for AGIs $100k-200k, 10443.8% for AGIs over 200k)
Profit/loss from business: +$5,924 (reported on 39.0% of returns)
Here:
+$5,924
State:
+$9,719
(% of AGI for various income ranges: 370.4% for AGIs below $25k, 206.0% for AGIs $25k-50k, 280.1% for AGIs $50k-75k, 341.5% for AGIs $75k-100k, 320.9% for AGIs $100k-200k, 1969.2% for AGIs over 200k)
Taxable individual retirement arrangement distribution: $14,114 (reported on 4.1% of returns)
33165:
$14,114
Florida:
$24,823
(% of AGI for various income ranges: 24.6% for AGIs below $25k, 41.7% for AGIs $25k-50k, 99.8% for AGIs $50k-75k, 221.9% for AGIs $75k-100k, 370.3% for AGIs $100k-200k, 895.0% for AGIs over 200k)
Total itemized deductions: $29,445 (reported on 7.6% of returns)
Here:
$29,445
State:
$45,393
(% of AGI for various income ranges: 40.7% for AGIs below $25k, 208.5% for AGIs $25k-50k, 497.3% for AGIs $50k-75k, 810.2% for AGIs $75k-100k, 1172.9% for AGIs $100k-200k, 4647.1% for AGIs over 200k)
Charity contributions: $5,534 (reported on 5.2% of returns)
Here:
$5,534
State:
$20,178
(% of AGI for various income ranges: 1.7% for AGIs below $25k, 18.3% for AGIs $25k-50k, 55.2% for AGIs $50k-75k, 108.4% for AGIs $75k-100k, 187.9% for AGIs $100k-200k, 852.1% for AGIs over 200k)
Taxes paid: $8,551 (reported on 7.3% of returns)
33165:
$8,551
State:
$6,967
(% of AGI for various income ranges: 11.0% for AGIs below $25k, 68.9% for AGIs $25k-50k, 150.2% for AGIs $50k-75k, 246.9% for AGIs $75k-100k, 324.0% for AGIs $100k-200k, 835.8% for AGIs over 200k)
Earned income credit: $1,883 (reported on 26.9% of returns)
Here:
$1,883
State:
$2,306
(% of AGI for various income ranges: 117.0% for AGIs below $25k, 61.9% for AGIs $25k-50k, 0.5% for AGIs $50k-75k)
Percentage of individuals using paid preparers for their 2020 taxes: 88.9%
Here:
89%
State:
92%
(% for various income ranges: 86.9% for AGIs below $25k, 90.8% for AGIs $25k-50k, 90.6% for AGIs $50k-75k, 90.8% for AGIs $75k-100k, 89.6% for AGIs $100k-200k, 90.5% for AGIs over 200k)
Averages for the 2012 tax year for zip code 33165, filed in 2013:
Average Adjusted Gross Income (AGI) in 2012: $39,394 (Individual Income Tax Returns)
Here:
$39,394
State:
$60,316
Salary/wage: $36,023 (reported on 78.5% of returns)
Here:
$36,023
State:
$45,277
(% of AGI for various income ranges: 72.0% for AGIs below $25k, 86.7% for AGIs $25k-50k, 82.0% for AGIs $50k-75k, 77.7% for AGIs $75k-100k, 76.7% for AGIs $100k-200k, 38.1% for AGIs over 200k)
Taxable interest for individuals: $1,802 (reported on 20.4% of returns)
This zip code:
$1,802
Florida:
$3,587
(% of AGI for various income ranges: 0.8% for AGIs below $25k, 0.5% for AGIs $25k-50k, 0.6% for AGIs $50k-75k, 1.0% for AGIs $75k-100k, 1.0% for AGIs $100k-200k, 1.7% for AGIs over 200k)
Ordinary dividends: $4,042 (reported on 7.2% of returns)
Here:
$4,042
State:
$12,831
(% of AGI for various income ranges: 0.7% for AGIs below $25k, 0.5% for AGIs $25k-50k, 0.9% for AGIs $50k-75k, 0.7% for AGIs $75k-100k, 1.0% for AGIs $100k-200k, 0.7% for AGIs over 200k)
Net capital gain/loss in AGI: +$13,878 (reported on 5.6% of returns)
Here:
+$13,878
State:
+$33,493
(% of AGI for various income ranges: 0.1% for AGIs $25k-50k, 0.1% for AGIs $50k-75k, 0.5% for AGIs $75k-100k, 1.4% for AGIs $100k-200k, 8.8% for AGIs over 200k)
Profit/loss from business: +$6,909 (reported on 29.3% of returns)
Here:
+$6,909
State:
+$10,012
(% of AGI for various income ranges: 18.1% for AGIs below $25k, 3.5% for AGIs $25k-50k, 2.3% for AGIs $50k-75k, 1.7% for AGIs $75k-100k, 2.4% for AGIs $100k-200k, 1.6% for AGIs over 200k)
Taxable individual retirement arrangement distribution: $12,528 (reported on 5.2% of returns)
33165:
$12,528
Florida:
$21,544
(% of AGI for various income ranges: 1.5% for AGIs below $25k, 1.2% for AGIs $25k-50k, 1.7% for AGIs $50k-75k, 2.7% for AGIs $75k-100k, 2.3% for AGIs $100k-200k, 1.0% for AGIs over 200k)
Self-employment retirement plans: $6,527 (reported on 0.4% of returns)
33165:
$6,527
Florida:
$20,611
(% of AGI for various income ranges: 0.4% for AGIs $75k-100k)
Total itemized deductions: $20,154 (24% of AGI, reported on 22.6% of returns)
Here:
$20,154
State:
$25,533
Here:
24.2% of AGI
State:
18.0% of AGI
(% of AGI for various income ranges: 7.5% for AGIs below $25k, 14.1% for AGIs $25k-50k, 14.4% for AGIs $50k-75k, 14.3% for AGIs $75k-100k, 11.3% for AGIs $100k-200k, 8.8% for AGIs over 200k)
Charity contributions: $2,390 (reported on 17.0% of returns)
Here:
$2,390
State:
$5,698
(% of AGI for various income ranges: 0.4% for AGIs below $25k, 1.1% for AGIs $25k-50k, 1.2% for AGIs $50k-75k, 1.2% for AGIs $75k-100k, 1.3% for AGIs $100k-200k, 1.1% for AGIs over 200k)
Taxes paid: $4,162 (reported on 21.3% of returns)
33165:
$4,162
State:
$6,203
(% of AGI for various income ranges: 1.2% for AGIs below $25k, 2.5% for AGIs $25k-50k, 2.8% for AGIs $50k-75k, 2.8% for AGIs $75k-100k, 2.6% for AGIs $100k-200k, 1.8% for AGIs over 200k)
Earned income credit: $2,062 (reported on 30.9% of returns)
Here:
$2,062
State:
$2,372
(% of AGI for various income ranges: 8.0% for AGIs below $25k, 1.0% for AGIs $25k-50k)
Percentage of individuals using paid preparers for their 2012 taxes: 68.5%
Here:
68%
State:
54%
(% for various income ranges: 66.8% for AGIs below $25k, 68.9% for AGIs $25k-50k, 71.4% for AGIs $50k-75k, 70.6% for AGIs $75k-100k, 73.2% for AGIs $100k-200k, 81.6% for AGIs over 200k)
Averages for the 2004 tax year for zip code 33165, filed in 2005:
Average Adjusted Gross Income (AGI) in 2004: $35,112 (Individual Income Tax Returns)
Here:
$35,112
State:
$50,523
Salary/wage: $32,516 (reported on 80.9% of returns)
Here:
$32,516
State:
$39,563
(% of AGI for various income ranges: 96.0% for AGIs below $10k, 78.9% for AGIs $10k-25k, 87.1% for AGIs $25k-50k, 83.1% for AGIs $50k-75k, 82.3% for AGIs $75k-100k, 54.4% for AGIs over 100k)
Taxable interest for individuals: $1,753 (reported on 33.1% of returns)
This zip code:
$1,753
Florida:
$3,211
(% of AGI for various income ranges: 4.8% for AGIs below $10k, 1.4% for AGIs $10k-25k, 1.1% for AGIs $25k-50k, 1.3% for AGIs $50k-75k, 1.7% for AGIs $75k-100k, 2.1% for AGIs over 100k)
Taxable dividends: $1,895 (reported on 10.1% of returns)
Here:
$1,895
State:
$6,129
(% of AGI for various income ranges: 1.4% for AGIs below $10k, 0.4% for AGIs $10k-25k, 0.4% for AGIs $25k-50k, 0.7% for AGIs $50k-75k, 0.4% for AGIs $75k-100k, 0.7% for AGIs over 100k)
Net capital gain/loss: +$13,478 (reported on 8.9% of returns)
Here:
+$13,478
State:
+$27,205
(% of AGI for various income ranges: -0.2% for AGIs below $10k, 0.3% for AGIs $10k-25k, 0.6% for AGIs $25k-50k, 1.3% for AGIs $50k-75k, 1.7% for AGIs $75k-100k, 9.3% for AGIs over 100k)
Profit/loss from business: +$8,111 (reported on 25.8% of returns)
Here:
+$8,111
State:
+$10,634
(% of AGI for various income ranges: 36.4% for AGIs below $10k, 12.7% for AGIs $10k-25k, 4.0% for AGIs $25k-50k, 3.1% for AGIs $50k-75k, 2.9% for AGIs $75k-100k, 4.3% for AGIs over 100k)
IRA payment deduction: $3,027 (reported on 2.7% of returns)
33165:
$3,027
Florida:
$3,082
(% of AGI for various income ranges: 0.3% for AGIs below $10k, 0.2% for AGIs $10k-25k, 0.3% for AGIs $25k-50k, 0.3% for AGIs $50k-75k, 0.3% for AGIs $75k-100k, 0.2% for AGIs over 100k)
Self-employed pension: $11,057 (reported on 0.1% of returns)
Here:
$11,057
Florida:
$15,857
Total itemized deductions: $17,135 (27% of AGI, reported on 30.2% of returns)
Here:
$17,135
State:
$20,370
Here:
27.5% of AGI
State:
20.7% of AGI
(% of AGI for various income ranges: 13.7% for AGIs below $10k, 15.1% for AGIs $10k-25k, 19.6% for AGIs $25k-50k, 17.6% for AGIs $50k-75k, 15.9% for AGIs $75k-100k, 8.8% for AGIs over 100k)
Charity contributions deductions: $1,858 (3% of AGI, reported on 25.2% of returns)
Here:
$1,858
State:
$4,064
Here:
2.8% of AGI
State:
3.8% of AGI
(% of AGI for various income ranges: 0.5% for AGIs below $10k, 0.9% for AGIs $10k-25k, 1.5% for AGIs $25k-50k, 1.6% for AGIs $50k-75k, 1.7% for AGIs $75k-100k, 1.2% for AGIs over 100k)
Total tax: $4,995 (reported on 72.9% of returns)
33165:
$4,995
State:
$9,431
(% of AGI for various income ranges: 8.6% for AGIs below $10k, 4.2% for AGIs $10k-25k, 6.0% for AGIs $25k-50k, 8.8% for AGIs $50k-75k, 10.3% for AGIs $75k-100k, 17.9% for AGIs over 100k)
Earned income credit: $1,613 (reported on 25.0% of returns)
Here:
$1,613
State:
$1,808
Percentage of individuals using paid preparers for their 2004 taxes: 68.9%
Here:
69%
State:
60%
(% for various income ranges: 66.4% for AGIs below $10k, 70.5% for AGIs $10k-25k, 68.3% for AGIs $25k-50k, 67.5% for AGIs $50k-75k, 71.0% for AGIs $75k-100k, 73.9% for AGIs over 100k)
Likely homosexual households (counted as self-reported same-sex unmarried-partner households)
Lesbian couples: 0.1% of all households
Gay men: 0.0% of all households
Household received Food Stamps/SNAP in the past 12 months: 4,309 Household did not receive Food Stamps/SNAP in the past 12 months: 13,836
Women who had a birth in the past 12 months: 443 (201 now married, 230 unmarried) Women who did not have a birth in the past 12 months: 10,430 (3,848 now married, 6,580 unmarried)
Housing units in zip code 33165 with a mortgage: 6,966 (497 second mortgage, 39 home equity loan, 365 both second mortgage and home equity loan) Houses without a mortgage: 103
Median monthly owner costs for units with a mortgage: $2,373 Median monthly owner costs for units without a mortgage: $726
Residents with income below the poverty level in 2022:
This zip code:
10.0%
Whole state:
12.7%
Residents with income below 50% of the poverty level in 2022:
This zip code:
5.1%
Whole state:
6.6%
Median number of rooms in houses and condos:
Here:
6.0
State:
5.9
Median number of rooms in apartments:
Here:
4.1
State:
4.2
Notable locations in this zip code not listed on our city pages
Notable locations in zip code 33165: Coral 97th Plaza (A), Tamiami Park Stadium (B), Saint John Vianney College Seminary Maytag Memorial Library (C), Roxy Performing Arts Center (D), West Dade Regional Library and Governement Center (E), Tiny Town Day Care Center (F), The Growing and Learning Center (G), Smiling Faces Day Care Center (H), Play and Learn Child Care Center (I), Pebbles Day Care Center (J), Perez Family Day Care Home (K), Peter Pan Child Care and Learning Center (L), Petit Carousel Day Care Center (M), Olga Music and Day Care Center (N), Noah's Ark Christian Child Care Center (O), My Garden's Friend Day Care Center (P), Kids Paradise Day Care Center (Q), Kid Station Day Care Center (R), Kiddie Day Care (S), Happy Faces Dade County Day Care Center (T). Display/hide their locations on the map
Churches in zip code 33165 include: Saint Simons Church (A), Trinity Church (B), Olympia Heights Church (C), Saint Brendan Church (D), Trinity Church (E), Gateway Baptist Church (F), Bird Road Baptist Church (G), Coral Park Baptist Church (H), Primera Iglesia Bautista Hispana de Westwood Lake (I). Display/hide their locations on the map
Parks in zip code 33165 include: Westwood Park (1), Concord Park (2), Blue Lakes Park (3), Miller Drive Park (4), Tropical Estates Park (5), Rockway Park (6). Display/hide their locations on the map
4,341 married couples with children.
1,828 single-parent households (508 men, 1,320 women).
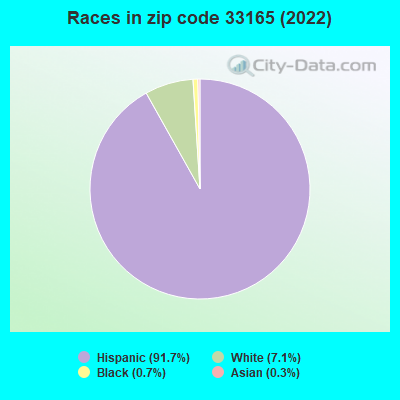
10.3% of residents of 33165 zip code speak English at home.
89.5% of residents speak Spanish at home (49% very well, 19% well, 20% not well, 13% not at all).
0.3% of residents speak other Indo-European language at home (87% very well, 9% well, 4% not well).
0.3% of residents speak Asian or Pacific Island language at home (62% very well, 38% well).
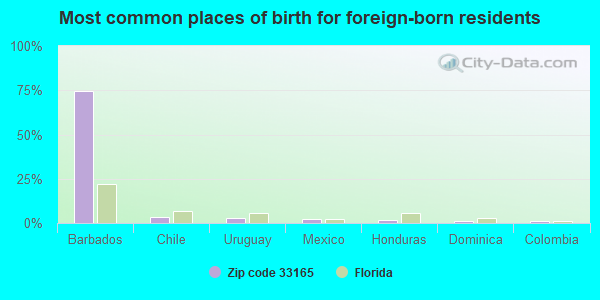
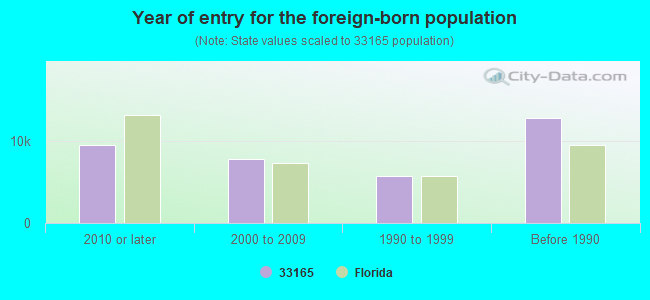
Foreign born population: 35,438 (66.2%) (69.5% of them are naturalized citizens)
Major facilities with environmental interests located in this zip code:
OLYMPIA HEIGHTS ELEMENTARY SCHOOL (9797 S.W. 40TH STREET in MIAMI, FL)
(Geographic Names Information System) (National Center for Education Statistics) - STATE ID-4091 Small Quantity Generators, between 100 kg and 1000 kg of hazardous waste/month (Resource Conservation and Recovery Act (tracking hazardous waste)) - notification Organizations: MARSHALL STEARNS, PRINCIPAL (CONTACT/OWNER)
, DADE COUNTY SCHOOL DISTRICT (SCHOOL DISTRICT)
Alternative names: DADE CO OLYMPIA HEIGHTS ELEMENTARY
ROCKWAY ELEMENTARY SCHOOL (2790 S.W. 93RD COURT in MIAMI, FL)
(Geographic Names Information System) (National Center for Education Statistics) - STATE ID-4721 Small Quantity Generators, between 100 kg and 1000 kg of hazardous waste/month (Resource Conservation and Recovery Act (tracking hazardous waste)) - notification Organizations: RICHARD ARTMEIER, PRINCIPAL (CONTACT/OWNER)
, DADE COUNTY SCHOOL DISTRICT (SCHOOL DISTRICT)
Alternative names: DADE CO ROCKWAY ELEMENTARY
BLUE LAKES ELEMENTARY SCHOOL (9250 S.W. 52ND TERRACE in MIAMI, FL)
(Geographic Names Information System) (National Center for Education Statistics) - STATE ID-0441 Small Quantity Generators, between 100 kg and 1000 kg of hazardous waste/month (Resource Conservation and Recovery Act (tracking hazardous waste)) - notification Organizations: JOANNE CANN, PRINCIPAL (CONTACT/OWNER)
, DADE COUNTY SCHOOL DISTRICT (SCHOOL DISTRICT)
Alternative names: DADE CO BLUE LAKES ELEMENTARY
MIAMI CORAL PARK SENIOR HIGH SCHOOL (8865 S.W. 16TH STREET in MIAMI, FL)
(Geographic Names Information System) (National Center for Education Statistics) - STATE ID-7271 Organizations: DADE COUNTY SCHOOL DISTRICT (SCHOOL DISTRICT)
CYPRESS ELEMENTARY SCHOOL (5400 S.W. 112TH COURT in MIAMI, FL)
(Geographic Names Information System) (National Center for Education Statistics) - STATE ID-1281 Organizations: DADE COUNTY SCHOOL DISTRICT (SCHOOL DISTRICT)
ROYAL PALM ELEMENTARY SCHOOL (4200 S.W. 112TH COURT in MIAMI, FL)
(Geographic Names Information System) (National Center for Education Statistics) - STATE ID-4761 Organizations: DADE COUNTY SCHOOL DISTRICT (SCHOOL DISTRICT)
SOUTHWEST MIAMI SENIOR HIGH SCHOOL (8855 S.W. 50TH TERRACE in MIAMI, FL)
(Geographic Names Information System) (National Center for Education Statistics) - STATE ID-7741 Organizations: DADE COUNTY SCHOOL DISTRICT (SCHOOL DISTRICT)
RIVIERA MIDDLE SCHOOL (10301 S.W. 48TH STREET in MIAMI, FL)
(National Center for Education Statistics) - STATE ID-6801 Organizations: DADE COUNTY SCHOOL DISTRICT (SCHOOL DISTRICT)
ROCKWAY MIDDLE SCHOOL (9393 S.W. 29TH TERRACE in MIAMI, FL)
(National Center for Education Statistics) - STATE ID-6821 Organizations: DADE COUNTY SCHOOL DISTRICT (SCHOOL DISTRICT)
AIR MINOR (AIRS/AFS) (Resource Conservation and Recovery Act (tracking hazardous waste)) Business SIC classification: DRYCLEANING PLANTS, EXCEPT RUG CLEANING Organizations: BERTHA RODAS, OWNER (CONTACT/OWNER)
SPARKLING POOLS INC (8731 CORAL WY in MIAMI, FL)
(Integrated Compliance Information System) - ICIS-04-1998-0345, FORMAL ENFORCEMENT ACTION Business SIC classification: PERFUMES, COSMETICS, AND OTHER TOILET PREPARATIONS; PESTICIDES AND AGRICULTURAL CHEMICALS; CHEMICALS AND CHEMICAL PREPARATIONS
CLEANER'S TOWN (9728 SW 24 ST in MIAMI, FL)
AIR MINOR (AIRS/AFS) Small Quantity Generators, between 100 kg and 1000 kg of hazardous waste/month (Resource Conservation and Recovery Act (tracking hazardous waste)) - notification Small Quantity Generators, between 100 kg and 1000 kg of hazardous waste/month (Resource Conservation and Recovery Act (tracking hazardous waste)) - notification Business SIC classification: DRYCLEANING PLANTS, EXCEPT RUG CLEANING Organizations: ANDRES BERTEMATTI (CONTACT/OWNER)
, ANDRES A BERTEMATTI, PRESIDENT (CONTACT/OWNER)
ROSBETTY CLEANERS, CORPORATION (9630 SW 24 STREET in MIAMI, FL)
AIR MINOR (AIRS/AFS) Business SIC classification: DRYCLEANING PLANTS, EXCEPT RUG CLEANING
Housing units lacking complete plumbing facilities: 0.5% Housing units lacking complete kitchen facilities: 0.8%
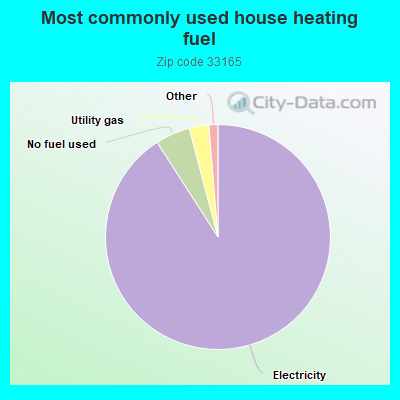
91.0%Electricity
5.0%No fuel used
2.8%Utility gas
0.8%Bottled, tank, or LP gas
0.5%Fuel oil, kerosene, etc.
Population in 1990: 56,064. Population change in the 1990s: +1,015 (+1.8%).
Place of birth for U.S.-born residents:
This state: 13,938
Northeast: 1,754
Midwest: 473
South: 757
West: 251
68% of the 33165 zip code residents lived in the same house 5 years ago. Out of people who lived in different houses, 89% lived in this county. Out of people who lived in different counties, 50% lived in Florida.
94% of the 33165 zip code residents lived in the same house 1 year ago. Out of people who lived in different houses, 69% moved from this county. Out of people who lived in different houses, 9% moved from different county within same state. Out of people who lived in different houses, 4% moved from different state. Out of people who lived in different houses, 19% moved from abroad.
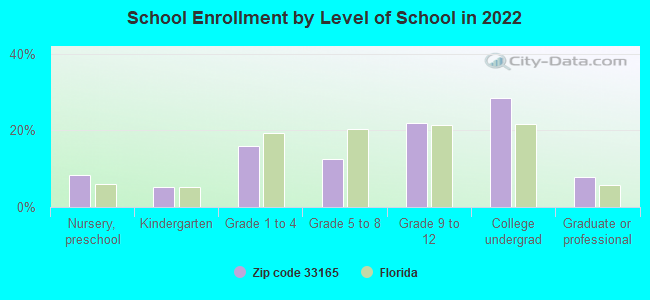
Private vs. public school enrollment:
Students in private schools in grades 1 to 8 (elementary and middle school): 552
Here:
19.8%
Florida:
15.8%
Students in private schools in grades 9 to 12 (high school): 275
Here:
12.9%
Florida:
12.9%
Students in private undergraduate colleges: 827
Here:
29.6%
Florida:
23.6%
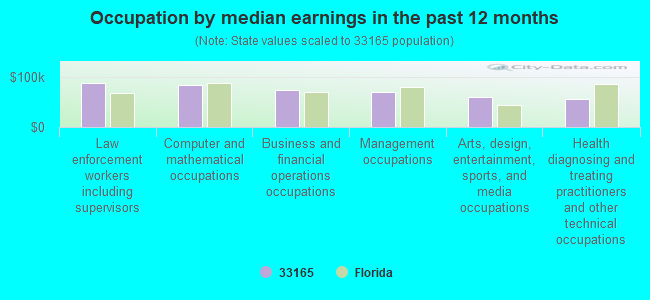
Occupation by median earnings in the past 12 months ($)
87,917Law enforcement workers including supervisors
84,145Computer and mathematical occupations
74,784Business and financial operations occupations
70,577Management occupations
59,879Arts, design, entertainment, sports, and media occupations
56,146Health diagnosing and treating practitioners and other technical occupations
Companies with federal contracts located in this zip code:
A D A ENGINEERING, INC (11401 SW 40TH ST STE 470 in MIAMI, FL) : $1,302,480 in 35 contractsfrom 2002 to 2005
Contracts for Architect - Engineer Services (including landscaping, interior layout, and designing) by U.S. Army Corps of Engineers - civil program financing only, Army Signed by year:2000: $0; 2001: $0; 2002: $20,000; 2003: $131,107; 2004: $213,127; 2005: $938,246; 2006: $0.
Biggest contracts:
$666,122 with U.S. Army Corps of Engineers - civil program financing only for Architect - Engineer Services (including landscaping, interior layout, and designing). Signed on 2005-01-04. Completion date: 2005-09-30.
$227,460, same as above.Signed on 2005-04-14. Completion date: 2005-09-30.
$65,926, same as above.Signed on 2003-02-06. Completion date: 2004-01-31.
$37,348, same as above.Signed on 2005-05-19. Completion date: 2005-09-30.
DAVID W. SMITH (3231 SW 105 CT in MIAMI, FL; small business)
$99,772 with Navy for Engineering and Technical Services. Signed on 2000-02-15. Completion date: 2000-12-30.
L & M ENGRAVING & TROPHY INC (9465 MILLER RD in MIAMI, FL; small business) : $11,658 in 2 contractsfrom 2004 to 2005
$6,355 with Army for Public Relations Services(includes writing services, event planning and management, media relations, radio and television analysis, and press services). Signed on 2005-07-12. Completion date: 2005-07-28.
$5,303 with Army for Other Photographic, Mapping, Printing, and Publication Services. Signed on 2004-09-09. Completion date: 2004-09-30.
Top industries in this zip code by the number of employees in 2005:
Arts, Entertainment, and Recreation: Promoters of Performing Arts, Sports, and Similar Events with Facilities (500-999 employees: 1 establishment, 5-9 employees: 1 establishment)
2008 - 2018 National Fire Incident Reporting System (NFIRS) incidents
Based on the data from the years 2008 - 2018 the average number of fires per year is 77. The highest number of fire incidents - 115 took place in 2009, and the least - 51 in 2016. The data has a decreasing trend.
When looking into fire subcategories, the most incidents belonged to: Structure Fires (44.0%), and Outside Fires (29.3%).
Fire incident types reported to NFIRS in Zip Code 33165


 Nearest zip codes: 33174, 33173, 33155, 33175, 33172, 33144.


 Based on the data from the years 2008 - 2018 the average number of fires per year is 77. The highest number of fire incidents - 115 took place in 2009, and the least - 51 in 2016. The data has a decreasing trend.
 When looking into fire subcategories, the most incidents belonged to: Structure Fires (44.0%), and Outside Fires (29.3%).