Estimated zip code population in 2022: 51,650 Zip code population in 2010: 53,206 Zip code population in 2000: 52,581
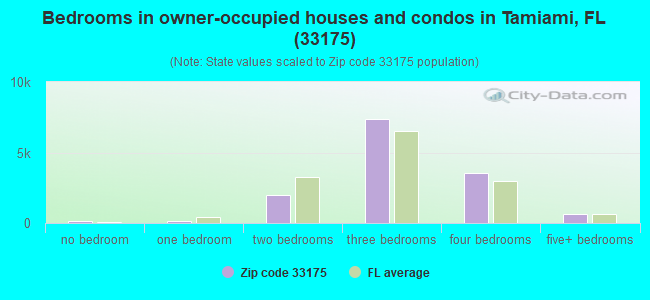
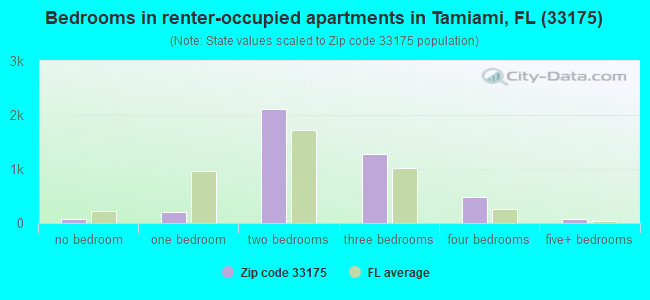
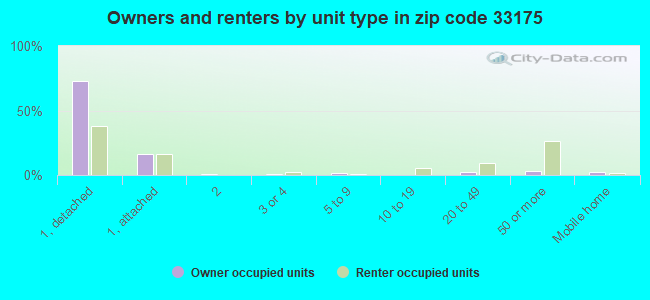
Houses and condos: 18,111 Renter-occupied apartments: 4,261
% of renters here:
24%
State:
33%
March 2022 cost of living index in zip code 33175: 106.0 (more than average, U.S. average is 100)
Land area: 7.7 sq. mi. Water area: 0.3 sq. mi.
Population density: 6,708 people per square mile
(high).
OSM Map
General Map
Google Map
MSN Map
OSM Map
General Map
Google Map
MSN Map
OSM Map
General Map
Google Map
MSN Map
OSM Map
General Map
Google Map
MSN Map
Please wait while loading the map...
Real estate property taxes paid for housing units in 2022:
This zip code:
0.6% ($3,106)
Florida:
0.7% ($2,529)
Median real estate property taxes paid for housing units with mortgages in 2022: $3,436 (0.7%) Median real estate property taxes paid for housing units with no mortgage in 2022: $2,819 (0.6%)
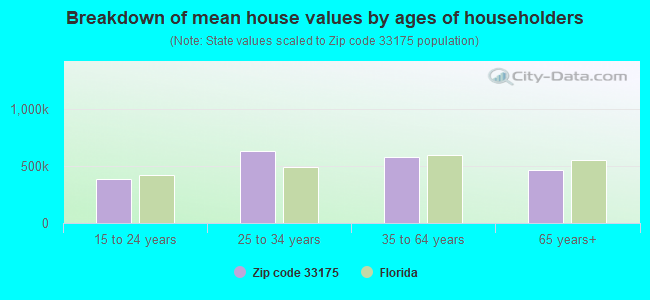
Estimated median house/condo value in 2022: $510,670
33175:
$510,670
Florida:
$354,100
According to our research of Florida and other state lists, there were 9 registered sex offenders living in 33175 zip code as of April 27, 2024. The ratio of all residents to sex offenders in zip code 33175 is 6,138 to 1. The ratio of registered sex offenders to all residents in this zip code is much lower than the state average.
Median resident age:
This zip code:
48.3 years
Florida median age:
42.7 years
Average household size:
This zip code:
2.8 people
Florida:
2.5 people
Averages for the 2020 tax year for zip code 33175, filed in 2021:
Average Adjusted Gross Income (AGI) in 2020: $54,398 (Individual Income Tax Returns)
Here:
$54,398
State:
$82,200
Salary/wage: $50,913 (reported on 75.2% of returns)
Here:
$50,913
State:
$58,347
(% of AGI for various income ranges: 1072.7% for AGIs below $25k, 3673.2% for AGIs $25k-50k, 6893.5% for AGIs $50k-75k, 10299.5% for AGIs $75k-100k, 18443.6% for AGIs $100k-200k, 64126.7% for AGIs over 200k)
Taxable interest for individuals: $1,732 (reported on 17.2% of returns)
This zip code:
$1,732
Florida:
$4,272
(% of AGI for various income ranges: 10.6% for AGIs below $25k, 17.2% for AGIs $25k-50k, 26.1% for AGIs $50k-75k, 60.0% for AGIs $75k-100k, 139.7% for AGIs $100k-200k, 962.4% for AGIs over 200k)
Ordinary dividends: $2,705 (reported on 8.0% of returns)
Here:
$2,705
State:
$15,863
(% of AGI for various income ranges: 6.3% for AGIs below $25k, 10.6% for AGIs $25k-50k, 18.1% for AGIs $50k-75k, 55.1% for AGIs $75k-100k, 131.6% for AGIs $100k-200k, 600.6% for AGIs over 200k)
Net capital gain/loss in AGI: +$17,788 (reported on 9.4% of returns)
Here:
+$17,788
State:
+$62,983
(% of AGI for various income ranges: 6.0% for AGIs below $25k, 17.5% for AGIs $25k-50k, 53.5% for AGIs $50k-75k, 127.1% for AGIs $75k-100k, 468.2% for AGIs $100k-200k, 11366.1% for AGIs over 200k)
Profit/loss from business: +$6,146 (reported on 38.3% of returns)
Here:
+$6,146
State:
+$9,719
(% of AGI for various income ranges: 359.5% for AGIs below $25k, 226.8% for AGIs $25k-50k, 307.1% for AGIs $50k-75k, 287.9% for AGIs $75k-100k, 365.7% for AGIs $100k-200k, 1616.7% for AGIs over 200k)
Taxable individual retirement arrangement distribution: $15,808 (reported on 3.7% of returns)
33175:
$15,808
Florida:
$24,823
(% of AGI for various income ranges: 22.4% for AGIs below $25k, 42.0% for AGIs $25k-50k, 82.1% for AGIs $50k-75k, 142.8% for AGIs $75k-100k, 314.2% for AGIs $100k-200k, 1186.1% for AGIs over 200k)
Total itemized deductions: $32,455 (reported on 8.5% of returns)
Here:
$32,455
State:
$45,393
(% of AGI for various income ranges: 51.4% for AGIs below $25k, 216.8% for AGIs $25k-50k, 482.6% for AGIs $50k-75k, 796.2% for AGIs $75k-100k, 1112.9% for AGIs $100k-200k, 7213.9% for AGIs over 200k)
Charity contributions: $5,591 (reported on 6.1% of returns)
Here:
$5,591
State:
$20,178
(% of AGI for various income ranges: 2.0% for AGIs below $25k, 21.5% for AGIs $25k-50k, 57.4% for AGIs $50k-75k, 107.5% for AGIs $75k-100k, 157.9% for AGIs $100k-200k, 1007.0% for AGIs over 200k)
Taxes paid: $8,076 (reported on 8.2% of returns)
33175:
$8,076
State:
$6,967
(% of AGI for various income ranges: 12.2% for AGIs below $25k, 62.9% for AGIs $25k-50k, 146.1% for AGIs $50k-75k, 223.9% for AGIs $75k-100k, 297.9% for AGIs $100k-200k, 1018.2% for AGIs over 200k)
Earned income credit: $1,920 (reported on 25.4% of returns)
Here:
$1,920
State:
$2,306
(% of AGI for various income ranges: 116.5% for AGIs below $25k, 62.0% for AGIs $25k-50k, 0.5% for AGIs $50k-75k)
Percentage of individuals using paid preparers for their 2020 taxes: 89.5%
Here:
90%
State:
92%
(% for various income ranges: 87.9% for AGIs below $25k, 91.3% for AGIs $25k-50k, 91.0% for AGIs $50k-75k, 90.2% for AGIs $75k-100k, 89.9% for AGIs $100k-200k, 89.2% for AGIs over 200k)
Averages for the 2012 tax year for zip code 33175, filed in 2013:
Average Adjusted Gross Income (AGI) in 2012: $42,503 (Individual Income Tax Returns)
Here:
$42,503
State:
$60,316
Salary/wage: $40,161 (reported on 80.6% of returns)
Here:
$40,161
State:
$45,277
(% of AGI for various income ranges: 72.7% for AGIs below $25k, 87.1% for AGIs $25k-50k, 84.0% for AGIs $50k-75k, 79.8% for AGIs $75k-100k, 80.2% for AGIs $100k-200k, 52.6% for AGIs over 200k)
Taxable interest for individuals: $1,454 (reported on 20.0% of returns)
This zip code:
$1,454
Florida:
$3,587
(% of AGI for various income ranges: 0.7% for AGIs below $25k, 0.5% for AGIs $25k-50k, 0.5% for AGIs $50k-75k, 0.8% for AGIs $75k-100k, 0.8% for AGIs $100k-200k, 0.8% for AGIs over 200k)
Ordinary dividends: $3,498 (reported on 6.6% of returns)
Here:
$3,498
State:
$12,831
(% of AGI for various income ranges: 0.4% for AGIs below $25k, 0.4% for AGIs $25k-50k, 0.2% for AGIs $50k-75k, 0.5% for AGIs $75k-100k, 0.4% for AGIs $100k-200k, 1.3% for AGIs over 200k)
Net capital gain/loss in AGI: +$12,781 (reported on 5.3% of returns)
Here:
+$12,781
State:
+$33,493
(% of AGI for various income ranges: 0.2% for AGIs $25k-50k, 0.1% for AGIs $50k-75k, 0.6% for AGIs $75k-100k, 1.0% for AGIs $100k-200k, 7.2% for AGIs over 200k)
Profit/loss from business: +$7,230 (reported on 29.7% of returns)
Here:
+$7,230
State:
+$10,012
(% of AGI for various income ranges: 18.7% for AGIs below $25k, 4.1% for AGIs $25k-50k, 2.5% for AGIs $50k-75k, 2.3% for AGIs $75k-100k, 2.4% for AGIs $100k-200k, 1.8% for AGIs over 200k)
Taxable individual retirement arrangement distribution: $12,874 (reported on 4.2% of returns)
33175:
$12,874
Florida:
$21,544
(% of AGI for various income ranges: 1.2% for AGIs below $25k, 1.1% for AGIs $25k-50k, 1.4% for AGIs $50k-75k, 1.6% for AGIs $75k-100k, 1.7% for AGIs $100k-200k, 0.7% for AGIs over 200k)
Self-employment retirement plans: $4,882 (reported on 0.4% of returns)
33175:
$4,882
Florida:
$20,611
(% of AGI for various income ranges: 0.2% for AGIs $50k-75k)
Total itemized deductions: $21,561 (26% of AGI, reported on 26.0% of returns)
Here:
$21,561
State:
$25,533
Here:
25.5% of AGI
State:
18.0% of AGI
(% of AGI for various income ranges: 7.8% for AGIs below $25k, 14.6% for AGIs $25k-50k, 16.5% for AGIs $50k-75k, 16.4% for AGIs $75k-100k, 13.0% for AGIs $100k-200k, 11.2% for AGIs over 200k)
Charity contributions: $2,380 (reported on 20.0% of returns)
Here:
$2,380
State:
$5,698
(% of AGI for various income ranges: 0.4% for AGIs below $25k, 1.0% for AGIs $25k-50k, 1.3% for AGIs $50k-75k, 1.2% for AGIs $75k-100k, 1.2% for AGIs $100k-200k, 1.6% for AGIs over 200k)
Taxes paid: $4,280 (reported on 24.5% of returns)
33175:
$4,280
State:
$6,203
(% of AGI for various income ranges: 1.4% for AGIs below $25k, 2.5% for AGIs $25k-50k, 3.1% for AGIs $50k-75k, 2.8% for AGIs $75k-100k, 3.1% for AGIs $100k-200k, 1.9% for AGIs over 200k)
Earned income credit: $2,105 (reported on 28.8% of returns)
Here:
$2,105
State:
$2,372
(% of AGI for various income ranges: 8.1% for AGIs below $25k, 1.1% for AGIs $25k-50k)
Percentage of individuals using paid preparers for their 2012 taxes: 68.2%
Here:
68%
State:
54%
(% for various income ranges: 67.3% for AGIs below $25k, 67.8% for AGIs $25k-50k, 69.4% for AGIs $50k-75k, 67.7% for AGIs $75k-100k, 72.2% for AGIs $100k-200k, 79.2% for AGIs over 200k)
Averages for the 2004 tax year for zip code 33175, filed in 2005:
Average Adjusted Gross Income (AGI) in 2004: $38,732 (Individual Income Tax Returns)
Here:
$38,732
State:
$50,523
Salary/wage: $35,638 (reported on 84.7% of returns)
Here:
$35,638
State:
$39,563
(% of AGI for various income ranges: 87.8% for AGIs below $10k, 81.0% for AGIs $10k-25k, 89.8% for AGIs $25k-50k, 86.2% for AGIs $50k-75k, 86.1% for AGIs $75k-100k, 61.0% for AGIs over 100k)
Taxable interest for individuals: $1,393 (reported on 31.6% of returns)
This zip code:
$1,393
Florida:
$3,211
(% of AGI for various income ranges: 3.0% for AGIs below $10k, 1.2% for AGIs $10k-25k, 0.7% for AGIs $25k-50k, 0.7% for AGIs $50k-75k, 1.2% for AGIs $75k-100k, 1.4% for AGIs over 100k)
Taxable dividends: $1,570 (reported on 9.3% of returns)
Here:
$1,570
State:
$6,129
(% of AGI for various income ranges: 0.9% for AGIs below $10k, 0.2% for AGIs $10k-25k, 0.2% for AGIs $25k-50k, 0.3% for AGIs $50k-75k, 0.4% for AGIs $75k-100k, 0.5% for AGIs over 100k)
Net capital gain/loss: +$16,155 (reported on 8.1% of returns)
Here:
+$16,155
State:
+$27,205
(% of AGI for various income ranges: -0.2% for AGIs below $10k, 0.3% for AGIs $10k-25k, 0.6% for AGIs $25k-50k, 1.3% for AGIs $50k-75k, 2.3% for AGIs $75k-100k, 8.2% for AGIs over 100k)
Profit/loss from business: +$9,017 (reported on 25.7% of returns)
Here:
+$9,017
State:
+$10,634
(% of AGI for various income ranges: 36.0% for AGIs below $10k, 12.9% for AGIs $10k-25k, 4.7% for AGIs $25k-50k, 3.4% for AGIs $50k-75k, 2.8% for AGIs $75k-100k, 4.3% for AGIs over 100k)
Profit/loss from farming: +$2,091 (reported on 0.1% of returns)
Here:
+$2,091
State:
-$6,005
IRA payment deduction: $3,087 (reported on 2.6% of returns)
33175:
$3,087
Florida:
$3,082
(% of AGI for various income ranges: 0.2% for AGIs below $10k, 0.2% for AGIs $10k-25k, 0.2% for AGIs $25k-50k, 0.2% for AGIs $50k-75k, 0.3% for AGIs $75k-100k, 0.2% for AGIs over 100k)
Self-employed pension: $10,906 (reported on 0.1% of returns)
Here:
$10,906
Florida:
$15,857
Total itemized deductions: $18,422 (29% of AGI, reported on 35.7% of returns)
Here:
$18,422
State:
$20,370
Here:
29.0% of AGI
State:
20.7% of AGI
(% of AGI for various income ranges: 11.5% for AGIs below $10k, 20.6% for AGIs $10k-25k, 22.5% for AGIs $25k-50k, 20.0% for AGIs $50k-75k, 17.1% for AGIs $75k-100k, 10.7% for AGIs over 100k)
Charity contributions deductions: $1,815 (3% of AGI, reported on 30.2% of returns)
Here:
$1,815
State:
$4,064
Here:
2.7% of AGI
State:
3.8% of AGI
(% of AGI for various income ranges: 0.3% for AGIs below $10k, 0.9% for AGIs $10k-25k, 1.7% for AGIs $25k-50k, 1.7% for AGIs $50k-75k, 1.7% for AGIs $75k-100k, 1.3% for AGIs over 100k)
Total tax: $5,788 (reported on 73.4% of returns)
33175:
$5,788
State:
$9,431
(% of AGI for various income ranges: 6.7% for AGIs below $10k, 4.2% for AGIs $10k-25k, 5.6% for AGIs $25k-50k, 8.1% for AGIs $50k-75k, 10.0% for AGIs $75k-100k, 19.4% for AGIs over 100k)
Earned income credit: $1,737 (reported on 24.3% of returns)
Here:
$1,737
State:
$1,808
Percentage of individuals using paid preparers for their 2004 taxes: 69.2%
Here:
69%
State:
60%
(% for various income ranges: 65.6% for AGIs below $10k, 70.4% for AGIs $10k-25k, 69.3% for AGIs $25k-50k, 70.2% for AGIs $50k-75k, 68.0% for AGIs $75k-100k, 74.0% for AGIs over 100k)
Likely homosexual households (counted as self-reported same-sex unmarried-partner households)
Lesbian couples: 0.0% of all households
Gay men: 0.1% of all households
Household received Food Stamps/SNAP in the past 12 months: 3,377 Household did not receive Food Stamps/SNAP in the past 12 months: 14,628
Women who had a birth in the past 12 months: 581 (331 now married, 242 unmarried) Women who did not have a birth in the past 12 months: 10,118 (3,725 now married, 6,390 unmarried)
Housing units in zip code 33175 with a mortgage: 7,532 (642 second mortgage, 575 both second mortgage and home equity loan) Houses without a mortgage: 285
Median monthly owner costs for units with a mortgage: $2,189 Median monthly owner costs for units without a mortgage: $655
Residents with income below the poverty level in 2022:
This zip code:
10.5%
Whole state:
12.7%
Residents with income below 50% of the poverty level in 2022:
This zip code:
5.1%
Whole state:
6.6%
Median number of rooms in houses and condos:
Here:
5.8
State:
5.9
Median number of rooms in apartments:
Here:
4.5
State:
4.2
Notable locations in this zip code not listed on our city pages
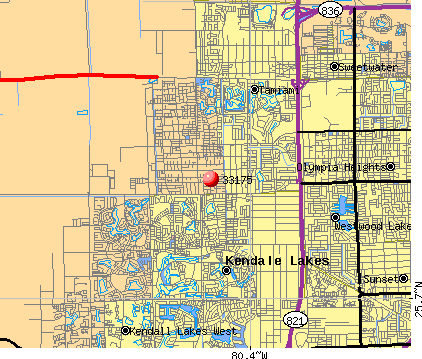
Notable locations in zip code 33175: Nueva Jerusalen Christian Care Center (A), Mother of Christ Day Care Center (B), My First Step Day Care Center (C), Kids Depot Day Care Center (D), Kids In Action Day Care Center (E), Kinder Care Learning Center (F), Kiddie College of South Miami (G), Early Start Christian Day Care Center (H), Candyland Child Care Center (I), Alphabet Soup Learning Center (J), Miami - Dade County Fire Rescue Station 37 (K). Display/hide their locations on the map
Parks in zip code 33175 include: Royal Green Park (1), Millers Pond Park (2), Southern Estates Park (3), Tamiami Lakes Park (4), Bent Tree Park (5), Bird Lake Park (6), International Gardens Park (7). Display/hide their locations on the map
Tourist attraction (not listed on the city page) : 2R Productions (Arcades & Amusements; 12253 Southwest 27th Street).
3,763 married couples with children.
1,890 single-parent households (507 men, 1,383 women).
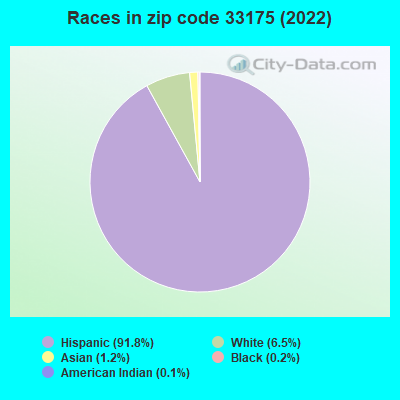
8.8% of residents of 33175 zip code speak English at home.
89.8% of residents speak Spanish at home (54% very well, 19% well, 17% not well, 10% not at all).
1.0% of residents speak other Indo-European language at home (83% very well, 14% well, 2% not well).
0.8% of residents speak Asian or Pacific Island language at home (77% very well, 15% well, 8% not well).
0.1% of residents speak other language at home (100% very well).
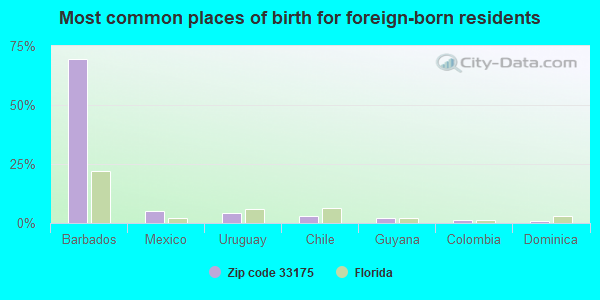
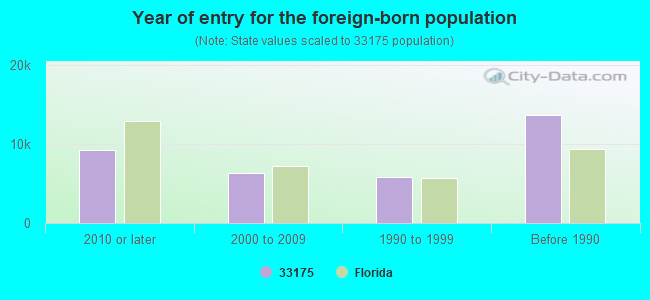
Foreign born population: 34,968 (67.7%) (72.2% of them are naturalized citizens)
Major facilities with environmental interests located in this zip code:
GREENGLADE ELEMENTARY SCHOOL (3060 S.W. 127TH AVENUE in MIAMI, FL)
(Geographic Names Information System) (National Center for Education Statistics) - STATE ID-2261 Small Quantity Generators, between 100 kg and 1000 kg of hazardous waste/month (Resource Conservation and Recovery Act (tracking hazardous waste)) - notification Organizations: LOUIS MANGANIELLO, PRINCIPAL (CONTACT/OWNER)
, DADE COUNTY SCHOOL DISTRICT (SCHOOL DISTRICT)
Alternative names: DADE CO GREENGLADE ELEMENTARY
ROYAL GREEN ELEMENTARY SCHOOL (13047 S.W. 47TH STREET in MIAMI, FL)
(Geographic Names Information System) (National Center for Education Statistics) - STATE ID-4741 Small Quantity Generators, between 100 kg and 1000 kg of hazardous waste/month (Resource Conservation and Recovery Act (tracking hazardous waste)) - notification Organizations: JUDITH RICHARDSON, PRINCIPAL (CONTACT/OWNER)
, DADE COUNTY SCHOOL DISTRICT (SCHOOL DISTRICT)
Alternative names: DADE CO ROYAL GREEN ELEMENTARY
JOE HALL ELEMENTARY SCHOOL (1901 S.W. 134TH AVENUE in MIAMI, FL)
(National Center for Education Statistics) - STATE ID-2341 Small Quantity Generators, between 100 kg and 1000 kg of hazardous waste/month (Resource Conservation and Recovery Act (tracking hazardous waste)) - notification Organizations: BARBARA BELL, PRINCIPAL (CONTACT/OWNER)
, DADE COUNTY SCHOOL DISTRICT (SCHOOL DISTRICT)
Alternative names: DADE CO HALL JOE ELEMENTARY
PINECREST PREPARATORY ACADEMY (14301 S.W. 42ND STREET in MIAMI, FL)
(National Center for Education Statistics) - STATE ID-0600 Organizations: DADE COUNTY SCHOOL DISTRICT (SCHOOL DISTRICT)
MILLER SQUARE CLEANER INC (13706 SW 56TH STREET #101 in MIAMI, FL)
AIR MINOR (AIRS/AFS) (Resource Conservation and Recovery Act (tracking hazardous waste)) Business SIC classification: DRYCLEANING PLANTS, EXCEPT RUG CLEANING Organizations: ESMAIL SADRUDIN, PRES (CONTACT/OWNER)
JOHNVAL DRY CLEAN (12829 SW 42ND STREET in MIAMI, FL)
AIR MINOR (AIRS/AFS) Small Quantity Generators, between 100 kg and 1000 kg of hazardous waste/month (Resource Conservation and Recovery Act (tracking hazardous waste)) - notification Business SIC classification: DRYCLEANING PLANTS, EXCEPT RUG CLEANING Organizations: ENRIQUE CICARELLI, MGR (CONTACT/OWNER)
Alternative names: E C CLEANERS
MIAMI EXPRESS DRY CLEANER, INC (11865 CORAL WAY #E8 in MIAMI, FL)
AIR MINOR (AIRS/AFS) Small Quantity Generators, between 100 kg and 1000 kg of hazardous waste/month (Resource Conservation and Recovery Act (tracking hazardous waste)) - notification Business SIC classification: DRYCLEANING PLANTS, EXCEPT RUG CLEANING Organizations: IRAS DRYCLEANERS (CONTACT/OWNER)
Alternative names: IRA DRYCLEANERS
KENDALL REGIONAL MEDICAL CENTE (11750 SW 40TH ST in MIAMI, FL)
National Pollutant Discharge Elimination System NON-MAJOR (Tracking pollutant discharge elimination systems) - permit Organizations: CHRIS RHODES (CONTACT/OWNER)
SARRIA SHOPPING CENTER (BIRD RD & SW 142ND AVE in MIAMI, FL)
National Pollutant Discharge Elimination System NON-MAJOR (Tracking pollutant discharge elimination systems) - permit Organizations: FRANK SARRIA (CONTACT/OWNER)
CMGD SUBDIVISION (SW 147TH AVE. & SE 31 ST in MIAMI, FL)
National Pollutant Discharge Elimination System NON-MAJOR (Tracking pollutant discharge elimination systems) - permit Organizations: CARLOS VECCIO (CONTACT/OWNER)
AIR MINOR (AIRS/AFS) Business SIC classification: DRYCLEANING PLANTS, EXCEPT RUG CLEANING
RICHARDS CLEANERS INC (13607 SW 26TH STREET in MIAMI, FL)
AIR MINOR (AIRS/AFS) Business SIC classification: DRYCLEANING PLANTS, EXCEPT RUG CLEANING Alternative names: MARTECH
RMJ CORPORATION (839 SW 132ND AVENUE in MIAMI, FL)
AIR MINOR (AIRS/AFS) Business SIC classification: DRYCLEANING PLANTS, EXCEPT RUG CLEANING
Housing units lacking complete plumbing facilities: 0.3% Housing units lacking complete kitchen facilities: 0.5%
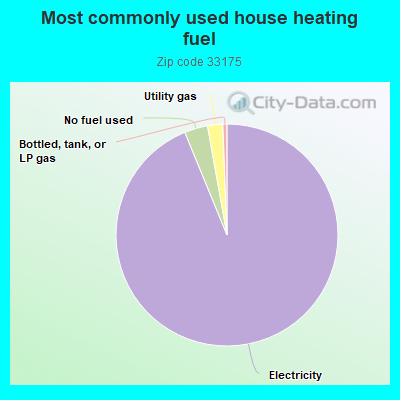
93.8%Electricity
3.4%No fuel used
2.2%Utility gas
0.6%Bottled, tank, or LP gas
Population in 1990: 41,712. Population change in the 1990s: +10,869 (+26.1%).
Place of birth for U.S.-born residents:
This state: 13,148
Northeast: 1,667
Midwest: 462
South: 329
West: 482
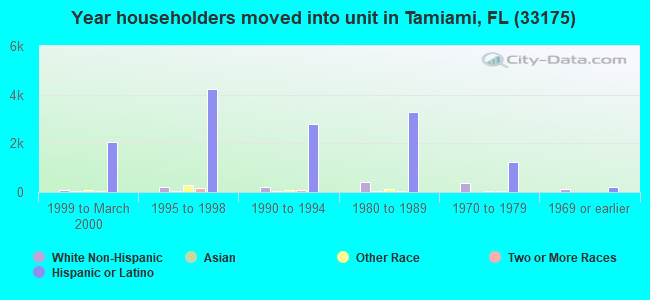
63% of the 33175 zip code residents lived in the same house 5 years ago. Out of people who lived in different houses, 91% lived in this county. Out of people who lived in different counties, 50% lived in Florida.
95% of the 33175 zip code residents lived in the same house 1 year ago. Out of people who lived in different houses, 63% moved from this county. Out of people who lived in different houses, 9% moved from different county within same state. Out of people who lived in different houses, 4% moved from different state. Out of people who lived in different houses, 31% moved from abroad.
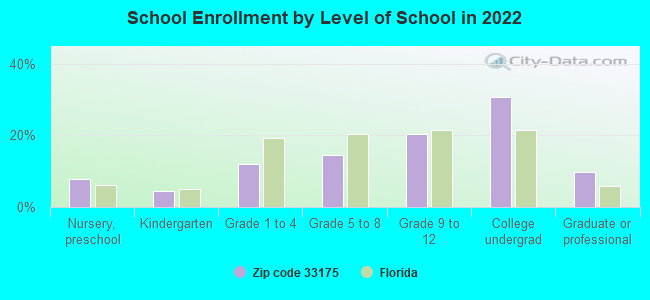
Private vs. public school enrollment:
Students in private schools in grades 1 to 8 (elementary and middle school): 220
Here:
8.2%
Florida:
15.8%
Students in private schools in grades 9 to 12 (high school): 334
Here:
16.2%
Florida:
12.9%
Students in private undergraduate colleges: 415
Here:
13.5%
Florida:
23.6%
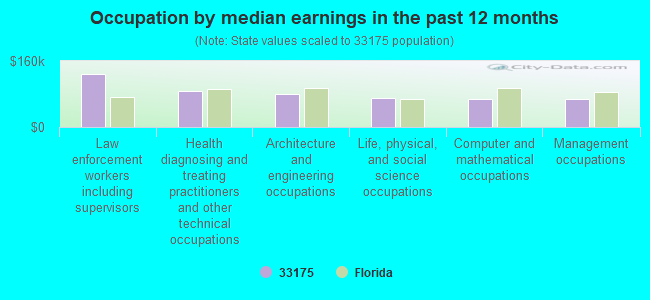
Occupation by median earnings in the past 12 months ($)
128,499Law enforcement workers including supervisors
88,367Health diagnosing and treating practitioners and other technical occupations
80,166Architecture and engineering occupations
70,212Life, physical, and social science occupations
68,291Computer and mathematical occupations
68,144Management occupations
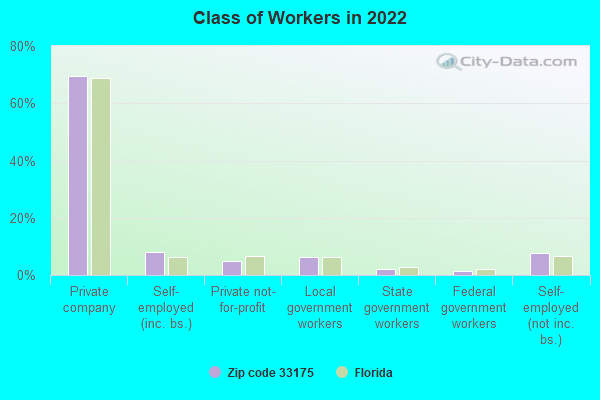
Companies with federal contracts located in this zip code:
EDENS LAND INC (4674 SW 127 PLACE in MIAMI, FL; small business) : $46,245 in 2 contractsfrom 2000 to 2001
$48,645 with Navy for Landscaping/Groundskeeping Services. Signed on 2000-09-27. Completion date: 2000-12-20.
-$2,400, same as above.Signed on 2001-12-28. Completion date: 2001-01-31.
CITY AIR INC (3800 SW 129TH AVENUE in MIAMI, FL; small business) : $17,880 in 2 contractsin 2005
$8,940 with Army for Air Conditioning Equipment. Signed on 2005-07-07. Completion date: 2005-07-29.
$8,940 with U.S. Army Corps of Engineers - civil program financing only for Air Conditioning Equipment. Signed on 2005-07-07. Completion date: 2005-07-29.
EMERGENCY VEHICLE SERVICES, IN (14601 SW 48 ST in MIAMI, FL; small business)
$8,249 with Army for Maintenance, Repair and Rebuilding of Equipment -- Cleaning Equipment and Supplies. Signed on 2004-08-11. Completion date: 2004-08-04.
Top industries in this zip code by the number of employees in 2005:
Health Care and Social Assistance: General Medical and Surgical Hospitals (over 1000 employees: 1 establishment)
2008 - 2018 National Fire Incident Reporting System (NFIRS) incidents
Based on the data from the years 2008 - 2018 the average number of fires per year is 71. The highest number of fire incidents - 104 took place in 2008, and the least - 39 in 2015. The data has a decreasing trend.
When looking into fire subcategories, the most incidents belonged to: Structure Fires (42.7%), and Outside Fires (36.4%).
Fire incident types reported to NFIRS in Zip Code 33175


+$2,091
-$6,005
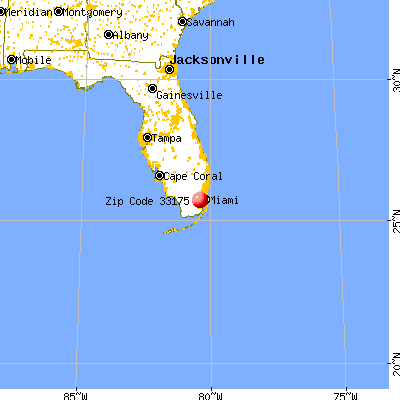
 Nearest zip codes: 33184, 33183, 33185, 33165, 33174, 33173.


 Based on the data from the years 2008 - 2018 the average number of fires per year is 71. The highest number of fire incidents - 104 took place in 2008, and the least - 39 in 2015. The data has a decreasing trend.
 When looking into fire subcategories, the most incidents belonged to: Structure Fires (42.7%), and Outside Fires (36.4%).