Estimated zip code population in 2022: 35,303 Zip code population in 2010: 32,524 Zip code population in 2000: 30,281
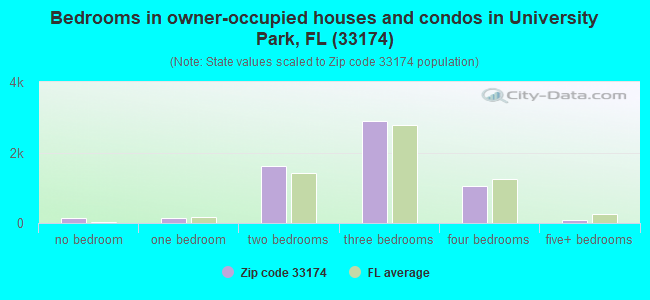
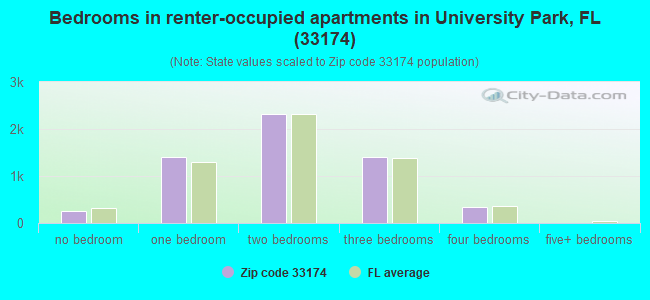
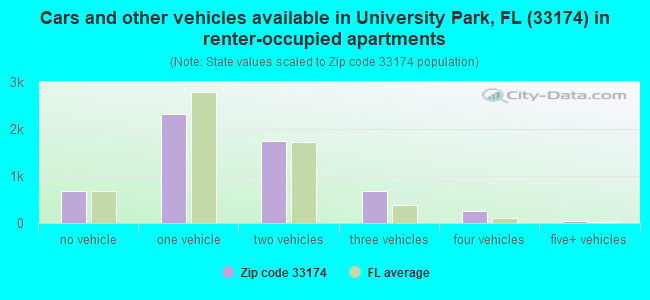
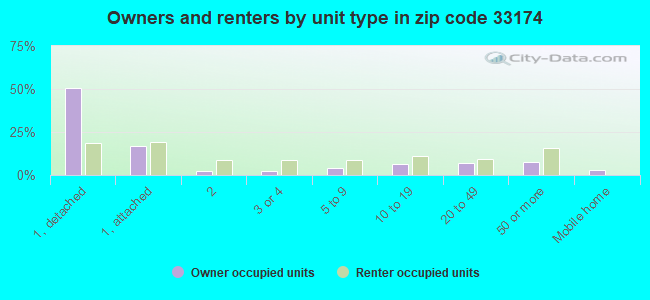
Houses and condos: 11,848 Renter-occupied apartments: 5,726
% of renters here:
49%
State:
33%
March 2022 cost of living index in zip code 33174: 106.3 (more than average, U.S. average is 100)
Land area: 3.1 sq. mi. Water area: 0.1 sq. mi.
Population density: 11,452 people per square mile
(high).
OSM Map
General Map
Google Map
MSN Map
OSM Map
General Map
Google Map
MSN Map
OSM Map
General Map
Google Map
MSN Map
OSM Map
General Map
Google Map
MSN Map
Please wait while loading the map...
Real estate property taxes paid for housing units in 2022:
This zip code:
0.7% ($2,955)
Florida:
0.7% ($2,529)
Median real estate property taxes paid for housing units with mortgages in 2022: $3,453 (0.8%) Median real estate property taxes paid for housing units with no mortgage in 2022: $2,450 (0.6%)
Estimated median house/condo value in 2022: $433,112
33174:
$433,112
Florida:
$354,100
According to our research of Florida and other state lists, there were 8 registered sex offenders living in 33174 zip code as of April 27, 2024. The ratio of all residents to sex offenders in zip code 33174 is 4,131 to 1. The ratio of registered sex offenders to all residents in this zip code is much lower than the state average.
Median resident age:
This zip code:
39.7 years
Florida median age:
42.7 years
Average household size:
This zip code:
2.7 people
Florida:
2.5 people
Averages for the 2020 tax year for zip code 33174, filed in 2021:
Average Adjusted Gross Income (AGI) in 2020: $39,168 (Individual Income Tax Returns)
Here:
$39,168
State:
$82,200
Salary/wage: $38,892 (reported on 76.2% of returns)
Here:
$38,892
State:
$58,347
(% of AGI for various income ranges: 1094.2% for AGIs below $25k, 3677.7% for AGIs $25k-50k, 6907.2% for AGIs $50k-75k, 9862.8% for AGIs $75k-100k, 18971.8% for AGIs $100k-200k, 64035.0% for AGIs over 200k)
Taxable interest for individuals: $1,274 (reported on 13.5% of returns)
This zip code:
$1,274
Florida:
$4,272
(% of AGI for various income ranges: 8.9% for AGIs below $25k, 6.6% for AGIs $25k-50k, 23.3% for AGIs $50k-75k, 61.3% for AGIs $75k-100k, 127.8% for AGIs $100k-200k, 1266.7% for AGIs over 200k)
Ordinary dividends: $1,822 (reported on 6.2% of returns)
Here:
$1,822
State:
$15,863
(% of AGI for various income ranges: 6.2% for AGIs below $25k, 7.6% for AGIs $25k-50k, 20.7% for AGIs $50k-75k, 28.2% for AGIs $75k-100k, 74.7% for AGIs $100k-200k, 631.7% for AGIs over 200k)
Net capital gain/loss in AGI: +$9,887 (reported on 7.9% of returns)
Here:
+$9,887
State:
+$62,983
(% of AGI for various income ranges: 1.9% for AGIs below $25k, 10.8% for AGIs $25k-50k, 76.2% for AGIs $50k-75k, 177.2% for AGIs $75k-100k, 341.2% for AGIs $100k-200k, 14676.7% for AGIs over 200k)
Profit/loss from business: +$4,678 (reported on 38.8% of returns)
Here:
+$4,678
State:
+$9,719
(% of AGI for various income ranges: 282.6% for AGIs below $25k, 136.7% for AGIs $25k-50k, 221.7% for AGIs $50k-75k, 324.2% for AGIs $75k-100k, 429.2% for AGIs $100k-200k, 961.7% for AGIs over 200k)
Taxable individual retirement arrangement distribution: $12,725 (reported on 3.0% of returns)
33174:
$12,725
Florida:
$24,823
(% of AGI for various income ranges: 17.8% for AGIs below $25k, 27.1% for AGIs $25k-50k, 69.0% for AGIs $50k-75k, 148.7% for AGIs $75k-100k, 303.7% for AGIs $100k-200k, 1691.7% for AGIs over 200k)
Total itemized deductions: $31,962 (reported on 5.4% of returns)
Here:
$31,962
State:
$45,393
(% of AGI for various income ranges: 27.6% for AGIs below $25k, 173.2% for AGIs $25k-50k, 386.9% for AGIs $50k-75k, 637.0% for AGIs $75k-100k, 982.0% for AGIs $100k-200k, 10886.7% for AGIs over 200k)
Charity contributions: $5,074 (reported on 3.6% of returns)
Here:
$5,074
State:
$20,178
(% of AGI for various income ranges: 1.7% for AGIs below $25k, 14.9% for AGIs $25k-50k, 49.6% for AGIs $50k-75k, 73.2% for AGIs $75k-100k, 165.3% for AGIs $100k-200k, 776.7% for AGIs over 200k)
Taxes paid: $8,721 (reported on 5.0% of returns)
33174:
$8,721
State:
$6,967
(% of AGI for various income ranges: 8.3% for AGIs below $25k, 58.4% for AGIs $25k-50k, 119.9% for AGIs $50k-75k, 173.8% for AGIs $75k-100k, 275.5% for AGIs $100k-200k, 740.0% for AGIs over 200k)
Earned income credit: $1,914 (reported on 28.0% of returns)
Here:
$1,914
State:
$2,306
(% of AGI for various income ranges: 107.3% for AGIs below $25k, 61.9% for AGIs $25k-50k)
Percentage of individuals using paid preparers for their 2020 taxes: 89.8%
Here:
90%
State:
92%
(% for various income ranges: 88.1% for AGIs below $25k, 91.2% for AGIs $25k-50k, 92.3% for AGIs $50k-75k, 93.1% for AGIs $75k-100k, 91.1% for AGIs $100k-200k, 85.7% for AGIs over 200k)
Averages for the 2012 tax year for zip code 33174, filed in 2013:
Average Adjusted Gross Income (AGI) in 2012: $31,111 (Individual Income Tax Returns)
Here:
$31,111
State:
$60,316
Salary/wage: $30,960 (reported on 80.7% of returns)
Here:
$30,960
State:
$45,277
(% of AGI for various income ranges: 76.2% for AGIs below $25k, 89.4% for AGIs $25k-50k, 83.6% for AGIs $50k-75k, 82.5% for AGIs $75k-100k, 77.8% for AGIs $100k-200k, 54.3% for AGIs over 200k)
Taxable interest for individuals: $1,047 (reported on 15.8% of returns)
This zip code:
$1,047
Florida:
$3,587
(% of AGI for various income ranges: 0.6% for AGIs below $25k, 0.3% for AGIs $25k-50k, 0.5% for AGIs $50k-75k, 0.6% for AGIs $75k-100k, 1.0% for AGIs $100k-200k, 0.3% for AGIs over 200k)
Ordinary dividends: $2,976 (reported on 4.9% of returns)
Here:
$2,976
State:
$12,831
(% of AGI for various income ranges: 0.7% for AGIs below $25k, 0.3% for AGIs $25k-50k, 0.4% for AGIs $50k-75k, 0.4% for AGIs $75k-100k, 0.4% for AGIs $100k-200k, 0.9% for AGIs over 200k)
Net capital gain/loss in AGI: +$6,934 (reported on 3.6% of returns)
Here:
+$6,934
State:
+$33,493
(% of AGI for various income ranges: 0.5% for AGIs $50k-75k, 0.8% for AGIs $75k-100k, 0.9% for AGIs $100k-200k, 7.3% for AGIs over 200k)
Profit/loss from business: +$6,158 (reported on 29.0% of returns)
Here:
+$6,158
State:
+$10,012
(% of AGI for various income ranges: 16.0% for AGIs below $25k, 3.1% for AGIs $25k-50k, 1.9% for AGIs $50k-75k, 2.0% for AGIs $75k-100k, 2.7% for AGIs $100k-200k, 2.7% for AGIs over 200k)
Taxable individual retirement arrangement distribution: $11,052 (reported on 3.6% of returns)
33174:
$11,052
Florida:
$21,544
(% of AGI for various income ranges: 1.1% for AGIs below $25k, 0.8% for AGIs $25k-50k, 1.4% for AGIs $50k-75k, 1.7% for AGIs $75k-100k, 2.9% for AGIs $100k-200k)
Self-employment retirement plans: $3,200 (reported on 0.6% of returns)
33174:
$3,200
Florida:
$20,611
Total itemized deductions: $18,293 (31% of AGI, reported on 19.6% of returns)
Here:
$18,293
State:
$25,533
Here:
30.8% of AGI
State:
18.0% of AGI
(% of AGI for various income ranges: 6.3% for AGIs below $25k, 14.5% for AGIs $25k-50k, 13.6% for AGIs $50k-75k, 12.0% for AGIs $75k-100k, 11.3% for AGIs $100k-200k, 12.9% for AGIs over 200k)
Charity contributions: $2,034 (reported on 14.9% of returns)
Here:
$2,034
State:
$5,698
(% of AGI for various income ranges: 0.3% for AGIs below $25k, 1.1% for AGIs $25k-50k, 1.1% for AGIs $50k-75k, 1.2% for AGIs $75k-100k, 1.4% for AGIs $100k-200k, 1.1% for AGIs over 200k)
Taxes paid: $3,245 (reported on 18.5% of returns)
33174:
$3,245
State:
$6,203
(% of AGI for various income ranges: 0.8% for AGIs below $25k, 2.1% for AGIs $25k-50k, 2.3% for AGIs $50k-75k, 2.3% for AGIs $75k-100k, 2.3% for AGIs $100k-200k, 2.5% for AGIs over 200k)
Earned income credit: $2,093 (reported on 33.6% of returns)
Here:
$2,093
State:
$2,372
(% of AGI for various income ranges: 8.3% for AGIs below $25k, 1.1% for AGIs $25k-50k)
Percentage of individuals using paid preparers for their 2012 taxes: 68.5%
Here:
69%
State:
54%
(% for various income ranges: 66.7% for AGIs below $25k, 71.1% for AGIs $25k-50k, 71.8% for AGIs $50k-75k, 69.6% for AGIs $75k-100k, 70.4% for AGIs $100k-200k, 80.0% for AGIs over 200k)
Averages for the 2004 tax year for zip code 33174, filed in 2005:
Average Adjusted Gross Income (AGI) in 2004: $27,502 (Individual Income Tax Returns)
Here:
$27,502
State:
$50,523
Salary/wage: $27,143 (reported on 83.4% of returns)
Here:
$27,143
State:
$39,563
(% of AGI for various income ranges: 67.4% for AGIs below $10k, 83.2% for AGIs $10k-25k, 91.4% for AGIs $25k-50k, 86.4% for AGIs $50k-75k, 79.9% for AGIs $75k-100k, 67.0% for AGIs over 100k)
Taxable interest for individuals: $1,329 (reported on 25.0% of returns)
This zip code:
$1,329
Florida:
$3,211
(% of AGI for various income ranges: 1.9% for AGIs below $10k, 1.0% for AGIs $10k-25k, 0.6% for AGIs $25k-50k, 1.1% for AGIs $50k-75k, 2.1% for AGIs $75k-100k, 1.8% for AGIs over 100k)
Taxable dividends: $1,028 (reported on 6.1% of returns)
Here:
$1,028
State:
$6,129
(% of AGI for various income ranges: 0.5% for AGIs below $10k, 0.2% for AGIs $10k-25k, 0.1% for AGIs $25k-50k, 0.2% for AGIs $50k-75k, 0.3% for AGIs $75k-100k, 0.4% for AGIs over 100k)
Net capital gain/loss: +$14,485 (reported on 5.2% of returns)
Here:
+$14,485
State:
+$27,205
(% of AGI for various income ranges: -0.3% for AGIs below $10k, 0.2% for AGIs $10k-25k, 0.5% for AGIs $25k-50k, 1.2% for AGIs $50k-75k, 2.1% for AGIs $75k-100k, 12.7% for AGIs over 100k)
Profit/loss from business: +$6,736 (reported on 25.4% of returns)
Here:
+$6,736
State:
+$10,634
(% of AGI for various income ranges: 33.9% for AGIs below $10k, 11.4% for AGIs $10k-25k, 3.0% for AGIs $25k-50k, 2.2% for AGIs $50k-75k, 2.5% for AGIs $75k-100k, 3.3% for AGIs over 100k)
IRA payment deduction: $2,696 (reported on 2.2% of returns)
33174:
$2,696
Florida:
$3,082
(% of AGI for various income ranges: 0.2% for AGIs below $10k, 0.1% for AGIs $10k-25k, 0.2% for AGIs $25k-50k, 0.3% for AGIs $50k-75k, 0.3% for AGIs $75k-100k, 0.2% for AGIs over 100k)
Total itemized deductions: $15,892 (33% of AGI, reported on 26.5% of returns)
Here:
$15,892
State:
$20,370
Here:
32.6% of AGI
State:
20.7% of AGI
(% of AGI for various income ranges: 7.3% for AGIs below $10k, 12.8% for AGIs $10k-25k, 19.4% for AGIs $25k-50k, 17.4% for AGIs $50k-75k, 16.3% for AGIs $75k-100k, 11.0% for AGIs over 100k)
Charity contributions deductions: $1,641 (3% of AGI, reported on 21.4% of returns)
Here:
$1,641
State:
$4,064
Here:
3.2% of AGI
State:
3.8% of AGI
(% of AGI for various income ranges: 0.2% for AGIs below $10k, 0.8% for AGIs $10k-25k, 1.5% for AGIs $25k-50k, 1.5% for AGIs $50k-75k, 1.6% for AGIs $75k-100k, 1.4% for AGIs over 100k)
Total tax: $3,188 (reported on 69.4% of returns)
33174:
$3,188
State:
$9,431
(% of AGI for various income ranges: 5.6% for AGIs below $10k, 3.9% for AGIs $10k-25k, 5.5% for AGIs $25k-50k, 8.7% for AGIs $50k-75k, 10.8% for AGIs $75k-100k, 16.3% for AGIs over 100k)
Earned income credit: $1,743 (reported on 29.9% of returns)
Here:
$1,743
State:
$1,808
Percentage of individuals using paid preparers for their 2004 taxes: 68.8%
Here:
69%
State:
60%
(% for various income ranges: 64.9% for AGIs below $10k, 71.1% for AGIs $10k-25k, 69.5% for AGIs $25k-50k, 67.3% for AGIs $50k-75k, 72.9% for AGIs $75k-100k, 71.3% for AGIs over 100k)
Likely homosexual households (counted as self-reported same-sex unmarried-partner households)
Lesbian couples: 0.1% of all households
Gay men: 0.0% of all households
Household received Food Stamps/SNAP in the past 12 months: 3,233 Household did not receive Food Stamps/SNAP in the past 12 months: 8,320
Women who had a birth in the past 12 months: 318 (201 now married, 116 unmarried) Women who did not have a birth in the past 12 months: 9,277 (2,948 now married, 6,325 unmarried)
Housing units in zip code 33174 with a mortgage: 3,234 (177 second mortgage, 111 both second mortgage and home equity loan) Houses without a mortgage: 58
Median monthly owner costs for units with a mortgage: $1,982 Median monthly owner costs for units without a mortgage: $573
Residents with income below the poverty level in 2022:
This zip code:
13.6%
Whole state:
12.7%
Residents with income below 50% of the poverty level in 2022:
This zip code:
7.2%
Whole state:
6.6%
Median number of rooms in houses and condos:
Here:
5.2
State:
5.9
Median number of rooms in apartments:
Here:
4.0
State:
4.2
Notable locations in this zip code not listed on our city pages
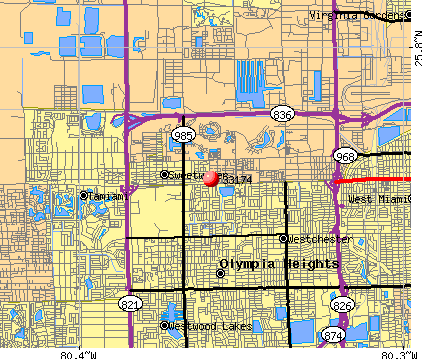
Notable locations in zip code 33174: Sweetwater City Youth Center (A), University Park Library (B), Sweetwater Center (C), Sweetwater Police Station (D), My Little World Day Care Center (E), Leilany Day Care Center (F), Joyce West Family Day Care Home (G), Horta Day Care Center (H), Happy Faces Day Care Center (I), Emaus Day Care Center (J), Fantasyland Day Care Center (K), Creative Kids Learning Center (L), Christian Learning Center (M), Miami - Dade County Fire Rescue Station 29 (N), Sweetwater Police Department (O). Display/hide their locations on the map
Churches in zip code 33174 include: Saint Agatha Church (A), Grace Baptist Church (B), Grace Church of Kendall (C), Iglesia Bautista de Filadelfia (D), Our Lady of Lakes Catholic Church (E). Display/hide their locations on the map
2,459 married couples with children.
1,490 single-parent households (274 men, 1,216 women).
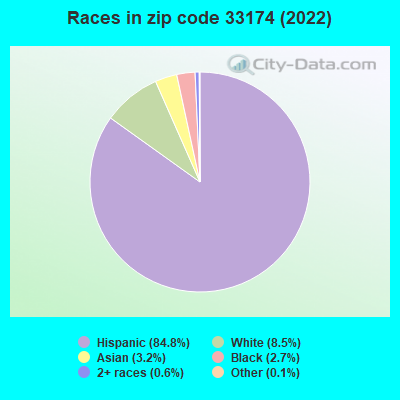
11.6% of residents of 33174 zip code speak English at home.
83.6% of residents speak Spanish at home (43% very well, 22% well, 23% not well, 12% not at all).
2.6% of residents speak other Indo-European language at home (84% very well, 5% well, 11% not well).
1.9% of residents speak Asian or Pacific Island language at home (59% very well, 24% well, 18% not well).
0.8% of residents speak other language at home (80% very well, 12% well, 8% not well).
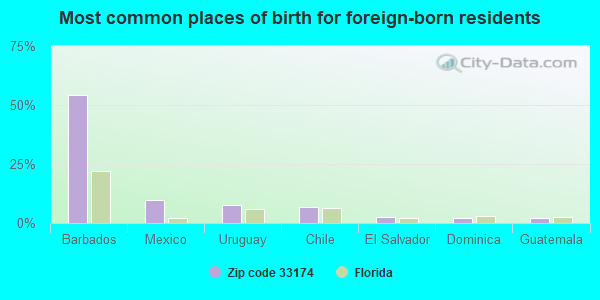
Foreign born population: 25,096 (71.1%) (56.6% of them are naturalized citizens)
This zip code:
71.1%
Whole state:
21.7%
54%Barbados
10%Mexico
8%Uruguay
7%Chile
2%El Salvador
2%Dominica
2%Guatemala
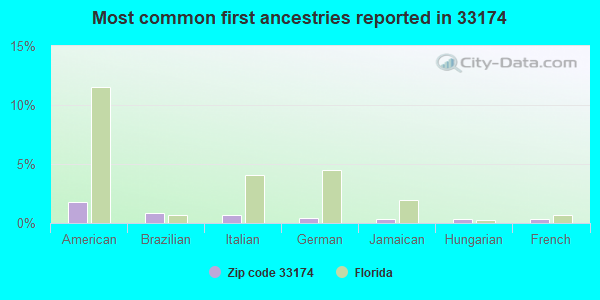
2%American
1%Brazilian
1%Italian
0%German
0%Jamaican
0%Hungarian
0%French
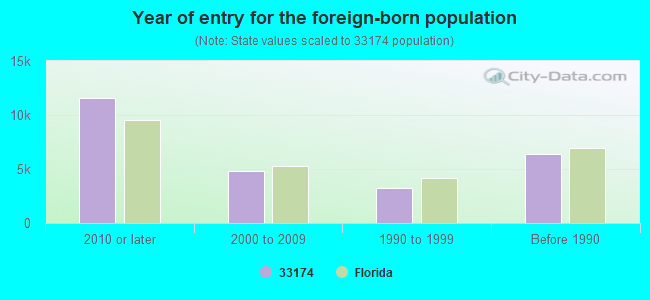
Year of entry for the foreign-born population
11,5362010 or later
4,8132000 to 2009
3,2441990 to 1999
6,430Before 1990
Major facilities with environmental interests located in this zip code:
CORAL PARK ELEMENTARY SCHOOL (1225 S.W. 97TH AVENUE in MIAMI, FL)
(National Center for Education Statistics) - STATE ID-1001 Small Quantity Generators, between 100 kg and 1000 kg of hazardous waste/month (Resource Conservation and Recovery Act (tracking hazardous waste)) - notification Organizations: CAMILLE KING, PRINCIPAL (CONTACT/OWNER)
, DADE COUNTY SCHOOL DISTRICT (SCHOOL DISTRICT)
Alternative names: DADE CO CORAL PARK ELEMENTARY
SHELL #136667 (1569 SW 107TH AVE in MIAMI, FL)
National Pollutant Discharge Elimination System NON-MAJOR (Tracking pollutant discharge elimination systems) - permit Small Quantity Generators, between 100 kg and 1000 kg of hazardous waste/month (Resource Conservation and Recovery Act (tracking hazardous waste)) - notification Business SIC classification: GASOLINE SERVICE STATIONS Organizations: GREG MURPHY, MAINT SUP (CONTACT/OWNER)
, ANNETTE DOKKEN (CONTACT/OWNER)
Alternative names: BP OIL CO #01630
GLOBAL SUNFLOWER CORP (10735 W FLAGLER ST in MIAMI, FL)
AIR MINOR (AIRS/AFS) Small Quantity Generators, between 100 kg and 1000 kg of hazardous waste/month (Resource Conservation and Recovery Act (tracking hazardous waste)) - notification Business SIC classification: DRYCLEANING PLANTS, EXCEPT RUG CLEANING Organizations: EDVARDO MACCONNELL (CONTACT/OWNER)
Alternative names: LAGUNA PLAZA CLEANERS
LINE BY LINE (9716 SW 8TH STREET in MIAMI, FL)
AIR MINOR (AIRS/AFS) Small Quantity Generators, between 100 kg and 1000 kg of hazardous waste/month (Resource Conservation and Recovery Act (tracking hazardous waste)) - notification Business SIC classification: DRYCLEANING PLANTS, EXCEPT RUG CLEANING Organizations: PETER TAYLOR, PRES (CONTACT/OWNER)
Alternative names: TOPP QUALITY CLEANERS
LUIS DRY CLEANERS INC (11400 FLAGLER STREET in MIAMI, FL)
AIR MINOR (AIRS/AFS) Small Quantity Generators, between 100 kg and 1000 kg of hazardous waste/month (Resource Conservation and Recovery Act (tracking hazardous waste)) - notification Business SIC classification: DRYCLEANING PLANTS, EXCEPT RUG CLEANING Organizations: PEDRO BERNAL, PRES (CONTACT/OWNER)
REGLA PAINT & BODY SHOP (11480 SW FLAGLER ST in SWEETWATER, FL)
(Resource Conservation and Recovery Act (tracking hazardous waste)) Organizations: NELSON MORALES, MGR (CONTACT/OWNER)
COASTAL FUELS MARKETING INC (8700 W FLAGLER ST in MIAMI, FL)
AMOCO SERVICE STATION #2006 (11305 W FLAGLER ST in MIAMI, FL)
Small Quantity Generators, between 100 kg and 1000 kg of hazardous waste/month (Resource Conservation and Recovery Act (tracking hazardous waste)) - notification Organizations: R C REMBISZ, DEALER (CONTACT/OWNER)
AMOCO SERVICE STATION #4372 (10450 W FLAGLER ST in SWEETWATER, FL)
Small Quantity Generators, between 100 kg and 1000 kg of hazardous waste/month (Resource Conservation and Recovery Act (tracking hazardous waste)) - notification Organizations: J E PIETRYLA (CONTACT/OWNER)
MCGRAW HILL DIV FW DODGE SCAN (8700 W FLAGLER ST #100 in MIAMI, FL)
Small Quantity Generators, between 100 kg and 1000 kg of hazardous waste/month (Resource Conservation and Recovery Act (tracking hazardous waste)) - notification Organizations: ELLEN BILLINGSLEY (CONTACT/OWNER)
MOBIL OIL CORP SS# 578 (10701 W FLAGLER ST in MIAMI, FL)
Small Quantity Generators, between 100 kg and 1000 kg of hazardous waste/month (Resource Conservation and Recovery Act (tracking hazardous waste)) - notification Organizations: DAN HORTON (CONTACT/OWNER)
NAVARRO (1243 SW 8TH ST in MIAMI, FL)
Small Quantity Generators, between 100 kg and 1000 kg of hazardous waste/month (Resource Conservation and Recovery Act (tracking hazardous waste)) - notification Organizations: JOSE NAVARRO (CONTACT/OWNER)
Housing units lacking complete plumbing facilities: 0.5% Housing units lacking complete kitchen facilities: 0.9%
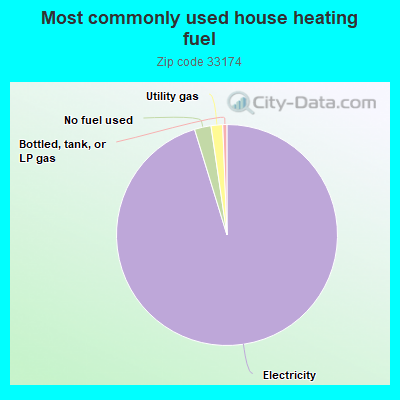
94.7%Electricity
2.4%No fuel used
1.7%Utility gas
0.6%Bottled, tank, or LP gas
Population in 1990: 27,442. Population change in the 1990s: +2,839 (+10.3%).
Place of birth for U.S.-born residents:
This state: 8,328
Northeast: 996
Midwest: 246
South: 356
West: 210
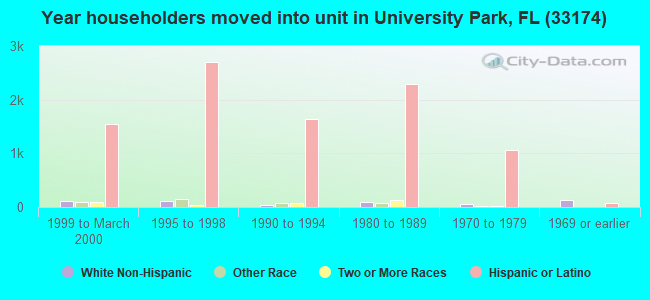
65% of the 33174 zip code residents lived in the same house 5 years ago. Out of people who lived in different houses, 90% lived in this county. Out of people who lived in different counties, 50% lived in Florida.
93% of the 33174 zip code residents lived in the same house 1 year ago. Out of people who lived in different houses, 64% moved from this county. Out of people who lived in different houses, 3% moved from different county within same state. Out of people who lived in different houses, 11% moved from different state. Out of people who lived in different houses, 23% moved from abroad.
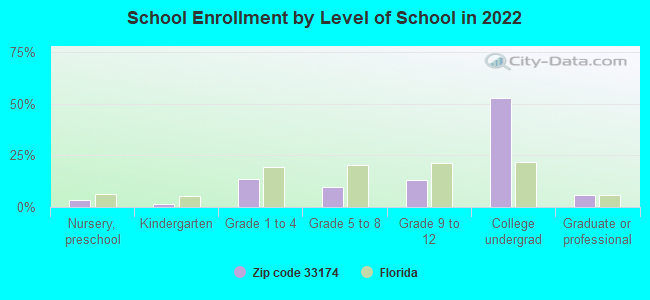
Private vs. public school enrollment:
Students in private schools in grades 1 to 8 (elementary and middle school): 276
Here:
13.7%
Florida:
15.8%
Students in private schools in grades 9 to 12 (high school): 39
Here:
3.5%
Florida:
12.9%
Students in private undergraduate colleges: 1,192
Here:
26.0%
Florida:
23.6%
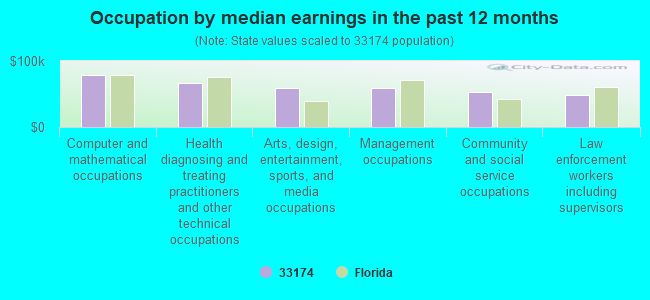
Occupation by median earnings in the past 12 months ($)
79,267Computer and mathematical occupations
67,167Health diagnosing and treating practitioners and other technical occupations
59,748Arts, design, entertainment, sports, and media occupations
59,417Management occupations
53,627Community and social service occupations
48,217Law enforcement workers including supervisors
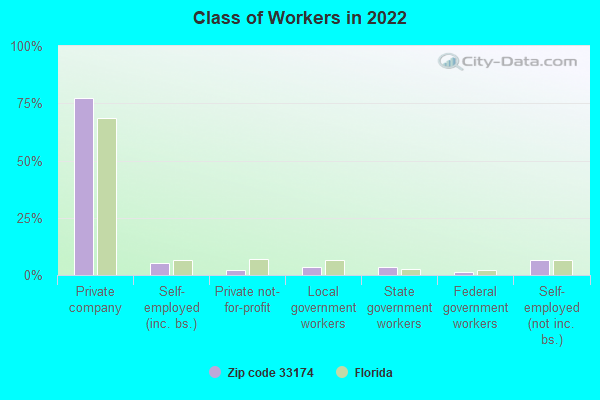
Companies with federal contracts located in this zip code:
FLORIDA POWER & LIGHT COMPANY (9250 WEST FLAGLER STREET in MIAMI, FL) : $53,305,936 in 81 contractsfrom 2001 to 2006
Contracts for Electric Services, Electric Power Generation (EPG), Gas Services, Connectors, Electrical, and moreby Air Force, Public Buildings Service, Department of Veterans Affairs, Federal Emergency Management Agency, and others Signed by year:2000: $0; 2001: $7,661,211; 2002: $16,592,041; 2003: $20,203,418; 2004: $5,027,493; 2005: $3,742,888; 2006: $78,885.
Biggest contracts:
$18,181,442 with Air Force for Electric Services. Signed on 2003-10-01. Completion date: 2004-09-30.
$16,516,055, same as above.Signed on 2002-09-30. Completion date: 2002-09-30.
$7,637,671 with Air Force for Electric Power Generation (EPG). Signed on 2001-09-30. Completion date: 2001-09-30.
$3,737,430 with Public Buildings Service for Electric Services. Signed on 2004-10-01. Completion date: 2005-09-30.
FLORIDA POWER & LIGHT COMPANY (9250 W FLAGLER ST in MIAMI, FL) : $194,704 in 10 contractsfrom 2000 to 2006
Contracts for Electric Services by Army, U.S. Army Corps of Engineers - civil program financing only Signed by year:2000: $50,000; 2001: $0; 2002: $0; 2003: $0; 2004: $0; 2005: $50,327; 2006: $94,377.
Biggest contracts:
$64,518 with Army for Electric Services. Signed on 2005-03-10. Completion date: 2003-09-30.
$50,000 with U.S. Army Corps of Engineers - civil program financing only for Electric Services. Signed on 2000-05-15. Completion date: 2000-09-30.
$28,345 with Army for Electric Services. Signed on 2006-04-21. Completion date: 2003-09-30.
$23,105, same as above.Signed on 2006-01-12. Completion date: 2003-09-30.
RICHARD DOWNES TECHNOLOGY CONS (9400 SW 11TH ST in MIAMI, FL; small business)
$10,641 with Army for Other Special Studies and Analyses. Taking place in TX. Signed on 2006-03-27. Completion date: 2007-03-26.
Top industries in this zip code by the number of employees in 2005:
Utilities: Electric Power Distribution (over 1000 employees: 1 establishment)
Health Care and Social Assistance: Home Health Care Services (250-499: 1, 100-249: 1, 10-19: 1, 1-4: 8)
2008 - 2018 National Fire Incident Reporting System (NFIRS) incidents
Based on the data from the years 2008 - 2018 the average number of fires per year is 40. The highest number of fire incidents - 51 took place in 2009, and the least - 25 in 2016. The data has a decreasing trend.
When looking into fire subcategories, the most incidents belonged to: Structure Fires (45.1%), and Outside Fires (28.9%).
Fire incident types reported to NFIRS in Zip Code 33174


 Nearest zip codes: 33172, 33165, 33184, 33175, 33144, 33155.


 Based on the data from the years 2008 - 2018 the average number of fires per year is 40. The highest number of fire incidents - 51 took place in 2009, and the least - 25 in 2016. The data has a decreasing trend.
 When looking into fire subcategories, the most incidents belonged to: Structure Fires (45.1%), and Outside Fires (28.9%).