Estimated zip code population in 2022: 27,346 Zip code population in 2010: 26,903 Zip code population in 2000: 25,332
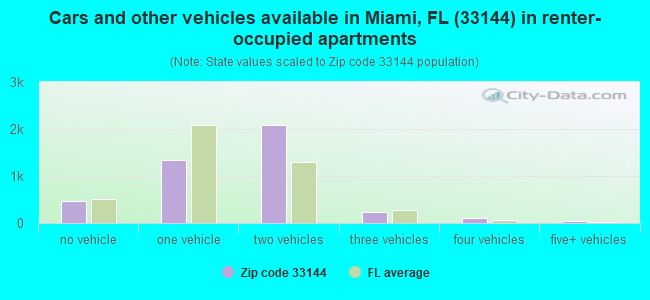
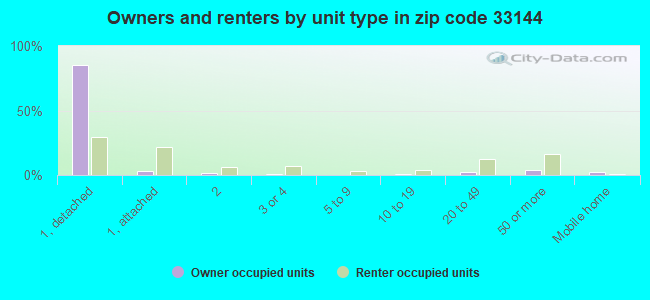
Houses and condos: 10,096 Renter-occupied apartments: 4,292
% of renters here:
44%
State:
33%
March 2022 cost of living index in zip code 33144: 106.9 (more than average, U.S. average is 100)
Land area: 3.1 sq. mi. Water area: 0.0 sq. mi.
Population density: 8,836 people per square mile
(high).
OSM Map
General Map
Google Map
MSN Map
OSM Map
General Map
Google Map
MSN Map
OSM Map
General Map
Google Map
MSN Map
OSM Map
General Map
Google Map
MSN Map
Please wait while loading the map...
Real estate property taxes paid for housing units in 2022:
This zip code:
0.7% ($3,550)
Florida:
0.7% ($2,529)
Median real estate property taxes paid for housing units with mortgages in 2022: $3,992 (0.8%) Median real estate property taxes paid for housing units with no mortgage in 2022: $3,022 (0.7%)
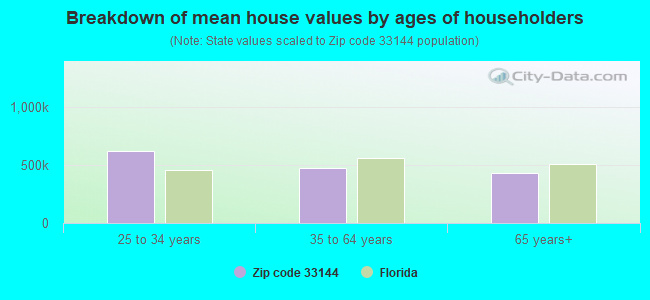
Estimated median house/condo value in 2022: $497,097
33144:
$497,097
Florida:
$354,100
According to our research of Florida and other state lists, there were 6 registered sex offenders living in 33144 zip code as of April 27, 2024. The ratio of all residents to sex offenders in zip code 33144 is 4,709 to 1. The ratio of registered sex offenders to all residents in this zip code is much lower than the state average.
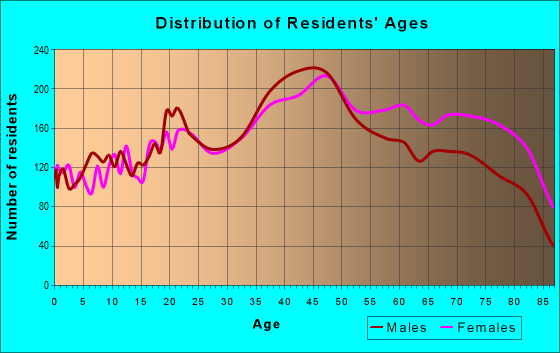
Median resident age:
This zip code:
46.1 years
Florida median age:
42.7 years
Average household size:
This zip code:
2.8 people
Florida:
2.5 people
Averages for the 2020 tax year for zip code 33144, filed in 2021:
Average Adjusted Gross Income (AGI) in 2020: $40,703 (Individual Income Tax Returns)
Here:
$40,703
State:
$82,200
Salary/wage: $40,977 (reported on 72.2% of returns)
Here:
$40,977
State:
$58,347
(% of AGI for various income ranges: 1085.6% for AGIs below $25k, 3772.4% for AGIs $25k-50k, 7075.3% for AGIs $50k-75k, 10904.4% for AGIs $75k-100k, 17973.6% for AGIs $100k-200k, 73172.9% for AGIs over 200k)
Taxable interest for individuals: $1,681 (reported on 13.3% of returns)
This zip code:
$1,681
Florida:
$4,272
(% of AGI for various income ranges: 8.9% for AGIs below $25k, 9.6% for AGIs $25k-50k, 46.3% for AGIs $50k-75k, 56.7% for AGIs $75k-100k, 146.6% for AGIs $100k-200k, 1518.6% for AGIs over 200k)
Ordinary dividends: $2,890 (reported on 5.8% of returns)
Here:
$2,890
State:
$15,863
(% of AGI for various income ranges: 5.7% for AGIs below $25k, 8.7% for AGIs $25k-50k, 36.8% for AGIs $50k-75k, 30.9% for AGIs $75k-100k, 86.8% for AGIs $100k-200k, 1362.9% for AGIs over 200k)
Net capital gain/loss in AGI: +$11,814 (reported on 7.2% of returns)
Here:
+$11,814
State:
+$62,983
(% of AGI for various income ranges: 3.5% for AGIs below $25k, 10.2% for AGIs $25k-50k, 69.9% for AGIs $50k-75k, 50.2% for AGIs $75k-100k, 522.3% for AGIs $100k-200k, 12221.4% for AGIs over 200k)
Profit/loss from business: +$5,425 (reported on 43.7% of returns)
Here:
+$5,425
State:
+$9,719
(% of AGI for various income ranges: 359.3% for AGIs below $25k, 205.4% for AGIs $25k-50k, 308.9% for AGIs $50k-75k, 632.3% for AGIs $75k-100k, 436.6% for AGIs $100k-200k, 1830.0% for AGIs over 200k)
Taxable individual retirement arrangement distribution: $10,744 (reported on 2.8% of returns)
33144:
$10,744
Florida:
$24,823
(% of AGI for various income ranges: 15.0% for AGIs below $25k, 25.5% for AGIs $25k-50k, 68.3% for AGIs $50k-75k, 180.2% for AGIs $75k-100k, 269.6% for AGIs $100k-200k)
Total itemized deductions: $31,075 (reported on 5.9% of returns)
Here:
$31,075
State:
$45,393
(% of AGI for various income ranges: 30.8% for AGIs below $25k, 189.2% for AGIs $25k-50k, 395.9% for AGIs $50k-75k, 906.7% for AGIs $75k-100k, 1364.9% for AGIs $100k-200k, 6800.0% for AGIs over 200k)
Charity contributions: $5,622 (reported on 4.0% of returns)
Here:
$5,622
State:
$20,178
(% of AGI for various income ranges: 1.3% for AGIs below $25k, 20.3% for AGIs $25k-50k, 39.9% for AGIs $50k-75k, 126.3% for AGIs $75k-100k, 161.5% for AGIs $100k-200k, 1241.4% for AGIs over 200k)
Taxes paid: $8,319 (reported on 5.4% of returns)
33144:
$8,319
State:
$6,967
(% of AGI for various income ranges: 8.6% for AGIs below $25k, 62.6% for AGIs $25k-50k, 121.6% for AGIs $50k-75k, 193.5% for AGIs $75k-100k, 308.5% for AGIs $100k-200k, 864.3% for AGIs over 200k)
Earned income credit: $1,777 (reported on 30.7% of returns)
Here:
$1,777
State:
$2,306
(% of AGI for various income ranges: 115.9% for AGIs below $25k, 61.3% for AGIs $25k-50k)
Percentage of individuals using paid preparers for their 2020 taxes: 88.5%
Here:
88%
State:
92%
(% for various income ranges: 86.3% for AGIs below $25k, 91.1% for AGIs $25k-50k, 91.9% for AGIs $50k-75k, 88.6% for AGIs $75k-100k, 90.1% for AGIs $100k-200k, 84.6% for AGIs over 200k)
Averages for the 2012 tax year for zip code 33144, filed in 2013:
Average Adjusted Gross Income (AGI) in 2012: $31,489 (Individual Income Tax Returns)
Here:
$31,489
State:
$60,316
Salary/wage: $30,927 (reported on 78.0% of returns)
Here:
$30,927
State:
$45,277
(% of AGI for various income ranges: 74.3% for AGIs below $25k, 86.8% for AGIs $25k-50k, 81.8% for AGIs $50k-75k, 76.0% for AGIs $75k-100k, 76.6% for AGIs $100k-200k, 53.3% for AGIs over 200k)
Taxable interest for individuals: $1,419 (reported on 15.1% of returns)
This zip code:
$1,419
Florida:
$3,587
(% of AGI for various income ranges: 0.6% for AGIs below $25k, 0.4% for AGIs $25k-50k, 0.6% for AGIs $50k-75k, 0.7% for AGIs $75k-100k, 0.9% for AGIs $100k-200k, 1.4% for AGIs over 200k)
Ordinary dividends: $3,279 (reported on 4.9% of returns)
Here:
$3,279
State:
$12,831
(% of AGI for various income ranges: 0.6% for AGIs below $25k, 0.5% for AGIs $25k-50k, 0.4% for AGIs $50k-75k, 0.8% for AGIs $75k-100k, 0.4% for AGIs $100k-200k, 0.3% for AGIs over 200k)
Net capital gain/loss in AGI: +$5,924 (reported on 3.7% of returns)
Here:
+$5,924
State:
+$33,493
(% of AGI for various income ranges: 0.3% for AGIs $75k-100k, 1.8% for AGIs $100k-200k, 3.9% for AGIs over 200k)
Profit/loss from business: +$6,418 (reported on 30.8% of returns)
Here:
+$6,418
State:
+$10,012
(% of AGI for various income ranges: 17.7% for AGIs below $25k, 3.8% for AGIs $25k-50k, 2.1% for AGIs $50k-75k, 2.2% for AGIs $75k-100k, 3.8% for AGIs $100k-200k)
Taxable individual retirement arrangement distribution: $10,325 (reported on 3.5% of returns)
33144:
$10,325
Florida:
$21,544
(% of AGI for various income ranges: 1.2% for AGIs below $25k, 0.9% for AGIs $25k-50k, 1.1% for AGIs $50k-75k, 1.6% for AGIs $75k-100k, 2.5% for AGIs $100k-200k)
Self-employment retirement plans: $4,175 (reported on 0.3% of returns)
33144:
$4,175
Florida:
$20,611
Total itemized deductions: $19,837 (29% of AGI, reported on 18.5% of returns)
Here:
$19,837
State:
$25,533
Here:
29.4% of AGI
State:
18.0% of AGI
(% of AGI for various income ranges: 6.1% for AGIs below $25k, 13.2% for AGIs $25k-50k, 16.6% for AGIs $50k-75k, 17.4% for AGIs $75k-100k, 11.6% for AGIs $100k-200k, 8.8% for AGIs over 200k)
Charity contributions: $1,991 (reported on 13.0% of returns)
Here:
$1,991
State:
$5,698
(% of AGI for various income ranges: 0.3% for AGIs below $25k, 0.9% for AGIs $25k-50k, 1.0% for AGIs $50k-75k, 1.1% for AGIs $75k-100k, 1.2% for AGIs $100k-200k, 0.8% for AGIs over 200k)
Taxes paid: $3,493 (reported on 16.6% of returns)
33144:
$3,493
State:
$6,203
(% of AGI for various income ranges: 0.9% for AGIs below $25k, 2.0% for AGIs $25k-50k, 2.3% for AGIs $50k-75k, 2.4% for AGIs $75k-100k, 2.4% for AGIs $100k-200k, 1.6% for AGIs over 200k)
Earned income credit: $2,045 (reported on 35.7% of returns)
Here:
$2,045
State:
$2,372
(% of AGI for various income ranges: 8.4% for AGIs below $25k, 1.1% for AGIs $25k-50k)
Percentage of individuals using paid preparers for their 2012 taxes: 67.2%
Here:
67%
State:
54%
(% for various income ranges: 66.5% for AGIs below $25k, 67.1% for AGIs $25k-50k, 67.9% for AGIs $50k-75k, 68.0% for AGIs $75k-100k, 73.2% for AGIs $100k-200k, 90.9% for AGIs over 200k)
Averages for the 2004 tax year for zip code 33144, filed in 2005:
Average Adjusted Gross Income (AGI) in 2004: $28,463 (Individual Income Tax Returns)
Here:
$28,463
State:
$50,523
Salary/wage: $26,952 (reported on 79.9% of returns)
Here:
$26,952
State:
$39,563
(% of AGI for various income ranges: 69.7% for AGIs below $10k, 80.4% for AGIs $10k-25k, 89.0% for AGIs $25k-50k, 83.7% for AGIs $50k-75k, 79.4% for AGIs $75k-100k, 48.3% for AGIs over 100k)
Taxable interest for individuals: $1,467 (reported on 27.1% of returns)
This zip code:
$1,467
Florida:
$3,211
(% of AGI for various income ranges: 2.7% for AGIs below $10k, 1.3% for AGIs $10k-25k, 0.7% for AGIs $25k-50k, 1.1% for AGIs $50k-75k, 2.1% for AGIs $75k-100k, 1.9% for AGIs over 100k)
Taxable dividends: $1,419 (reported on 6.4% of returns)
Here:
$1,419
State:
$6,129
(% of AGI for various income ranges: 0.5% for AGIs below $10k, 0.3% for AGIs $10k-25k, 0.2% for AGIs $25k-50k, 0.3% for AGIs $50k-75k, 0.2% for AGIs $75k-100k, 0.5% for AGIs over 100k)
Net capital gain/loss: +$13,238 (reported on 6.1% of returns)
Here:
+$13,238
State:
+$27,205
(% of AGI for various income ranges: -0.4% for AGIs below $10k, 0.6% for AGIs $10k-25k, 0.8% for AGIs $25k-50k, 1.8% for AGIs $50k-75k, 2.4% for AGIs $75k-100k, 9.2% for AGIs over 100k)
Profit/loss from business: +$7,543 (reported on 27.5% of returns)
Here:
+$7,543
State:
+$10,634
(% of AGI for various income ranges: 39.8% for AGIs below $10k, 11.8% for AGIs $10k-25k, 3.7% for AGIs $25k-50k, 3.6% for AGIs $50k-75k, 3.1% for AGIs $75k-100k, 5.0% for AGIs over 100k)
IRA payment deduction: $2,433 (reported on 2.3% of returns)
33144:
$2,433
Florida:
$3,082
(% of AGI for various income ranges: 0.3% for AGIs below $10k, 0.2% for AGIs $10k-25k, 0.3% for AGIs $25k-50k, 0.2% for AGIs $50k-75k, 0.2% for AGIs $75k-100k, 0.1% for AGIs over 100k)
Total itemized deductions: $17,396 (33% of AGI, reported on 24.9% of returns)
Here:
$17,396
State:
$20,370
Here:
33.5% of AGI
State:
20.7% of AGI
(% of AGI for various income ranges: 7.0% for AGIs below $10k, 13.4% for AGIs $10k-25k, 18.7% for AGIs $25k-50k, 16.7% for AGIs $50k-75k, 16.0% for AGIs $75k-100k, 12.9% for AGIs over 100k)
Charity contributions deductions: $1,658 (3% of AGI, reported on 20.7% of returns)
Here:
$1,658
State:
$4,064
Here:
3.0% of AGI
State:
3.8% of AGI
(% of AGI for various income ranges: 0.3% for AGIs below $10k, 0.8% for AGIs $10k-25k, 1.5% for AGIs $25k-50k, 1.4% for AGIs $50k-75k, 1.8% for AGIs $75k-100k, 1.0% for AGIs over 100k)
Total tax: $3,837 (reported on 70.3% of returns)
33144:
$3,837
State:
$9,431
(% of AGI for various income ranges: 6.8% for AGIs below $10k, 3.9% for AGIs $10k-25k, 6.0% for AGIs $25k-50k, 9.0% for AGIs $50k-75k, 10.6% for AGIs $75k-100k, 19.8% for AGIs over 100k)
Earned income credit: $1,579 (reported on 30.4% of returns)
Here:
$1,579
State:
$1,808
Percentage of individuals using paid preparers for their 2004 taxes: 71.1%
Here:
71%
State:
60%
(% for various income ranges: 69.4% for AGIs below $10k, 72.4% for AGIs $10k-25k, 69.5% for AGIs $25k-50k, 71.4% for AGIs $50k-75k, 74.8% for AGIs $75k-100k, 79.6% for AGIs over 100k)
Likely homosexual households (counted as self-reported same-sex unmarried-partner households)
Lesbian couples: 0.1% of all households
Gay men: 0.2% of all households
Household received Food Stamps/SNAP in the past 12 months: 2,344 Household did not receive Food Stamps/SNAP in the past 12 months: 7,401
Women who had a birth in the past 12 months: 180 (68 now married, 105 unmarried) Women who did not have a birth in the past 12 months: 5,279 (2,702 now married, 2,578 unmarried)
Housing units in zip code 33144 with a mortgage: 2,778 (346 second mortgage, 302 both second mortgage and home equity loan) Houses without a mortgage: 103
Median monthly owner costs for units with a mortgage: $2,163 Median monthly owner costs for units without a mortgage: $687
Residents with income below the poverty level in 2022:
This zip code:
10.1%
Whole state:
12.7%
Residents with income below 50% of the poverty level in 2022:
This zip code:
6.1%
Whole state:
6.6%
Median number of rooms in houses and condos:
Here:
5.4
State:
5.9
Median number of rooms in apartments:
Here:
3.6
State:
4.2
Notable locations in this zip code not listed on our city pages
Notable locations in zip code 33144: Florida Power and Light Cutler Power Plant (A), West Miami Police Station (B), Tamiami Baptist Child Development Center (C), Tamiami Child Development Center (D), Palmetto Subacute Care Center (E), Little People Learning Center (F), Kiddieland Child Care Center (G), Isabel Vasquez Family Day Care Center (H), Gudelia Moreira Family Day Care Center (I), Fairlawn Library (J), Discovery Years Child Care Center (K), Coral Gables Convalescent Center (L), Cari Cares for Kids Day Care Center (M), Miami - Dade County Fire Rescue Station 40 (N), City of Miami Department of Fire Rescue Station 11 (O). Display/hide their locations on the map
2,009 married couples with children.
1,216 single-parent households (169 men, 1,047 women).
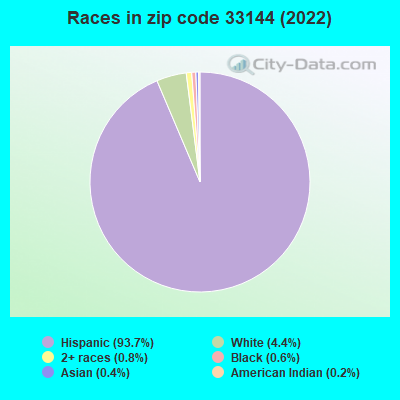
9.7% of residents of 33144 zip code speak English at home.
90.0% of residents speak Spanish at home (43% very well, 20% well, 24% not well, 12% not at all).
0.4% of residents speak other Indo-European language at home (76% very well, 15% well, 9% not well).
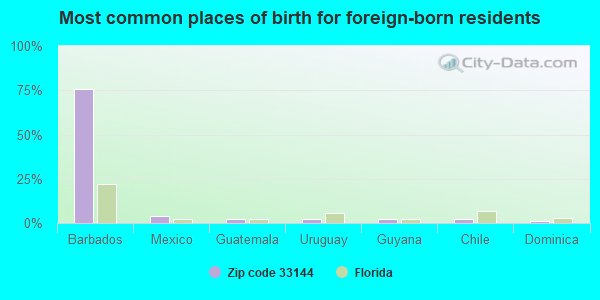
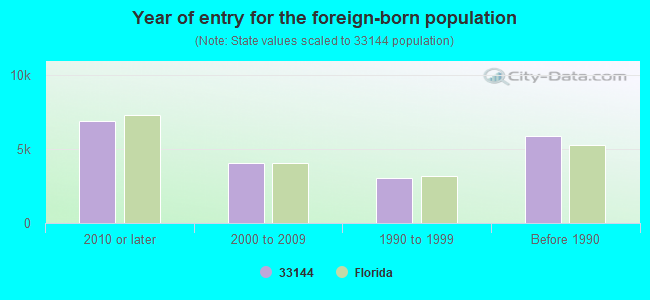
Foreign born population: 19,726 (72.1%) (62.8% of them are naturalized citizens)
Major facilities with environmental interests located in this zip code:
APACHE PRODUCTS COMPANY (1020 SOUTHWEST 69TH AVENUE in MIAMI, FL)
AIR MINOR (AIRS/AFS) CRITERIA AND HAZARDOUS AIR POLLUTANT INVENTORY (Inventory of air pollution sources) TRI REPORTER (Tracking of toxic chemicals releasing facilities) - ICIS-, ENFORCEMENT/COMPLIANCE ACTIVITY Business SIC classification: PLASTICS MATERIALS, SYNTHETIC RESINS, AND NONVULCANIZABLE ELASTOMERS; PLASTICS FOAM PRODUCTS Business NAICS classification: PLASTICS MATERIAL AND RESIN MANUFACTURING.
SEMINOLE ELEMENTARY SCHOOL (121 S.W. 78TH PLACE in MIAMI, FL)
(National Center for Education Statistics) - STATE ID-4921 Small Quantity Generators, between 100 kg and 1000 kg of hazardous waste/month (Resource Conservation and Recovery Act (tracking hazardous waste)) - notification Organizations: GLORIA FISHER, PRINCIPAL (CONTACT/OWNER)
, DADE COUNTY SCHOOL DISTRICT (SCHOOL DISTRICT)
Alternative names: DADE CO SEMINOLE ELEMENTARY
MARTINO TIRE CO GOODYEAR (7145 SW 8TH ST in MIAMI, FL)
(Integrated Compliance Information System) - ICIS-04-1995-0402, FORMAL ENFORCEMENT ACTION, ICIS-04-2002-1501, Small Quantity Generators, between 100 kg and 1000 kg of hazardous waste/month (Resource Conservation and Recovery Act (tracking hazardous waste)) - notification Organizations: B RODRIQUEZ, ASST MGR (CONTACT/OWNER)
POST COL INC (6101 SW 8TH STREET in MIAMI, FL)
AIR MINOR (AIRS/AFS) Small Quantity Generators, between 100 kg and 1000 kg of hazardous waste/month (Resource Conservation and Recovery Act (tracking hazardous waste)) - notification Business SIC classification: DRYCLEANING PLANTS, EXCEPT RUG CLEANING Organizations: ERNESTO TORRES (CONTACT/OWNER)
Alternative names: SUPER CLEANER CORPORATION, SUPER CLEANERS ENTERPRISES
R & S CLEANERS INC (7974 SW 8TH STREET in MIAMI, FL)
AIR MINOR (AIRS/AFS) (Resource Conservation and Recovery Act (tracking hazardous waste)) Business SIC classification: DRYCLEANING PLANTS, EXCEPT RUG CLEANING Organizations: LEAL SANTIAGO, DIR (CONTACT/OWNER)
R & H PAINT & BODY INC (1681 SW 67TH AVE in WEST MIAMI, FL)
Small Quantity Generators, between 100 kg and 1000 kg of hazardous waste/month (Resource Conservation and Recovery Act (tracking hazardous waste)) - notification (Resource Conservation and Recovery Act (tracking hazardous waste)) Organizations: RAY HERNANDEZ (CONTACT/OWNER)
, HERNANDEZ REY V P (CONTACT/OWNER)
AMERICLEAN (8464 SW 8TH ST in MIAMI, FL)
AIR MINOR (AIRS/AFS) Small Quantity Generators, between 100 kg and 1000 kg of hazardous waste/month (Resource Conservation and Recovery Act (tracking hazardous waste)) - notification Business SIC classification: DRYCLEANING PLANTS, EXCEPT RUG CLEANING
J. POOL DEPOT (924 SOTHWEST 82 AVENUE in MIAMI, FL)
COMPLIANCE ACTIVITY (Tracking inspections of insecticide, fungicide, and rodenticide, and toxic substances)
ALEMAN CHEVRON (7350 W FLAGLER ST in MIAMI, FL)
(Resource Conservation and Recovery Act (tracking hazardous waste)) Organizations: JOSE ALEMAN (CONTACT/OWNER)
ALFREDO BARCELO - FOUR LOTS ( in MIAMI, FL)
National Pollutant Discharge Elimination System NON-MAJOR (Tracking pollutant discharge elimination systems) - permit
JEFFERSON WARD MIAMI MIDWAY (7709 WEST FLAGLER STREET in MIAMI, FL)
(Resource Conservation and Recovery Act (tracking hazardous waste)) Organizations: JAY WIGHT, MAINT MGR (CONTACT/OWNER)
INTERMOTOR PAINT & BODY (7068 SW 4TH ST in MIAMI, FL)
(Resource Conservation and Recovery Act (tracking hazardous waste)) Organizations: JOE PUERTO, OWNER (CONTACT/OWNER)
BOB & EDS AUTO & TRUCK SERVICE CENTER (821 SW 67TH AVE in MIAMI, FL)
(Resource Conservation and Recovery Act (tracking hazardous waste)) Organizations: ROBERT C LOHMAN (CONTACT/OWNER)
Housing units lacking complete plumbing facilities: 0.6% Housing units lacking complete kitchen facilities: 1.5%
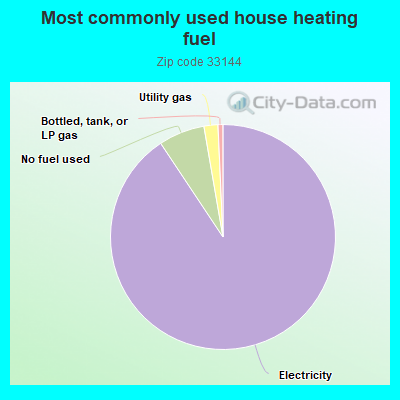
90.3%Electricity
6.6%No fuel used
2.0%Utility gas
0.7%Bottled, tank, or LP gas
Population in 1990: 22,968. Population change in the 1990s: +2,364 (+10.3%).
Place of birth for U.S.-born residents:
This state: 6,361
Northeast: 633
Midwest: 200
South: 280
West: 217
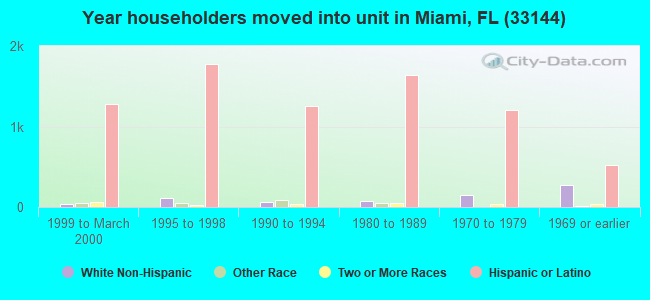
66% of the 33144 zip code residents lived in the same house 5 years ago. Out of people who lived in different houses, 93% lived in this county. Out of people who lived in different counties, 50% lived in Florida.
92% of the 33144 zip code residents lived in the same house 1 year ago. Out of people who lived in different houses, 63% moved from this county. Out of people who lived in different houses, 4% moved from different county within same state. Out of people who lived in different houses, 7% moved from different state. Out of people who lived in different houses, 27% moved from abroad.
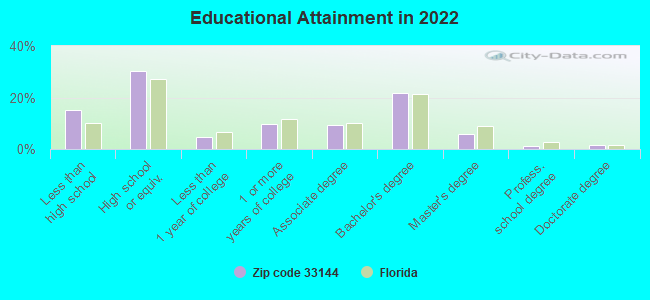
Private vs. public school enrollment:
Students in private schools in grades 1 to 8 (elementary and middle school): 105
Here:
7.1%
Florida:
15.8%
Students in private schools in grades 9 to 12 (high school): 142
Here:
11.5%
Florida:
12.9%
Students in private undergraduate colleges: 266
Here:
22.9%
Florida:
23.6%
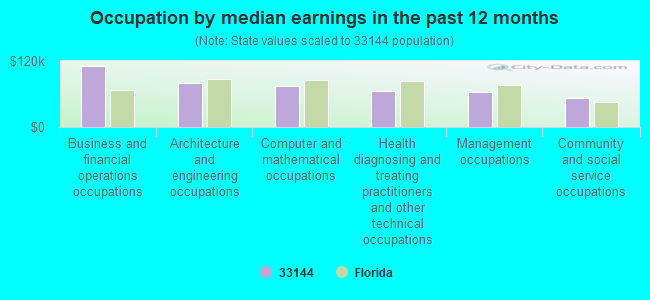
Occupation by median earnings in the past 12 months ($)
110,833Business and financial operations occupations
80,027Architecture and engineering occupations
74,442Computer and mathematical occupations
66,182Health diagnosing and treating practitioners and other technical occupations
62,802Management occupations
51,986Community and social service occupations
Companies with federal contracts located in this zip code:
TIGER DIRECT INC (7795 W FLAGLER ST STE 35 in MIAMI, FL; small business) : $3,336,298 in 161 contractsfrom 2001 to 2006
Contracts for Gas Services, ADP Support Equipment, Office Information System Equipment, Communications Security Equipment and Components, and moreby Department of Veterans Affairs, Navy, U.S. Secret Service, Department of State, and others Signed by year:2000: $0; 2001: $445,000; 2002: $1,023,436; 2003: $929,069; 2004: $188,457; 2005: $422,268; 2006: $328,068.
Biggest contracts:
$523,505 with Department of Veterans Affairs for Gas Services. Taking place in IA. Signed on 2002-10-15. Completion date: 2004-10-15.
$445,000, same as above.Signed on 2001-10-15. Completion date: 2002-06-15.
$405,011, same as above.Signed on 2003-07-15. Completion date: 2003-10-15.
$276,129, same as above.Signed on 2003-10-01. Completion date: 2004-06-30.
U.S K-9 ACADEMY & DOG TRAINING CENTER (8357 West flager street in Miami, FL)
$81,200 with Department of State for Technical Representation Services -- Live Animals. Signed on 2005-03-30. Completion date: 2005-04-05.
Top industries in this zip code by the number of employees in 2005:
2005 - 2018 National Fire Incident Reporting System (NFIRS) incidents
Based on the data from the years 2005 - 2018 the average number of fire incidents per year is 68. The highest number of reported fire incidents - 97 took place in 2010, and the least - 46 in 2015. The data has an increasing trend.
When looking into fire subcategories, the most incidents belonged to: Structure Fires (50.4%), and Mobile Property/Vehicle Fires (25.2%).
Fire incident types reported to NFIRS in Zip Code 33144
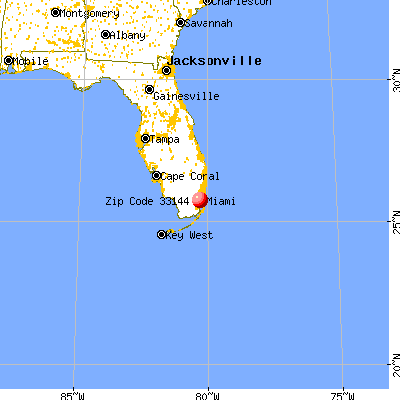


 Nearest zip codes: 33126, 33155, 33122, 33134, 33174, 33172.


 Based on the data from the years 2005 - 2018 the average number of fire incidents per year is 68. The highest number of reported fire incidents - 97 took place in 2010, and the least - 46 in 2015. The data has an increasing trend.
 When looking into fire subcategories, the most incidents belonged to: Structure Fires (50.4%), and Mobile Property/Vehicle Fires (25.2%).