Races in Westerly, Rhode Island (RI) Detailed Stats
Ancestries, Foreign-born residents, place of birth
Settings
X


Recent posts about races in Westerly, Rhode Island on our local forum with over 2,400,000 registered users:
 | Buying a house in RI vs CT? (177 replies) |
| "Woonsocket Man" (Rocket Man parody) (514 replies) |
| WOW! What's going on with Westerly Real Estate? (81 replies) |
| Compare Westerly and Newport (4 replies) |
| Why is Westerly so Inexpensive? (76 replies) |
| RI Real Estate in huge demand (147 replies) |
Latest news about races in Westerly, RI collected exclusively by city-data.com from local newspapers, TV, and radio stations
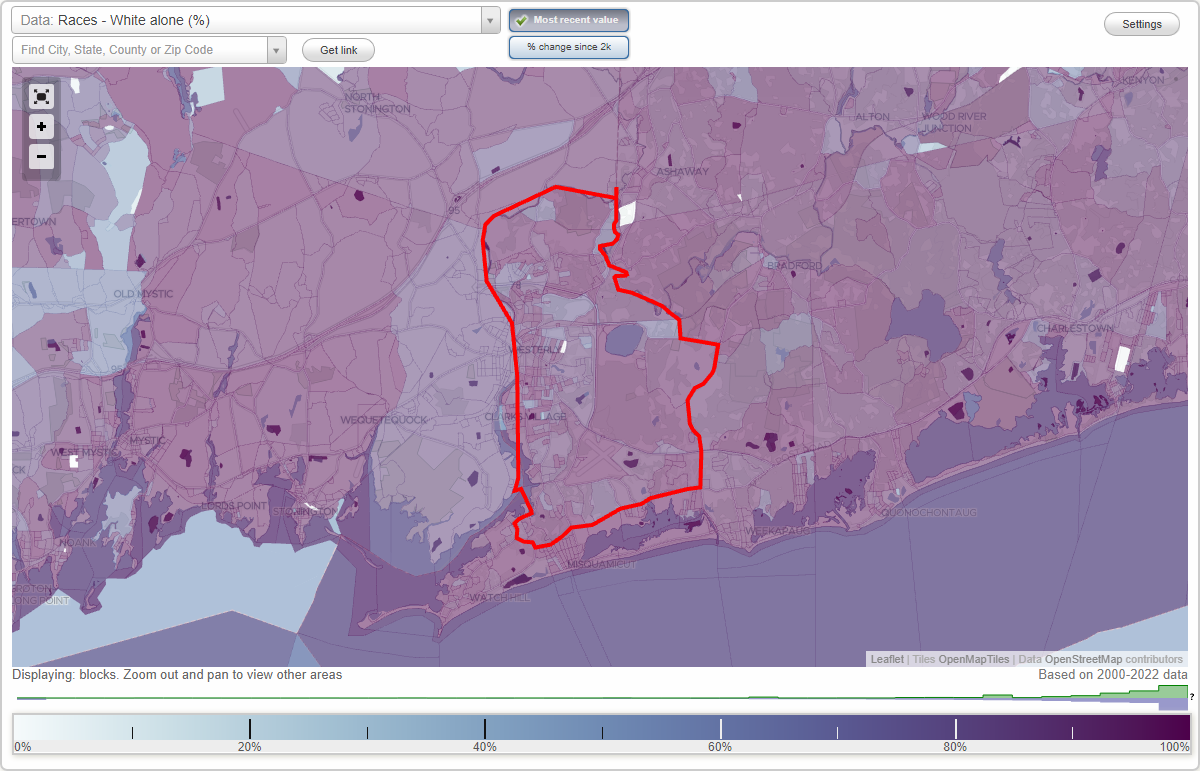
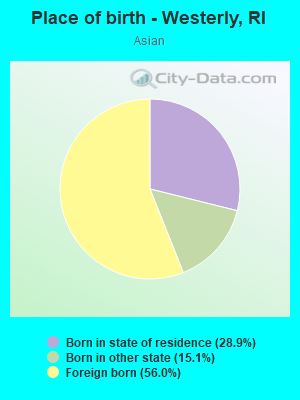
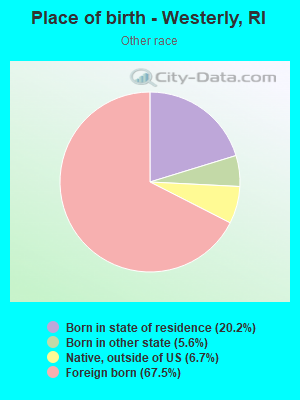
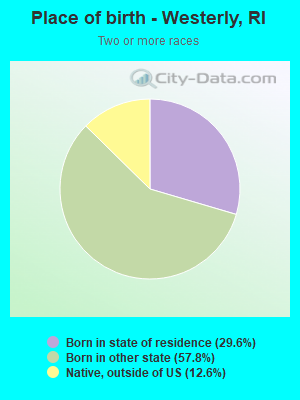
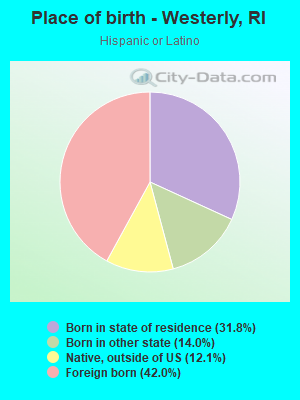
According to 2022 data, the most numerous races in Westerly, RI are White alone (16,082 residents), Hispanic (881 residents), and Two or more races (622 residents). 92.6% of Westerly residents speak English at home. 6.0% of Westerly, RI residents are foreign-born (2.2% born in Latin America, 1.7% born in Europe, 1.5% born in Asia), which is 132.7% less than the foreign-born rate of 14.0% across the entire state of Rhode Island.
Race distribution in Westerly
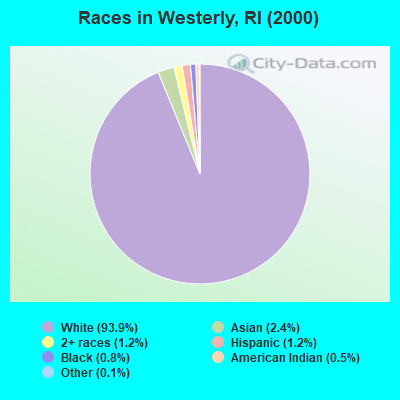
2000
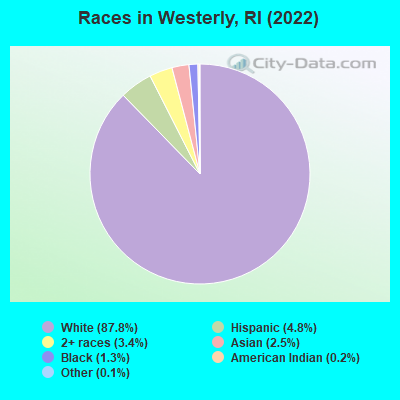
2022

- 16,59693.9%White alone
- 4222.4%Asian alone
- 2051.2%Hispanic
- 2081.2%Two or more races
- 1410.8%Black alone
- 910.5%American Indian alone
- 190.1%Other race alone
-
- 16,08287.8%White alone
- 8814.8%Hispanic
- 6223.4%Two or more races
- 4522.5%Asian alone
- 2361.3%Black alone
- 390.2%American Indian alone
- 200.1%Other race alone
2000
2022
-
- 858,43381.9%White alone
- 90,8208.7%Hispanic
- 41,9224.0%Black alone
- 23,4162.2%Asian alone
- 20,8162.0%Two or more races
- 8,4110.8%Other race alone
- 4,1810.4%American Indian alone
- 3200.03%Native Hawaiian and Other
Pacific Islander alone

-
- 745,82568.2%White alone
- 191,97917.6%Hispanic
- 56,7385.2%Two or more races
- 51,3264.7%Black alone
- 37,2343.4%Asian alone
- 9,5140.9%Other race alone
- 9780.09%American Indian alone
- 1400.01%Native Hawaiian and Other
Pacific Islander alone

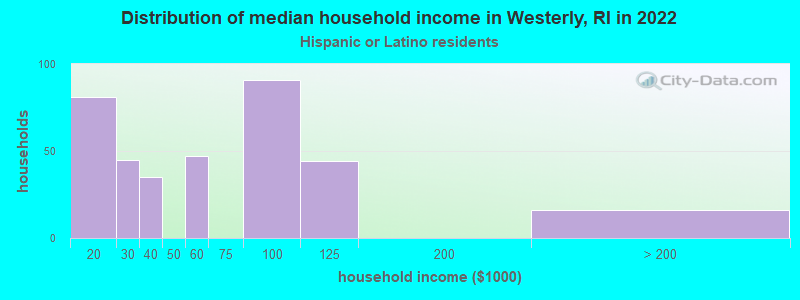
Income and house value in Westerly
- Median household income in 2022
- $91,326White non-Hispanic householders
- $61,529Some other race householders
- Median 2022 house value
- $434,774White Non-Hispanic householders
- $402,306Black or African American householders
- $387,548Asian householders
- $490,265Two or more races householders
- $425,920Hispanic or Latino householders
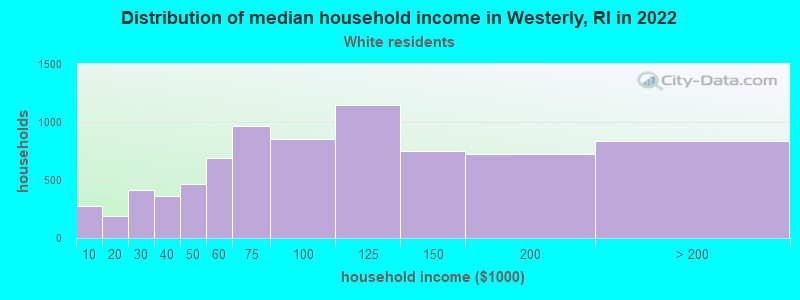
Household income for White non-Hispanic householders
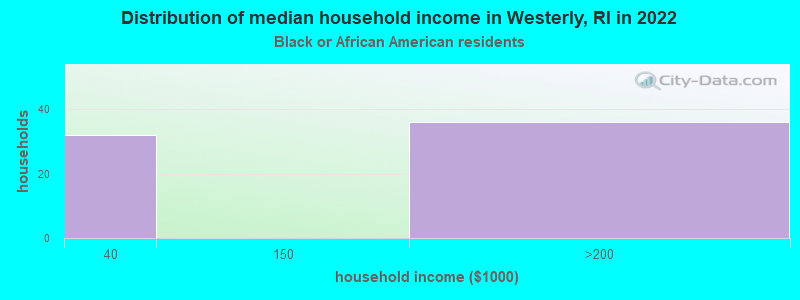
Household income for Black householders
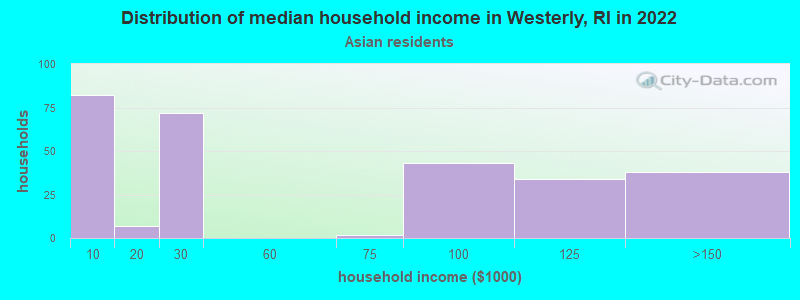
Household income for Asian householders
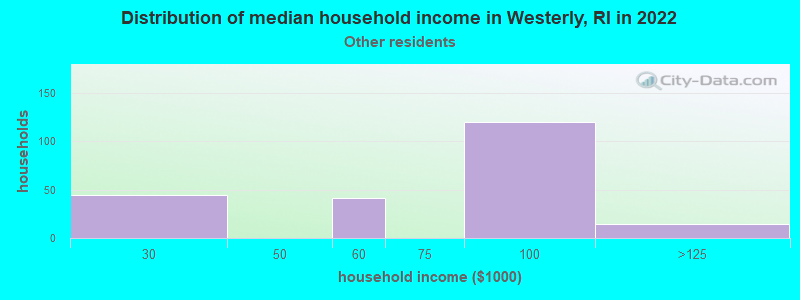
Household income for Some other race householders
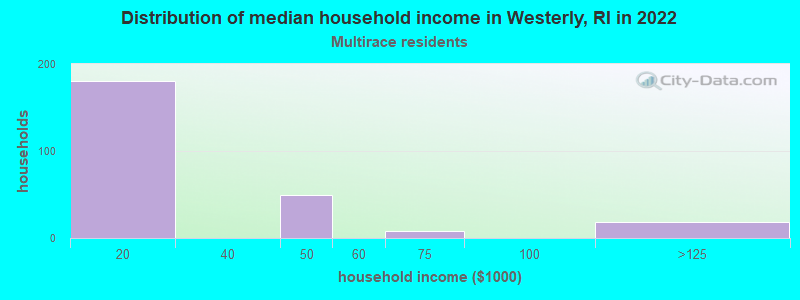
Household income for Two or more races householders
Household income for Hispanic or Latino race householders
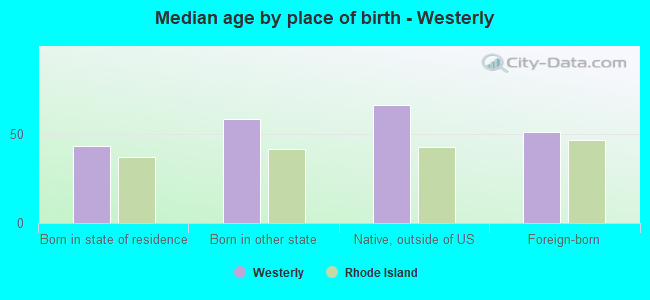
Median age by race in Westerly
- 53.6Median age for White residents
- 48.5Males
- 55.6Females
- 31.3Median age for Black or African American residents
- 31.9Males
- 49.0Females
- 92.1Median age for American Indian / Alaska Native residents
- -743,837,083.9Males
- -606,811,144.9Females
- 68.7Median age for Asian residents
- 35.4Males
- 65.0Females
- -666,666,666.0Median age for Native Hawaiian / Pacific Islander residents
- -666,666,666.0Males
- -666,666,666.0Females
- 21.4Median age for Other race residents
- 21.7Males
- 28.8Females
- 39.4Median age for Two or more races residents
- 38.5Males
- 88.6Females
- 53.4Median age for White alone residents
- 48.3Males
- 55.1Females
- 42.6Median age for Hispanic or Latino residents
- 35.0Males
- 50.8Females
Owner/renter occupied households by race in Westerly
- House owners and renters - White residents
- 5,37570.4%Owner occupied
- 2,26229.6%Renter occupied
- House owners and renters - Black or African American residents
- 53100.0%Owner occupied
- House owners and renters - American Indian / Alaska Native residents
- 27100.0%Renter occupied
- House owners and renters - Asian residents
- 25993.6%Owner occupied
- 186.4%Renter occupied
- House owners and renters - Other race residents
- 166.0%Owner occupied
- 24894.0%Renter occupied
- House owners and renters - Two or more races residents
- 16864.3%Owner occupied
- 9335.7%Renter occupied
- House owners and renters - White alone residents
- 5,35670.0%Owner occupied
- 2,29830.0%Renter occupied
- House owners and renters - Hispanic or Latino residents
- 16432.5%Owner occupied
- 34167.5%Renter occupied
Language usage in Westerly
- English speakers - Total
- 92.6% of residents of Westerly speak English at home.
- 2.6% of residents speak Spanish at home
- 16335.1%Speak English very well
- 30164.9%Speak English less than very well
- 4.4% of residents speak other language at home
- 41152.2%Speak English very well
- 37647.8%Speak English less than very well
- English speakers - Born in the United States
- 97.1% of residents of Westerly speak English at home.
- 0.7% of residents speak Spanish at home
- 49100.0%Speak English very well
- 2.1% of residents speak other language at home
- 11876.6%Speak English very well
- 3623.4%Speak English less than very well
- English speakers - Native, born elsewhere
- 85.5% of residents of Westerly speak English at home.
- 128.9% of residents speak Spanish at home
- 98100.0%Speak English less than very well
- English speakers - Foreign-born
- 26.2% of residents of Westerly speak English at home.
- 44.3% of residents speak Spanish at home
- 9023.4%Speak English very well
- 29576.6%Speak English less than very well
- 44.5% of residents speak other language at home
- 10226.4%Speak English very well
- 28573.6%Speak English less than very well
White (Caucasian) - Speak only English
| Native: | 98.2% (14,998) |
| Foreign-born: | 70.3% (194) |
White (Caucasian) - Speak another language
| Native: | 1.8% (275) |
| Foreign-born: | 59.4% (164) |
Asian - Speak only English
| Native: | 27.7% (60) |
| Foreign-born: | 7.6% (23) |
Asian - Speak another language
| Native: | 83.2% (180) |
| Foreign-born: | 98.7% (296) |
Other race - Speak only English
| Native: | 50.0% (42) |
| Foreign-born: | 5.8% (23) |
Other race - Speak another language
| Native: | 52.4% (45) |
| Foreign-born: | 93.8% (382) |
White alone - Speak only English
| Native: | 98.5% (15,043) |
| Foreign-born: | 75.2% (186) |
White alone - Speak another language
| Native: | 1.5% (233) |
| Foreign-born: | 27.6% (68) |
Hispanic or Latino - Speak only English
| Native: | 48.0% (191) |
| Foreign-born: | 10.0% (31) |
Hispanic or Latino - Speak another language
| Native: | 56.3% (224) |
| Foreign-born: | 63.5% (196) |
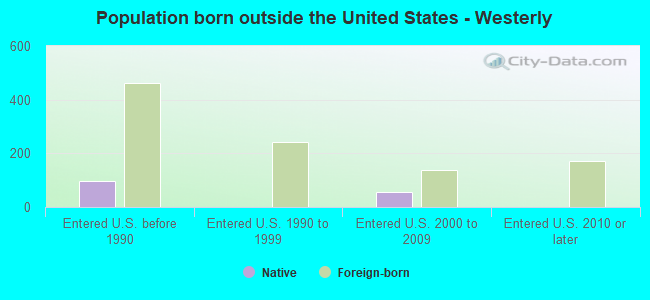
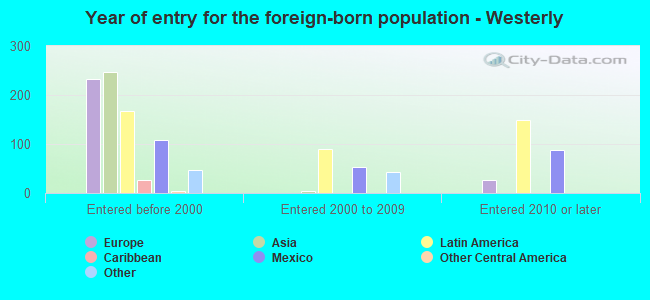
Foreign-born residents in Westerly
1,102 residents are foreign born (2.2% Latin America, 1.7% Europe, 1.5% Asia).
| This city: | 6.0% |
| Rhode Island: | 14.4% |

Marital status for residents in Westerly
Marital status - White (Caucasian) population 15 years and over
- Males
- 37.7%Never married
- 48.5%Now married
- 0.4%Separated
- 3.2%Widowed
- 10.2%Divorced
- Females
- 22.7%Never married
- 48.5%Now married
- 1.9%Separated
- 12.4%Widowed
- 14.5%Divorced
Women who gave birth in the past 12 months
| Now married: | 100.0% (48) |
| Unmarried: | 0.0% (0) |
Women who did not give birth in the past 12 months
| Now married: | 39.7% (1,048) |
| Unmarried: | 60.3% (1,594) |
Marital status - Black or African American population 15 years and over
- Males
- 51.7%Never married
- 48.3%Now married
- 0.0%Separated
- 0.0%Widowed
- 0.0%Divorced
- Females
- 33.7%Never married
- 29.1%Now married
- 0.0%Separated
- 37.2%Widowed
- 0.0%Divorced
Women who did not give birth in the past 12 months
| Now married: | 46.3% (24) |
| Unmarried: | 53.7% (28) |
Marital status - American Indian / Alaska Native population 15 years and over
- Males
- 100.0%Never married
- 0.0%Now married
- 0.0%Separated
- 0.0%Widowed
- 0.0%Divorced
- Females
- 0.0%Never married
- 0.0%Now married
- 0.0%Separated
- 0.0%Widowed
- 100.0%Divorced
Marital status - Asian population 15 years and over
- Males
- 37.5%Never married
- 61.3%Now married
- 0.0%Separated
- 0.0%Widowed
- 1.1%Divorced
- Females
- 43.0%Never married
- 57.0%Now married
- 0.0%Separated
- 0.0%Widowed
- 0.0%Divorced
Women who did not give birth in the past 12 months
| Now married: | 7.2% (7) |
| Unmarried: | 92.8% (86) |
Marital status - Other race population 15 years and over
- Males
- 35.8%Never married
- 53.7%Now married
- 0.0%Separated
- 10.4%Widowed
- 0.0%Divorced
- Females
- 30.6%Never married
- 59.9%Now married
- 9.5%Separated
- 0.0%Widowed
- 0.0%Divorced
Women who did not give birth in the past 12 months
| Now married: | 66.2% (100) |
| Unmarried: | 33.8% (51) |
Marital status - Two or more races population 15 years and over
- Males
- 51.9%Never married
- 44.9%Now married
- 0.0%Separated
- 0.0%Widowed
- 3.2%Divorced
- Females
- 39.6%Never married
- 31.9%Now married
- 0.0%Separated
- 11.4%Widowed
- 17.1%Divorced
Women who did not give birth in the past 12 months
| Now married: | 9.3% (19) |
| Unmarried: | 90.7% (183) |
Marital status - White alone, not Hispanic / Latino population 15 years and over
- Males
- 37.5%Never married
- 48.6%Now married
- 0.4%Separated
- 3.3%Widowed
- 10.3%Divorced
- Females
- 21.6%Never married
- 49.0%Now married
- 2.0%Separated
- 12.7%Widowed
- 14.7%Divorced
Women who gave birth in the past 12 months
| Now married: | 100.0% (49) |
| Unmarried: | 0.0% (0) |
Women who did not give birth in the past 12 months
| Now married: | 41.2% (1,072) |
| Unmarried: | 58.8% (1,532) |
Marital status - Hispanic or Latino population 15 years and over
- Males
- 42.7%Never married
- 49.3%Now married
- 0.0%Separated
- 8.1%Widowed
- 0.0%Divorced
- Females
- 47.8%Never married
- 29.7%Now married
- 0.0%Separated
- 11.0%Widowed
- 11.5%Divorced
Women who did not give birth in the past 12 months
| Now married: | 33.8% (91) |
| Unmarried: | 66.2% (177) |
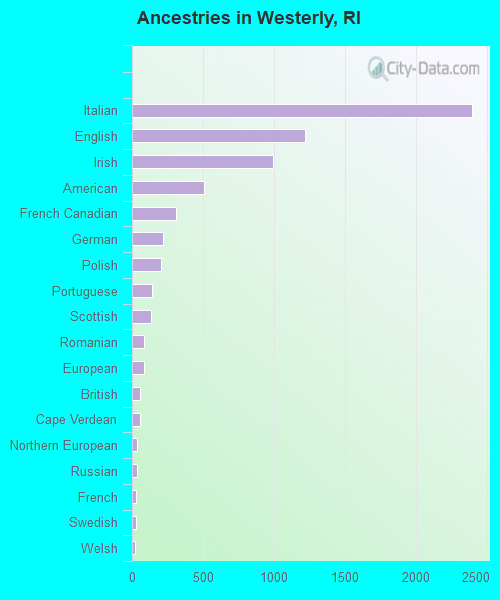
Ancestries in Westerly

- 2,39531.1%Italian
- 1,21815.8%English
- 99012.9%Irish
- 5076.6%American
- 3134.1%French Canadian
- 2162.8%German
- 2072.7%Polish
- 1391.8%Portuguese
- 1361.8%Scottish
- 841.1%Romanian
- 821.1%European
- 560.7%British
- 560.7%Cape Verdean
- 340.4%Northern European
- 340.4%Russian
- 310.4%French
- 280.4%Swedish
- 220.3%Welsh
- 210.3%Czech
- 150.2%Armenian
- 140.2%Ukrainian
- 130.2%Eastern European
- 120.2%Greek
- 120.2%Norwegian
- 110.1%Egyptian
- 80.1%Lebanese
- 70.09%Iranian
- 70.09%Scotch-Irish
- 60.08%Czechoslovakian
- 60.08%Danish
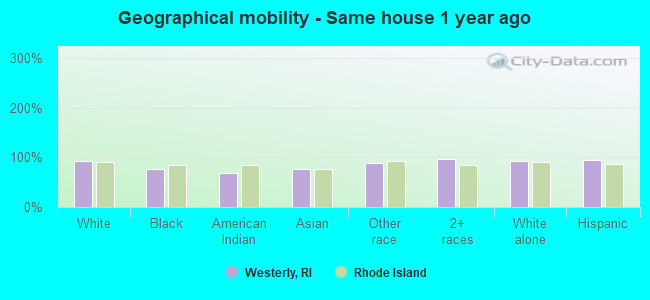
Geographical mobility in Westerly

- Same house 1 year ago
- 15,00993.4%White (Caucasian)
- 13776.2%Black or African American
- 3468.7%American Indian / Alaska Native
- 34175.9%Asian
- 53688.6%Other race
- 86596.1%Two or more races
- 14,93193.1%White alone, not Hispanic / Latino
- 81994.6%Hispanic or Latino
-
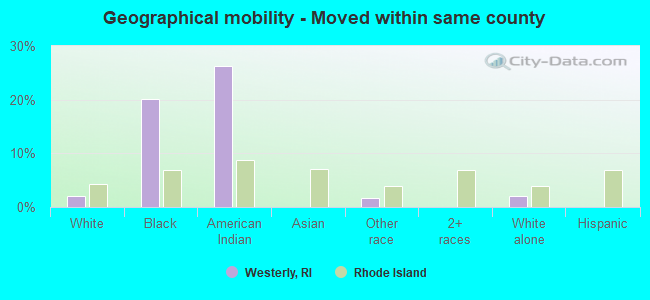
- Moved within same county
- 3262.0%White / Caucasian
- 3620.1%Black or African American
- 1326.3%American Indian / Alaska Native
- 101.7%Other race
- 3292.1%White alone, not Hispanic / Latino
-
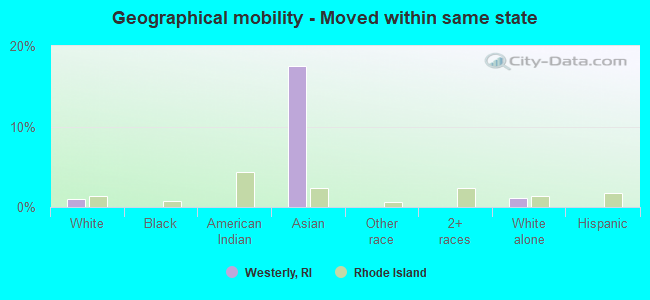
- Moved within same state
- 1691.1%White / Caucasian
- 7817.5%Asian
- 1821.1%White alone, not Hispanic / Latino
-
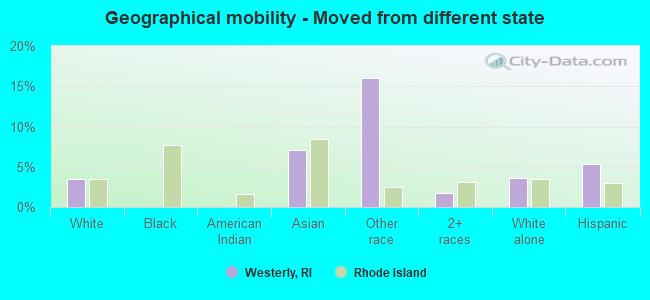
- Moved from different state
- 5543.4%White / Caucasian
- 327.1%Asian
- 9716.0%Other race
- 161.8%Two or more races
- 5753.6%White alone, not Hispanic / Latino
- 465.3%Hispanic or Latino
-
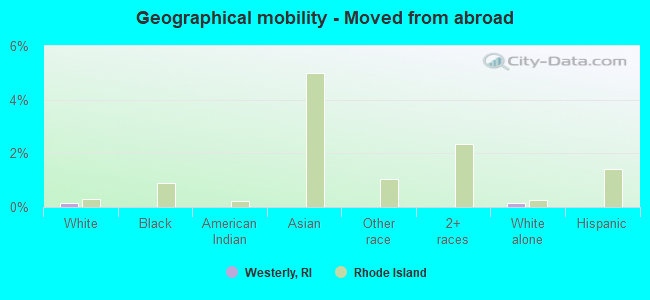
- Moved from abroad
- 220.1%White
- 220.1%White alone, not Hispanic / Latino
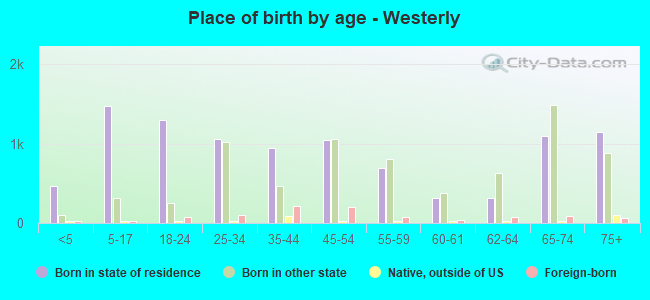
Children Nativity (place of birth) in Westerly
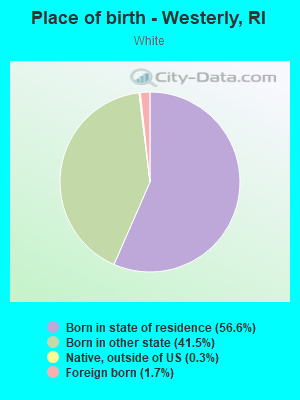
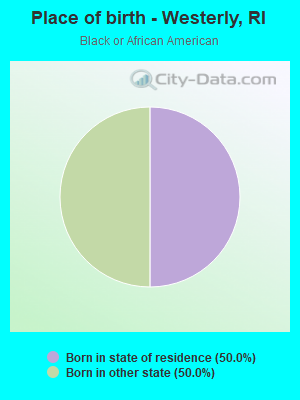
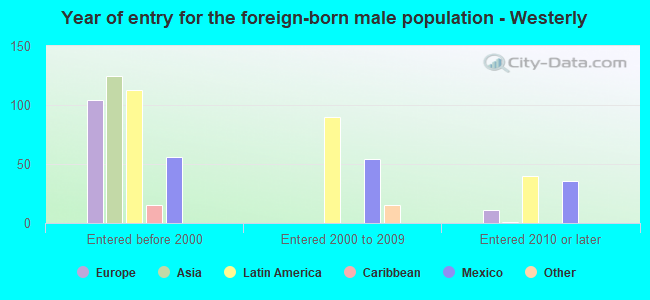
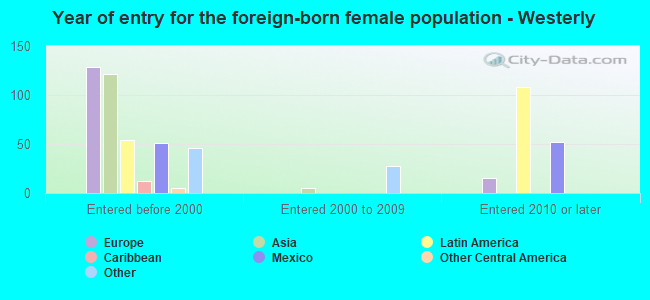
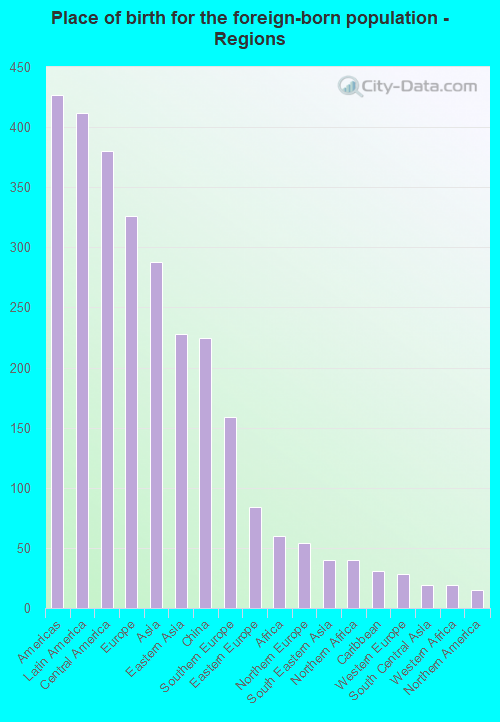
Place of birth for residents in Westerly
![Place of birth for the foreign-born population - Regions]()
- 427Americas
- 412Latin America
- 380Central America
- 326Europe
- 288Asia
- 228Eastern Asia
- 225China
- 159Southern Europe
- 84Eastern Europe
- 60Africa
- 54Northern Europe
- 40South Eastern Asia
- 40Northern Africa
- 31Caribbean
- 28Western Europe
- 19South Central Asia
- 19Western Africa
- 15Northern America
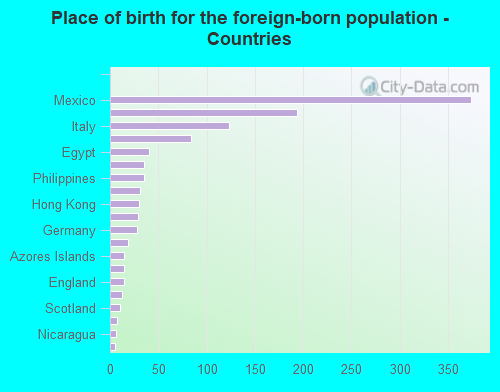
![Place of birth for the foreign-born population - Countries]()
- 374Mexico
- 194China
- 123Italy
- 84Romania
- 40Egypt
- 35Portugal
- 35Philippines
- 31Cuba
- 30Hong Kong
- 29United Kingdom
- 28Germany
- 19Cabo Verde
- 15Azores Islands
- 15Canada
- 14England
- 12Pakistan
- 10Scotland
- 7Iran
- 6Nicaragua
- 5Thailand
- 3Korea
Grandparents responsible for own grandchildren in Westerly
Zip codes: 02891.