Races in Wishkah, Washington (WA) Detailed Stats
Ancestries, Foreign-born residents, place of birth
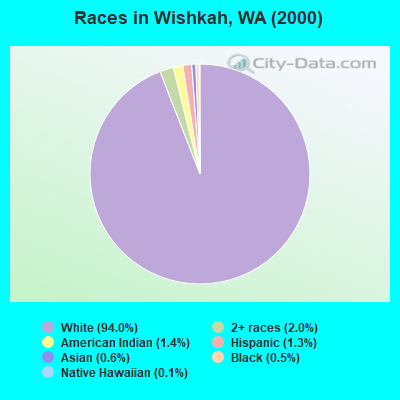
Race distribution in Wishkah

- 1,40094.0%White alone
- 302.0%Two or more races
- 211.4%American Indian alone
- 191.3%Hispanic
- 90.6%Asian alone
- 80.5%Black alone
- 20.1%Native Hawaiian and Other
Pacific Islander alone
2000
2022
-
- 4,652,49078.9%White alone
- 441,5097.5%Hispanic
- 319,4015.4%Asian alone
- 184,6313.1%Black alone
- 175,9263.0%Two or more races
- 85,3961.4%American Indian alone
- 22,7790.4%Native Hawaiian and Other
Pacific Islander alone - 11,9890.2%Other race alone

-
- 4,941,45663.5%White alone
- 1,093,31314.0%Hispanic
- 755,8329.7%Asian alone
- 523,4486.7%Two or more races
- 299,5373.8%Black alone
- 69,0240.9%American Indian alone
- 52,2310.7%Native Hawaiian and Other
Pacific Islander alone - 50,9450.7%Other race alone

Income and house value in Wishkah
- Median household income in 2022
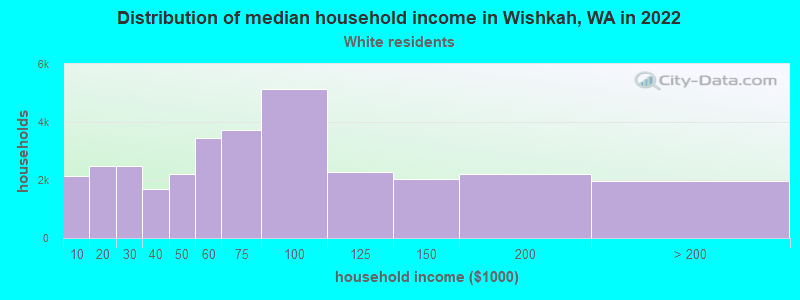
- $77,531White non-Hispanic householders
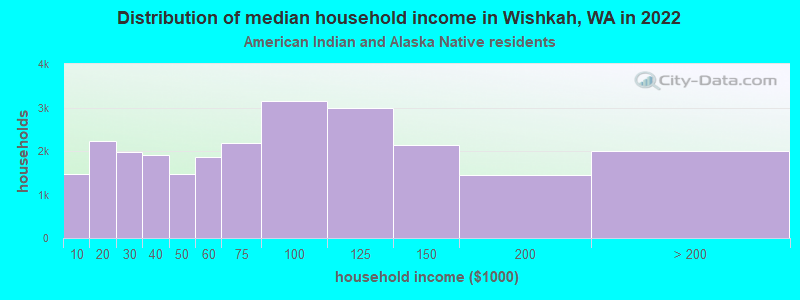
- $94,286American Indian and Alaska Native householders
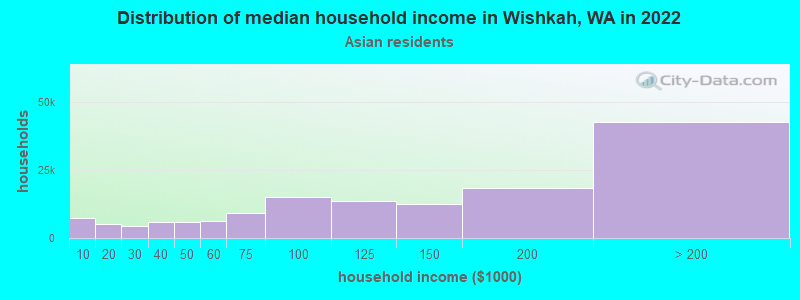
- $98,880Asian householders
- $56,990Some other race householders
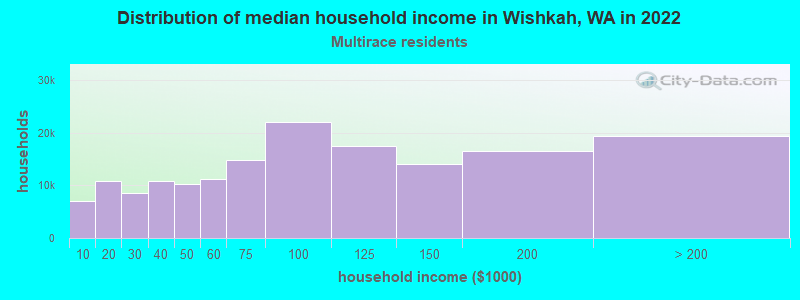
- $77,328Two or more races householders
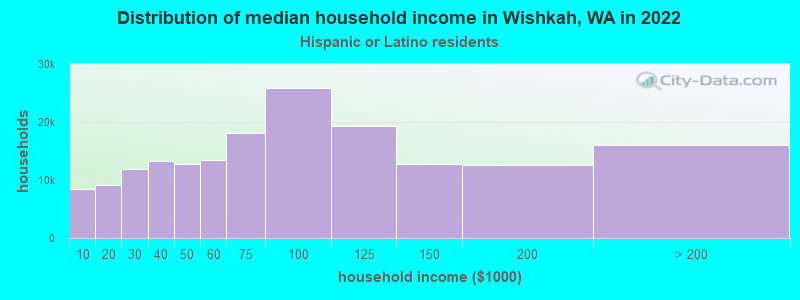
- $74,926Hispanic or Latino race householders
- Median 2022 house value
- $384,510White Non-Hispanic householders
- $279,702American Indian or Alaska Native householders
- $482,245Asian householders
- $273,272Two or more races householders
Household income for White non-Hispanic householders
Household income for American Indian and Alaska Native householders
Household income for Asian householders
Household income for Two or more races householders
Household income for Hispanic or Latino race householders
Zip code: 98520