Michigan
Public finance
The state constitution requires the governor to submit a budget proposal to the legislature each year. This executive budget, prepared by the Department of Management and Budget, is reviewed, revised, and passed by the legislature. During the fiscal year, which extends from 1 October to 30 September, if actual revenues drop below anticipated levels, the governor, in consultation with the legislative appropriations committees, must reduce expenditures to meet the constitutional requirement that the state budget be kept in balance.
In 1977, the legislature created a budget stabilization fund; a portion of tax revenues collected in good times is held in reserve to be used during periods of recession, when the funding of essential state services is threatened. In 1978, a tax limitation amendment put a lid on government spending by establishing a fixed ratio of state revenues to personal income in the state. Further efforts to limit taxes were rejected by the voters in 1980 and 1984.
Tax cuts have taken place every year during the 1990s. Michigan's 2001 fiscal budget recommendation included a personal income tax reduction from 4.4% to 4.2% in 2000. Total revenues were forecast at $37 billion, of which 25% was to come from federal aid, 21% from income tax, 21% from sales and use taxes, and the remainder from other sources. General fund revenues were forecast at $9.6 billion, but the actual amount was only $8.702 billion, a $637 million shortfall. To cover the budget gap, the legislature among other steps made withdrawals from the state's $1 billion rainy day fund. In 2001/02, general fund revenues fell further, to $8.702 billion, and in 2002/03, to $8.299 billion. In 2002/03, Michigan's state budget deficit was estimated at about 6.5% of the state budget, and was projected to reach 19.6% of the state budget in 2003/04. Allocations from the general fund are distributed, by function, to education (about 38%), community health (23%), family independence agency (9.6%), transportation (8%), and general government (7%).
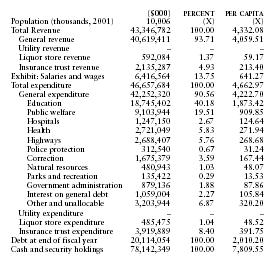
The following table from the US Census Bureau contains information on revenues, expenditures, indebtedness, and cash/securities for 2001.
| ($000) | PERCENT | PER CAPITA | |
| Population (thousands, 2001) | 10,006 | (X) | (X) |
| Total Revenue | 43,346,782 | 100.00 | 4,332.08 |
| General revenue | 40,619,411 | 93.71 | 4,059.51 |
| Utility revenue | – | – | – |
| Liquor store revenue | 592,084 | 1.37 | 59.17 |
| Insurance trust revenue | 2,135,287 | 4.93 | 213.40 |
| Exhibit: Salaries and wages | 6,416,564 | 13.75 | 641.27 |
| Total expenditure | 46,657,684 | 100.00 | 4,662.97 |
| General expenditure | 42,252,320 | 90.56 | 4,222.70 |
| Education | 18,745,402 | 40.18 | 1,873.42 |
| Public welfare | 9,103,944 | 19.51 | 909.85 |
| Hospitals | 1,247,150 | 2.67 | 124.64 |
| Health | 2,721,049 | 5.83 | 271.94 |
| Highways | 2,688,407 | 5.76 | 268.68 |
| Police protection | 312,540 | 0.67 | 31.24 |
| Correction | 1,675,379 | 3.59 | 167.44 |
| Natural resources | 480,943 | 1.03 | 48.07 |
| Parks and recreation | 135,422 | 0.29 | 13.53 |
| Government administration | 879,136 | 1.88 | 87.86 |
| Interest on general debt | 1,059,004 | 2.27 | 105.84 |
| Other and unallocable | 3,203,944 | 6.87 | 320.20 |
| Utility expenditure | – | – | – |
| Liquor store expenditure | 485,475 | 1.04 | 48.52 |
| Insurance trust expenditure | 3,919,889 | 8.40 | 391.75 |
| Debt at end of fiscal year | 20,114,054 | 100.00 | 2,010.20 |
| Cash and security holdings | 78,142,349 | 100.00 | 7,809.55 |