Latest news about work in Belcourt, ND collected exclusively by city-data.com from local newspapers, TV, and radio stations
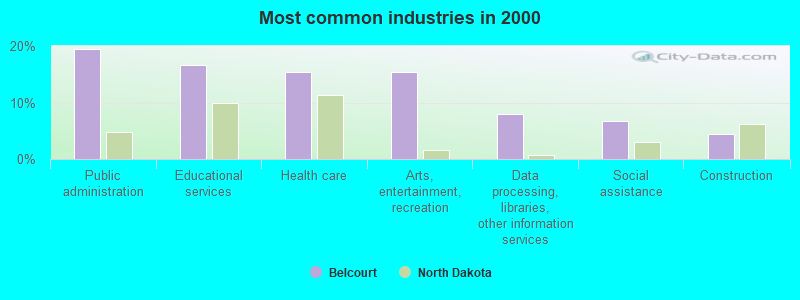
The most common industries in Belcourt are: Public administration (19.5% of civilian employees), Educational services (16.6% of civilian employees), Health care (15.4% of civilian employees). 91.8% of workers work in Rolette County and 0.5% of all workers work at home. 23.8% of workers are employees of private companies, which is 155.9% less than the rate of 60.9% across the entire state of North Dakota.
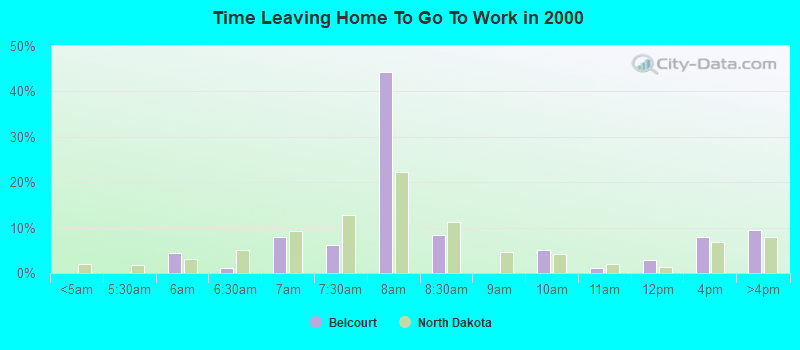
Whole page based on the data from 2000 / 2022 when the population of Belcourt, North Dakota was 2,440 / 1,777
Most common industries
Most common industries
Industry
All
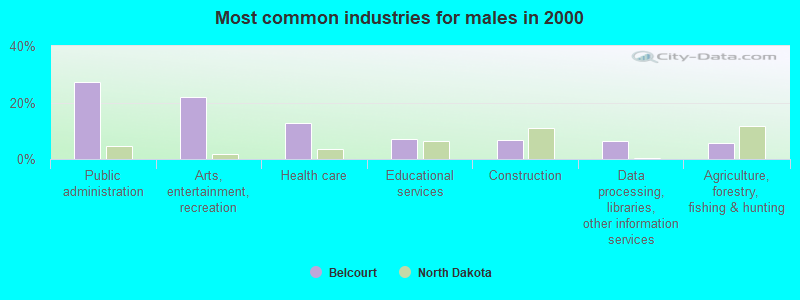
Males
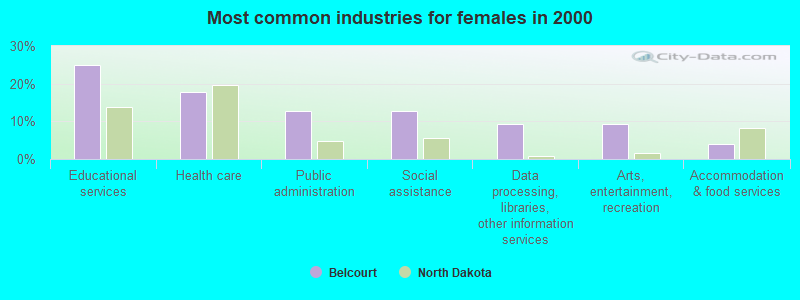
Females
Public administration
19.5% (114)
27.2% (75)
12.6% (39)
Educational services
16.6% (97)
7.2% (20)
24.9% (77)
Health care
15.4% (90)
12.7% (35)
17.8% (55)
Arts, entertainment, and recreation
15.4% (90)
22.1% (61)
9.4% (29)
Data processing, libraries, and other information services
8.0% (47)
6.5% (18)
9.4% (29)
Social assistance
6.7% (39)
0.0% (0)
12.6% (39)
Construction
4.4% (26)
6.9% (19)
2.3% (7)
Accommodation and food services
3.1% (18)
2.2% (6)
3.9% (12)
Agriculture, forestry, fishing and hunting
2.7% (16)
5.8% (16)
0.0% (0)
Publishing, and motion picture and sound recording industries
1.9% (11)
0.0% (0)
3.6% (11)
Food and beverage stores
1.4% (8)
2.9% (8)
0.0% (0)
Real estate and rental and leasing
1.2% (7)
0.0% (0)
2.3% (7)
Administrative and support and waste management services
1.2% (7)
2.5% (7)
0.0% (0)
Computer and electronic products
1.0% (6)
2.2% (6)
0.0% (0)
Personal and laundry services
0.9% (5)
1.8% (5)
0.0% (0)
Religious, grantmaking, civic, professional, and similar organizations
0.7% (4)
0.0% (0)
1.3% (4)
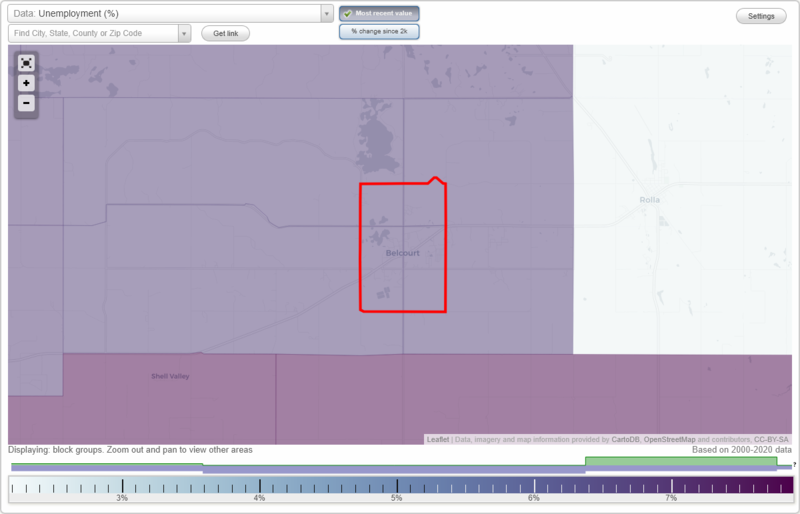
Unemployment in Belcourt
Unemployment by race in 2022
Unemployment rate for American Indian and Alaska Native residents
1.6%Males
9.6%Females
Unemployment rate for two or more race residents
42.7%Females
Unemployment by race in 2000
Unemployment rate for American Indian and Alaska Native residents
23.3%Males
21.1%Females
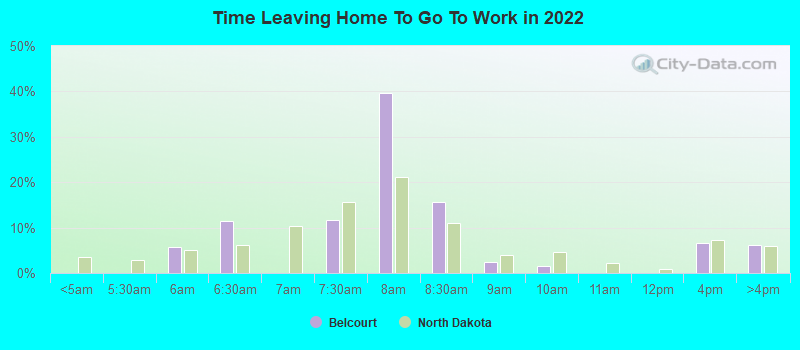
Time leaving home to go to work
5:30 a.m. to 5:59 a.m.:
Belcourt:
5.8% (36)
North Dakota:
5.0% (18,935)
6:00 a.m. to 6:29 a.m.:
Belcourt:
11.4% (70)
North Dakota:
6.1% (23,161)
7:00 a.m. to 7:29 a.m.:
Belcourt:
11.6% (72)
North Dakota:
15.5% (58,816)
7:30 a.m. to 7:59 a.m.:
Belcourt:
39.8% (246)
North Dakota:
21.1% (79,708)
8:00 a.m. to 8:29 a.m.:
Belcourt:
15.5% (96)
North Dakota:
11.0% (41,627)
8:30 a.m. to 8:59 a.m.:
Belcourt:
2.5% (15)
North Dakota:
3.9% (14,876)
9:00 a.m. to 9:59 a.m.:
Belcourt:
1.5% (9)
North Dakota:
4.6% (17,538)
12:00 p.m. to 3:59 p.m.:
Belcourt:
6.6% (41)
North Dakota:
7.2% (27,135)
4:00 p.m. to 11:59 p.m.:
Belcourt:
6.1% (38)
North Dakota:
5.9% (22,410)
6am:
Belcourt:
4.4% (26)
North Dakota:
3.1% (10,018)
6:30am:
Belcourt:
1.2% (7)
North Dakota:
5.0% (16,041)
7am:
Belcourt:
8.0% (47)
North Dakota:
9.3% (29,792)
7:30am:
Belcourt:
6.2% (36)
North Dakota:
12.9% (41,122)
8am:
Belcourt:
44.3% (259)
North Dakota:
22.3% (71,367)
8:30am:
Belcourt:
8.4% (49)
North Dakota:
11.2% (35,640)
10am:
Belcourt:
5.1% (30)
North Dakota:
4.1% (13,042)
11am:
Belcourt:
1.2% (7)
North Dakota:
2.0% (6,297)
12pm:
Belcourt:
2.9% (17)
North Dakota:
1.2% (3,924)
4pm:
Belcourt:
7.9% (46)
North Dakota:
6.7% (21,553)
>4pm:
Belcourt:
9.4% (55)
North Dakota:
7.8% (24,981)
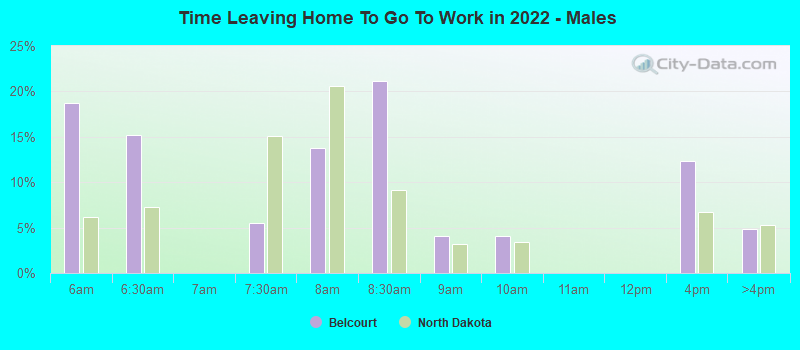
5:30 a.m. to 5:59 a.m. - Males:
Belcourt:
18.7% (37)
North Dakota:
6.2% (12,896)
6:00 a.m. to 6:29 a.m. - Males:
Belcourt:
15.2% (30)
North Dakota:
7.3% (15,114)
7:00 a.m. to 7:29 a.m. - Males:
Belcourt:
5.5% (11)
North Dakota:
15.1% (31,484)
7:30 a.m. to 7:59 a.m. - Males:
Belcourt:
13.8% (27)
North Dakota:
20.6% (42,894)
8:00 a.m. to 8:29 a.m. - Males:
Belcourt:
21.1% (42)
North Dakota:
9.1% (18,980)
8:30 a.m. to 8:59 a.m. - Males:
Belcourt:
4.0% (8)
North Dakota:
3.2% (6,661)
9:00 a.m. to 9:59 a.m. - Males:
Belcourt:
4.0% (8)
North Dakota:
3.4% (7,023)
12:00 p.m. to 3:59 p.m. - Males:
Belcourt:
12.4% (25)
North Dakota:
6.7% (13,967)
4:00 p.m. to 11:59 p.m. - Males:
Belcourt:
4.8% (10)
North Dakota:
5.3% (11,113)
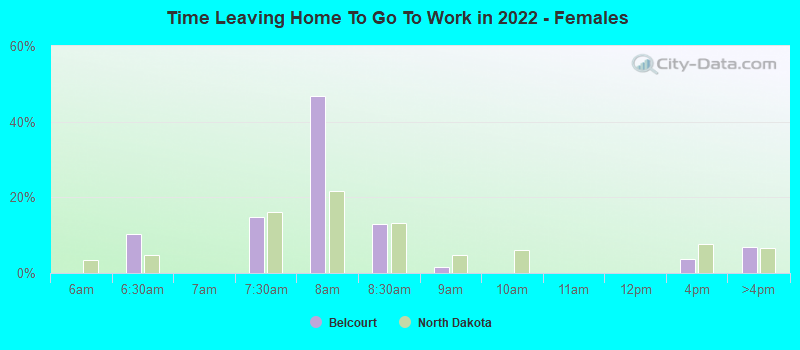
6:00 a.m. to 6:29 a.m. - Females:
Belcourt:
10.3% (43)
North Dakota:
4.7% (8,047)
7:00 a.m. to 7:29 a.m. - Females:
Belcourt:
14.9% (63)
North Dakota:
16.0% (27,332)
7:30 a.m. to 7:59 a.m. - Females:
Belcourt:
46.9% (197)
North Dakota:
21.6% (36,814)
8:00 a.m. to 8:29 a.m. - Females:
Belcourt:
13.0% (55)
North Dakota:
13.3% (22,647)
8:30 a.m. to 8:59 a.m. - Females:
Belcourt:
1.7% (7)
North Dakota:
4.8% (8,215)
12:00 p.m. to 3:59 p.m. - Females:
Belcourt:
3.8% (16)
North Dakota:
7.7% (13,168)
4:00 p.m. to 11:59 p.m. - Females:
Belcourt:
6.9% (29)
North Dakota:
6.6% (11,297)
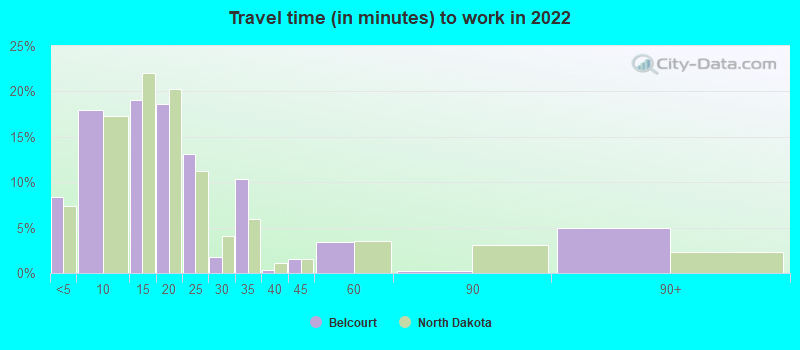
Travel time to work
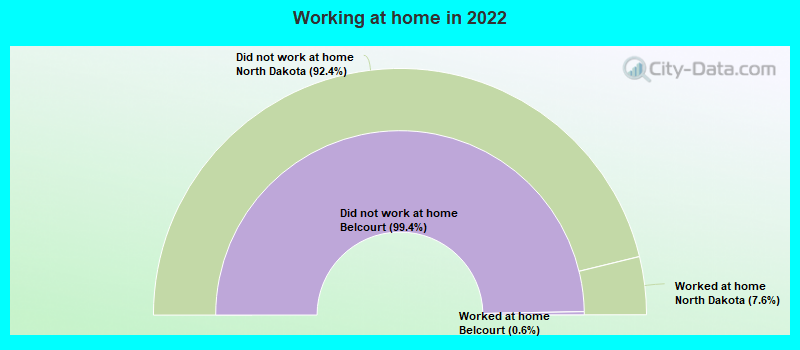
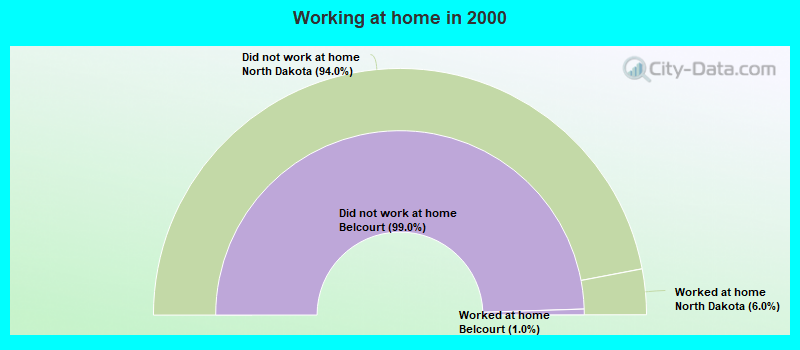
Percentage of workers working in this county: 91.8% Number of people working at home: 3 (0.5% of all workers)
Less than 5 minutes:
Belcourt:
8.4% (134)
North Dakota:
7.4% (30,068)
5 to 9 minutes:
Belcourt:
17.9% (287)
North Dakota:
17.3% (70,395)
10 to 14 minutes:
Belcourt:
19.0% (306)
North Dakota:
22.0% (89,522)
15 to 19 minutes:
Belcourt:
18.6% (299)
North Dakota:
20.2% (82,203)
20 to 24 minutes:
Belcourt:
13.1% (210)
North Dakota:
11.3% (45,742)
25 to 29 minutes:
Belcourt:
1.8% (29)
North Dakota:
4.1% (16,642)
30 to 34 minutes:
Belcourt:
10.3% (166)
North Dakota:
6.0% (24,163)
35 to 39 minutes:
Belcourt:
0.4% (6)
North Dakota:
1.1% (4,469)
40 to 44 minutes:
Belcourt:
1.5% (25)
North Dakota:
1.6% (6,374)
45 to 59 minutes:
Belcourt:
3.5% (56)
North Dakota:
3.6% (14,505)
60 to 89 minutes:
Belcourt:
0.2% (3)
North Dakota:
3.1% (12,696)
90 or more minutes:
Belcourt:
4.9% (79)
North Dakota:
2.3% (9,225)
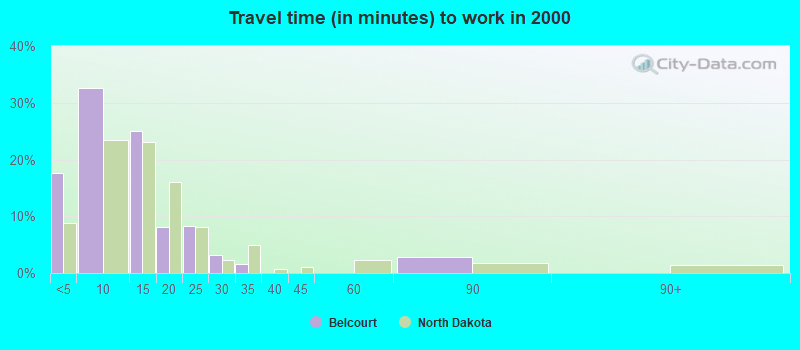
Less than 5 minutes:
Belcourt:
17.6% (103)
North Dakota:
8.8% (28,174)
5 to 9 minutes:
Belcourt:
32.6% (191)
North Dakota:
23.4% (74,872)
10 to 14 minutes:
Belcourt:
25.0% (146)
North Dakota:
23.1% (73,827)
15 to 19 minutes:
Belcourt:
8.0% (47)
North Dakota:
16.0% (51,229)
20 to 24 minutes:
Belcourt:
8.2% (48)
North Dakota:
8.2% (26,094)
25 to 29 minutes:
Belcourt:
3.2% (19)
North Dakota:
2.4% (7,579)
30 to 34 minutes:
Belcourt:
1.5% (9)
North Dakota:
4.9% (15,622)
60 to 89 minutes:
Belcourt:
2.7% (16)
North Dakota:
1.8% (5,644)
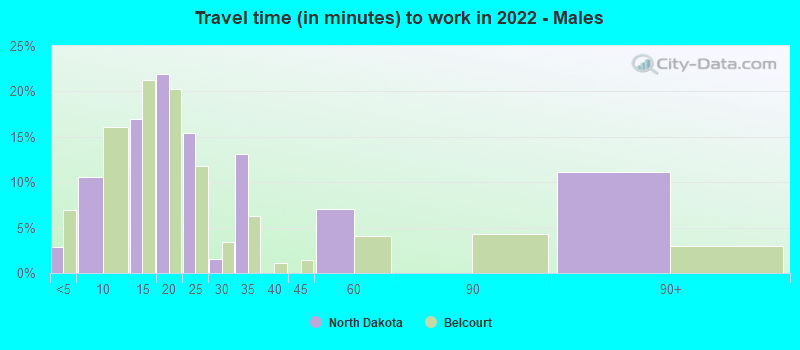
Less than 5 minutes - Males:
Belcourt:
2.8% (15)
North Dakota:
6.9% (15,680)
5 to 9 minutes - Males:
Belcourt:
10.6% (56)
North Dakota:
16.1% (36,392)
10 to 14 minutes - Males:
Belcourt:
17.0% (90)
North Dakota:
21.3% (48,104)
15 to 19 minutes - Males:
Belcourt:
21.9% (116)
North Dakota:
20.3% (45,793)
20 to 24 minutes - Males:
Belcourt:
15.5% (82)
North Dakota:
11.7% (26,510)
25 to 29 minutes - Males:
Belcourt:
1.5% (8)
North Dakota:
3.4% (7,750)
30 to 34 minutes - Males:
Belcourt:
13.1% (69)
North Dakota:
6.3% (14,194)
45 to 59 minutes - Males:
Belcourt:
7.0% (37)
North Dakota:
4.1% (9,174)
90 or more minutes - Males:
Belcourt:
11.1% (59)
North Dakota:
3.0% (6,822)
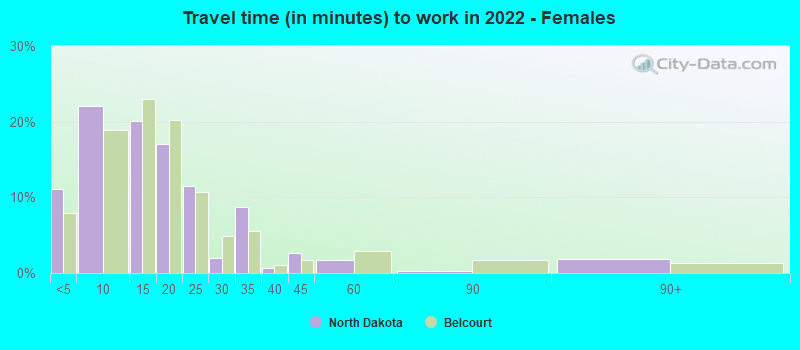
Less than 5 minutes - Females:
Belcourt:
11.0% (119)
North Dakota:
8.0% (14,388)
5 to 9 minutes - Females:
Belcourt:
22.0% (238)
North Dakota:
18.9% (34,003)
10 to 14 minutes - Females:
Belcourt:
20.0% (216)
North Dakota:
23.0% (41,418)
15 to 19 minutes - Females:
Belcourt:
17.1% (184)
North Dakota:
20.2% (36,410)
20 to 24 minutes - Females:
Belcourt:
11.6% (125)
North Dakota:
10.7% (19,232)
25 to 29 minutes - Females:
Belcourt:
2.0% (22)
North Dakota:
4.9% (8,892)
30 to 34 minutes - Females:
Belcourt:
8.7% (94)
North Dakota:
5.5% (9,969)
35 to 39 minutes - Females:
Belcourt:
0.6% (6)
North Dakota:
1.1% (2,016)
40 to 44 minutes - Females:
Belcourt:
2.6% (28)
North Dakota:
1.8% (3,173)
45 to 59 minutes - Females:
Belcourt:
1.7% (18)
North Dakota:
3.0% (5,331)
60 to 89 minutes - Females:
Belcourt:
0.2% (2)
North Dakota:
1.7% (3,050)
90 or more minutes - Females:
Belcourt:
1.9% (20)
North Dakota:
1.3% (2,403)
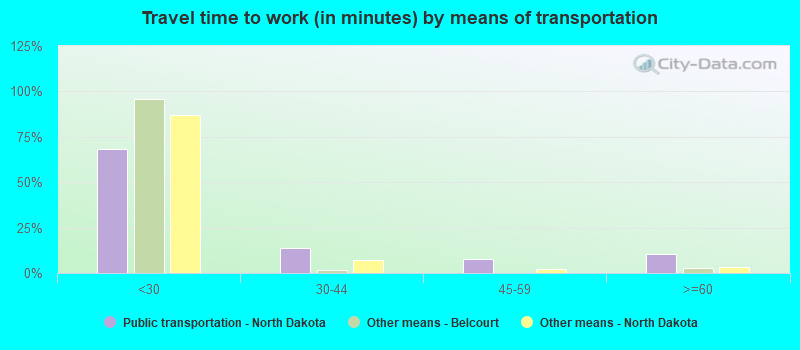
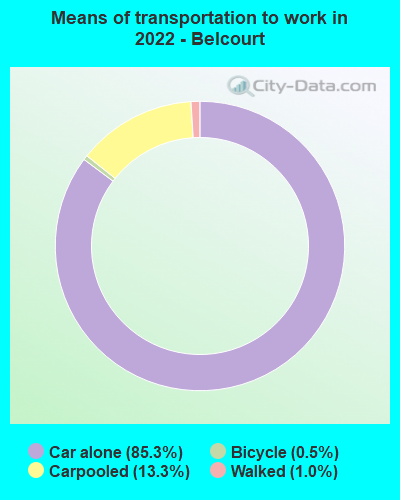
Means of transportation to work
Drove car alone:
Belcourt:
85.3% (1,387)
North Dakota:
85.1% (152,740)
Carpooled:
Belcourt:
13.3% (216)
North Dakota:
9.5% (18,171)
Bicycle:
Belcourt:
0.5% (8)
North Dakota:
0.3% (401)
Walked:
Belcourt:
1.0% (16)
North Dakota:
3.5% (7,049)
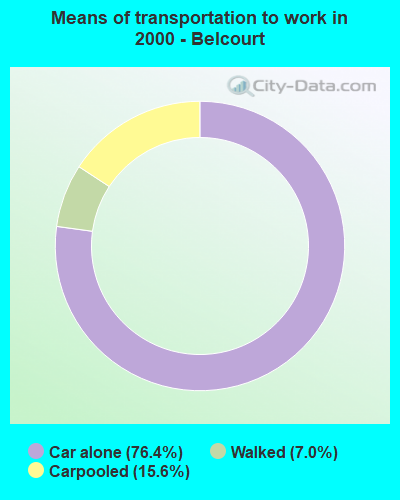
Drove car alone:
Belcourt:
76.4% (447)
North Dakota:
77.7% (248,277)
Carpooled:
Belcourt:
15.6% (91)
North Dakota:
10.0% (32,005)
Walked:
Belcourt:
7.0% (41)
North Dakota:
5.0% (16,094)
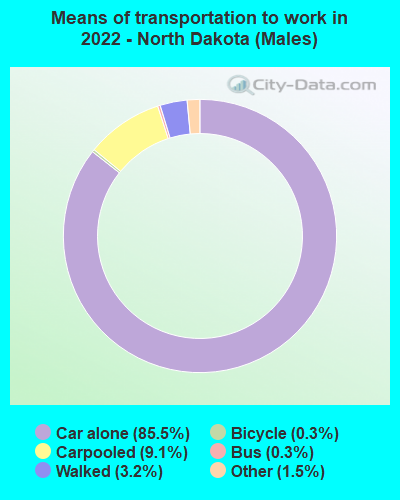
Drove car alone - Males:
Belcourt:
84.8% (453)
North Dakota:
85.5% (152,740)
Carpooled - Males:
Belcourt:
12.9% (69)
North Dakota:
9.1% (18,171)
Bicycle - Males:
Belcourt:
1.5% (8)
North Dakota:
0.3% (401)
Walked - Males:
Belcourt:
0.8% (4)
North Dakota:
3.2% (7,049)
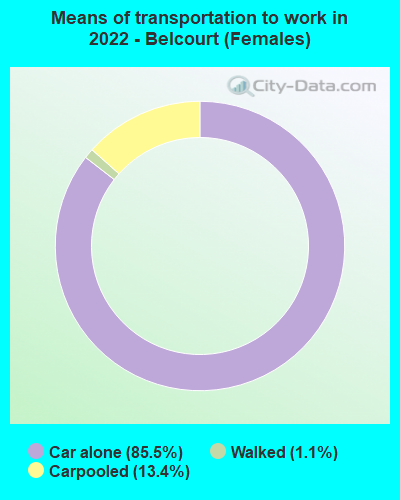
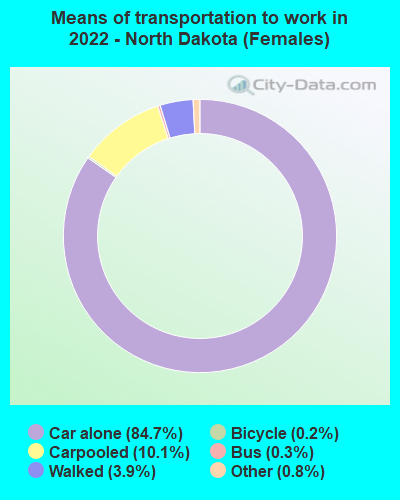
Drove car alone - Females:
Belcourt:
85.5% (941)
North Dakota:
84.7% (152,740)
Carpooled - Females:
Belcourt:
13.4% (148)
North Dakota:
10.1% (18,171)
Walked - Females:
Belcourt:
1.1% (12)
North Dakota:
3.9% (7,049)
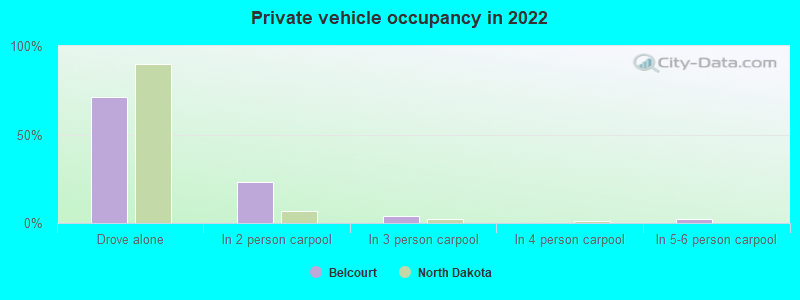
Private vehicle occupancy
Drove alone:
Belcourt:
71.0% (425)
North Dakota:
90.0% (322,810)
In 2 person carpool:
Belcourt:
23.0% (137)
North Dakota:
6.8% (24,403)
In 3 person carpool:
Belcourt:
4.0% (24)
North Dakota:
2.0% (7,140)
In 5-6 person carpool:
Belcourt:
2.0% (12)
North Dakota:
0.3% (906)
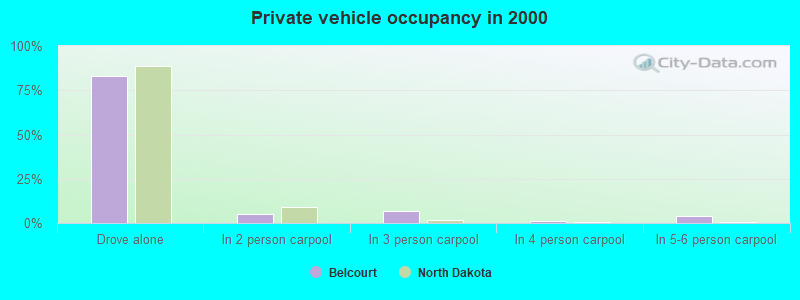
Drove alone:
Belcourt:
83.1% (447)
North Dakota:
88.6% (248,277)
In 2 person carpool:
Belcourt:
5.0% (27)
North Dakota:
8.8% (24,655)
In 3 person carpool:
Belcourt:
6.7% (36)
North Dakota:
1.6% (4,437)
In 4 person carpool:
Belcourt:
1.1% (6)
North Dakota:
0.6% (1,819)
In 5-6 person carpool:
Belcourt:
4.1% (22)
North Dakota:
0.3% (814)
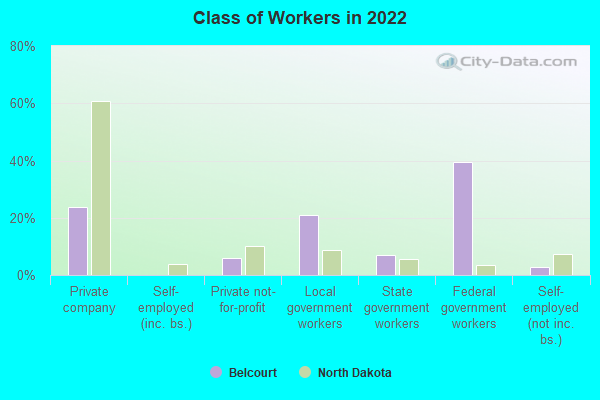
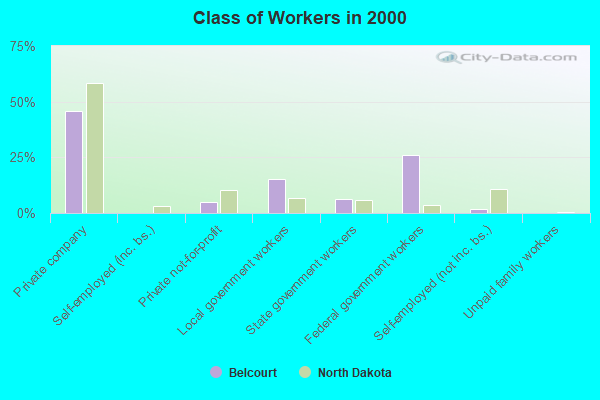
Class of workers
Employee of private company:
Belcourt:
23.8% (152)
North Dakota:
60.9% (248,963)
Private not-for-profit wage and salary workers:
Belcourt:
6.0% (38)
North Dakota:
10.2% (41,742)
Local government workers:
Belcourt:
21.0% (134)
North Dakota:
8.7% (35,547)
State government workers:
Belcourt:
7.1% (45)
North Dakota:
5.5% (22,447)
Federal government workers:
Belcourt:
39.4% (252)
North Dakota:
3.3% (13,675)
Self-employed workers in own not incorporated business:
Belcourt:
2.7% (17)
North Dakota:
7.4% (30,119)
Employee of private company:
Belcourt:
45.6% (267)
North Dakota:
58.5% (185,338)
Private not-for-profit wage and salary workers:
Belcourt:
4.8% (28)
North Dakota:
10.5% (33,309)
Local government workers:
Belcourt:
15.2% (89)
North Dakota:
7.0% (22,008)
State government workers:
Belcourt:
6.3% (37)
North Dakota:
6.0% (18,962)
Federal government workers:
Belcourt:
26.2% (153)
North Dakota:
3.5% (11,117)
Self-employed workers in own not incorporated business:
Belcourt:
1.9% (11)
North Dakota:
10.7% (33,950)
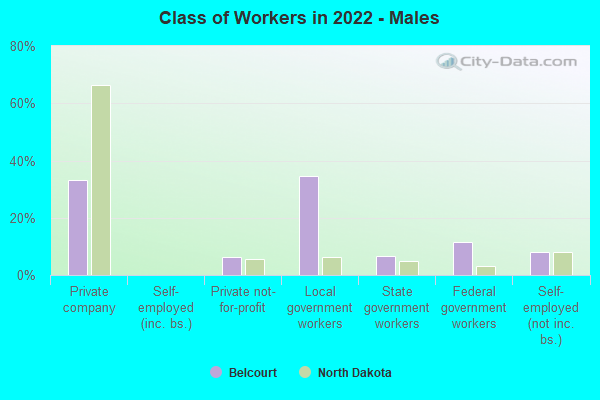
Employee of private company - Males:
Belcourt:
33.2% (71)
North Dakota:
66.5% (145,704)
Private not-for-profit wage and salary workers - Males:
Belcourt:
6.2% (13)
North Dakota:
5.7% (12,562)
Local government workers - Males:
Belcourt:
34.6% (74)
North Dakota:
6.2% (13,550)
State government workers - Males:
Belcourt:
6.6% (14)
North Dakota:
4.9% (10,641)
Federal government workers - Males:
Belcourt:
11.4% (24)
North Dakota:
3.2% (6,977)
Self-employed workers in own not incorporated business - Males:
Belcourt:
8.1% (17)
North Dakota:
8.0% (17,517)
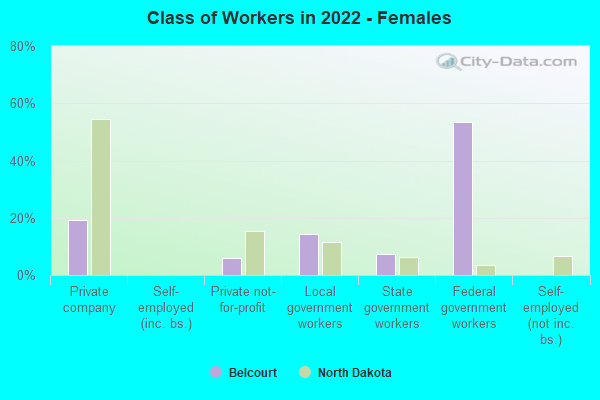
Employee of private company - Females:
Belcourt:
19.1% (82)
North Dakota:
54.5% (103,259)
Private not-for-profit wage and salary workers - Females:
Belcourt:
5.9% (25)
North Dakota:
15.4% (29,180)
Local government workers - Females:
Belcourt:
14.2% (61)
North Dakota:
11.6% (21,997)
State government workers - Females:
Belcourt:
7.3% (31)
North Dakota:
6.2% (11,806)
Federal government workers - Females:
Belcourt:
53.4% (228)
North Dakota:
3.5% (6,698)
Discuss Belcourt, North Dakota (ND) on our hugely popular North Dakota forum.