Work and Jobs in Bridgeport, Alabama (AL) Detailed Stats
Data:
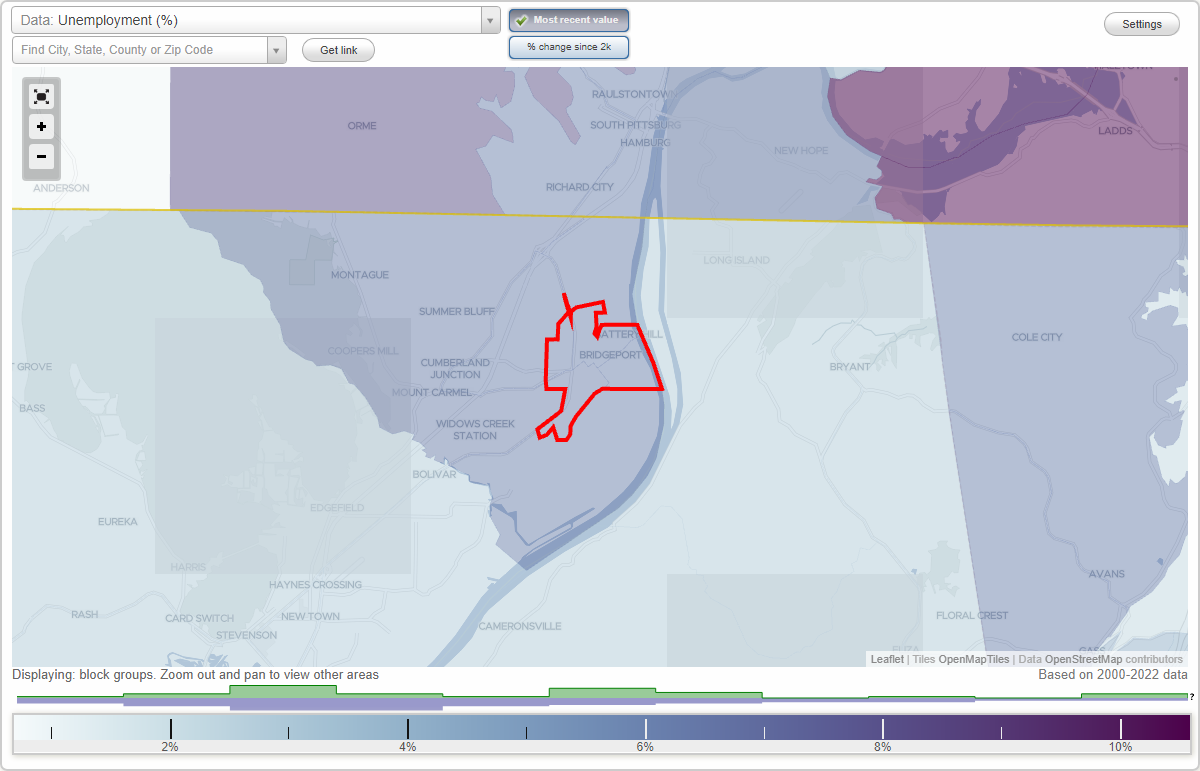
Unemployment (%)
Unemployment (% change since 2000)
Unemployment (%) - White
Unemployment (% change since 2000) - White
Unemployment (%) - Black or African American
Unemployment (% change since 2000) - Black or African American
Unemployment (%) - Asian
Unemployment (% change since 2000) - Asian
Unemployment (%) - Hispanic or Latino
Unemployment (% change since 2000) - Hispanic or Latino
Unemployment (%) - American Indian and Alaska Native
Unemployment (% change since 2000) - American Indian and Alaska Native
Unemployment (%) - Multirace
Unemployment (% change since 2000) - Multirace
Unemployment (%) - Other Race
Unemployment (% change since 2000) - Other Race
Industry diversity
Most Common Industries - Agriculture, forestry, fishing and hunting, and mining (%)
Most Common Industries - Agriculture, forestry, fishing and hunting (%)
Most Common Industries - Mining, quarrying, and oil and gas extraction (%)
Most Common Industries - Construction (%)
Most Common Industries - Manufacturing (%)
Most Common Industries - Wholesale trade (%)
Most Common Industries - Retail trade (%)
Most Common Industries - Transportation and warehousing, and utilities (%)
Most Common Industries - Transportation and warehousing (%)
Most Common Industries - Utilities (%)
Most Common Industries - Information (%)
Most Common Industries - Finance and insurance, and real estate and rental and leasing (%)
Most Common Industries - Finance and insurance (%)
Most Common Industries - Real estate and rental and leasing (%)
Most Common Industries - Professional, scientific, and management, and administrative and waste management services (%)
Most Common Industries - Professional, scientific, and technical services (%)
Most Common Industries - Management of companies and enterprises (%)
Most Common Industries - Administrative and support and waste management services (%)
Most Common Industries - Educational services, and health care and social assistance (%)
Most Common Industries - Educational services (%)
Most Common Industries - Health care and social assistance (%)
Most Common Industries - Arts, entertainment, and recreation, and accommodation and food services (%)
Most Common Industries - Arts, entertainment, and recreation (%)
Most Common Industries - Accommodation and food services (%)
Most Common Industries - Other services, except public administration (%)
Most Common Industries - Public administration (%)
Occupation diversity
Most Common Occupations - Management, business, science, and arts occupations (%)
Most Common Occupations - Management, business, and financial occupations (%)
Most Common Occupations - Management occupations (%)
Most Common Occupations - Business and financial operations occupations (%)
Most Common Occupations - Computer, engineering, and science occupations (%)
Most Common Occupations - Computer and mathematical occupations (%)
Most Common Occupations - Architecture and engineering occupations (%)
Most Common Occupations - Life, physical, and social science occupations (%)
Most Common Occupations - Education, legal, community service, arts, and media occupations (%)
Most Common Occupations - Community and social service occupations (%)
Most Common Occupations - Legal occupations (%)
Most Common Occupations - Education, training, and library occupations (%)
Most Common Occupations - Arts, design, entertainment, sports, and media occupations (%)
Most Common Occupations - Healthcare practitioners and technical occupations (%)
Most Common Occupations - Health diagnosing and treating practitioners and other technical occupations (%)
Most Common Occupations - Health technologists and technicians (%)
Most Common Occupations - Service occupations (%)
Most Common Occupations - Healthcare support occupations (%)
Most Common Occupations - Protective service occupations (%)
Most Common Occupations - Fire fighting and prevention, and other protective service workers including supervisors (%)
Most Common Occupations - Law enforcement workers including supervisors (%)
Most Common Occupations - Food preparation and serving related occupations (%)
Most Common Occupations - Building and grounds cleaning and maintenance occupations (%)
Most Common Occupations - Personal care and service occupations (%)
Most Common Occupations - Sales and office occupations (%)
Most Common Occupations - Sales and related occupations (%)
Most Common Occupations - Office and administrative support occupations (%)
Most Common Occupations - Natural resources, construction, and maintenance occupations (%)
Most Common Occupations - Farming, fishing, and forestry occupations (%)
Most Common Occupations - Construction and extraction occupations (%)
Most Common Occupations - Installation, maintenance, and repair occupations (%)
Most Common Occupations - Production, transportation, and material moving occupations (%)
Most Common Occupations - Production occupations (%)
Most Common Occupations - Transportation occupations (%)
Most Common Occupations - Material moving occupations (%)
Private vehicle occupancy - Drove alone (% change since 2000)
Private vehicle occupancy - Carpooled (%)
Private vehicle occupancy - Carpooled (% change since 2000)
Private vehicle occupancy - In 2-person carpool (%)
Private vehicle occupancy - In 2-person carpool (% change since 2000)
Private vehicle occupancy - In 3-person carpool (%)
Private vehicle occupancy - In 3-person carpool (% change since 2000)
Private vehicle occupancy - In 4-person carpool (%)
Private vehicle occupancy - In 4-person carpool (% change since 2000)
Private vehicle occupancy - In 5- or 6-person carpool (%)
Private vehicle occupancy - In 5- or 6-person carpool (% change since 2000)
Private vehicle occupancy - In 7-or-more-person carpool (%)
Private vehicle occupancy - In 7-or-more-person carpool (% change since 2000)
Time Leaving Home To Go To Work - 12:00 a.m. to 4:59 a.m. (%)
Time Leaving Home To Go To Work - 12:00 a.m. to 4:59 a.m. (% change since 2000)
Time Leaving Home To Go To Work - 5:00 a.m. to 5:59 a.m. (%)
Time Leaving Home To Go To Work - 5:00 a.m. to 5:59 a.m. (% change since 2000)
Time Leaving Home To Go To Work - 6:00 a.m. to 6:59 a.m. (%)
Time Leaving Home To Go To Work - 6:00 a.m. to 6:59 a.m. (% change since 2000)
Time Leaving Home To Go To Work - 7:00 a.m. to 7:59 a.m. (%)
Time Leaving Home To Go To Work - 7:00 a.m. to 7:59 a.m. (% change since 2000)
Time Leaving Home To Go To Work - 8:00 a.m. to 8:59 a.m. (%)
Time Leaving Home To Go To Work - 8:00 a.m. to 8:59 a.m. (% change since 2000)
Time Leaving Home To Go To Work - 9:00 a.m. to 9:59 a.m. (%)
Time Leaving Home To Go To Work - 9:00 a.m. to 9:59 a.m. (% change since 2000)
Time Leaving Home To Go To Work - 10:00 a.m. to 10:59 a.m. (%)
Time Leaving Home To Go To Work - 10:00 a.m. to 10:59 a.m. (% change since 2000)
Time Leaving Home To Go To Work - 11:00 a.m. to 11:59 a.m. (%)
Time Leaving Home To Go To Work - 11:00 a.m. to 11:59 a.m. (% change since 2000)
Time Leaving Home To Go To Work - 12:00 p.m. to 3:59 p.m. (%)
Time Leaving Home To Go To Work - 12:00 p.m. to 3:59 p.m. (% change since 2000)
Time Leaving Home To Go To Work - 4:00 p.m. to 11:59 p.m. (%)
Time Leaving Home To Go To Work - 4:00 p.m. to 11:59 p.m. (% change since 2000)
Class of Workers - Employee of private company (%)
Class of Workers - Employee of private company (% change since 2000)
Class of Workers - Self-employed in own incorporated business (%)
Class of Workers - Self-employed in own incorporated business (% change since 2000)
Class of Workers - Private not-for-profit wage and salary workers (%)
Class of Workers - Private not-for-profit wage and salary workers (% change since 2000)
Class of Workers - Local government workers (%)
Class of Workers - Local government workers (% change since 2000)
Class of Workers - State government workers (%)
Class of Workers - State government workers (% change since 2000)
Class of Workers - Federal government workers (%)
Class of Workers - Federal government workers (% change since 2000)
Class of Workers - Self-employed workers in own not incorporated business and Unpaid family workers (%)
Class of Workers - Self-employed workers in own not incorporated business and Unpaid family workers (% change since 2000)
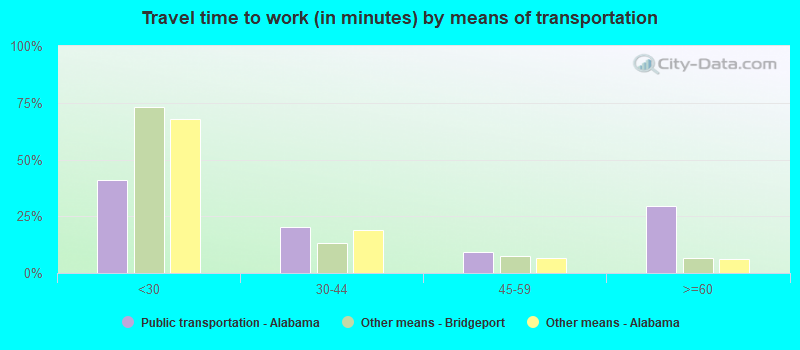
Means of transportation to work - Drove car alone (%)
Means of transportation to work - Drove car alone (% change since 2000)
Means of transportation to work - Carpooled (%)
Means of transportation to work - Carpooled (% change since 2000)
Means of transportation to work - Public transportation (%)
Means of transportation to work - Public transportation (% change since 2000)
Means of transportation to work - Bus or trolley bus (%)
Means of transportation to work - Bus or trolley bus (% change since 2000)
Means of transportation to work - Streetcar or trolley car (%)
Means of transportation to work - Streetcar or trolley car (% change since 2000)
Means of transportation to work - Subway or elevated (%)
Means of transportation to work - Subway or elevated (% change since 2000)
Means of transportation to work - Railroad (%)
Means of transportation to work - Railroad (% change since 2000)
Means of transportation to work - Ferryboat (%)
Means of transportation to work - Ferryboat (% change since 2000)
Means of transportation to work - Taxicab (%)
Means of transportation to work - Taxicab (% change since 2000)
Means of transportation to work - Motorcycle (%)
Means of transportation to work - Motorcycle (% change since 2000)
Means of transportation to work - Bicycle (%)
Means of transportation to work - Bicycle (% change since 2000)
Means of transportation to work - Walked (%)
Means of transportation to work - Walked (% change since 2000)
Means of transportation to work - Other means (%)
Means of transportation to work - Other means (% change since 2000)
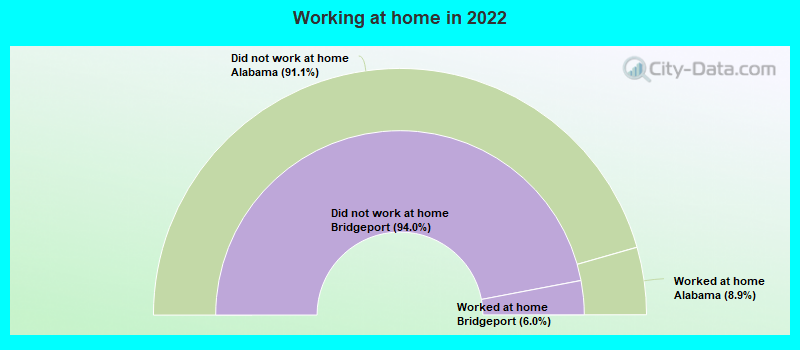
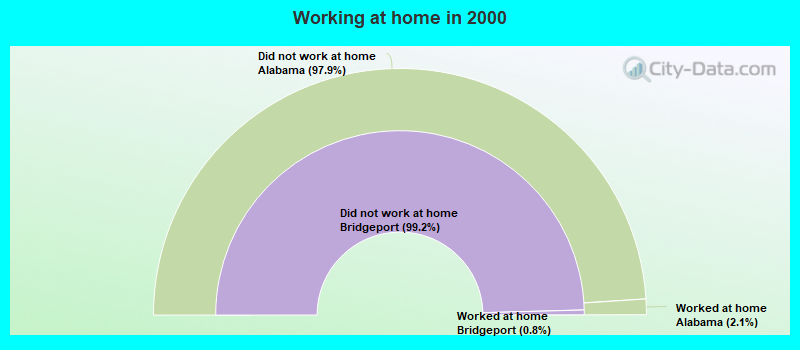
Working at home (%)
Working at home (% change since 2000)
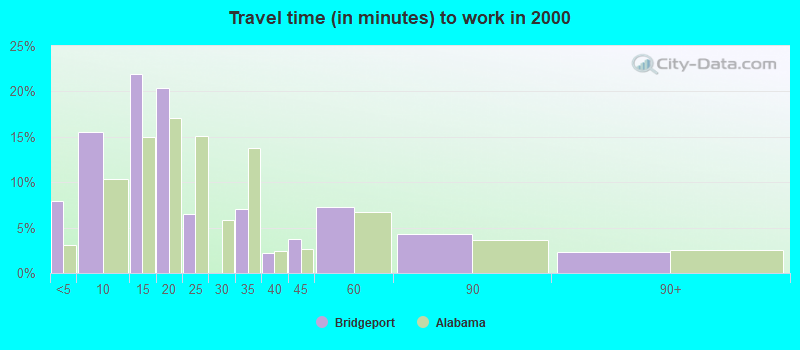
Travel time to work - Less than 5 minutes (%)
Travel time to work - Less than 5 minutes (% change since 2000)
Travel time to work - 5 to 9 minutes (%)
Travel time to work - 5 to 9 minutes (% change since 2000)
Travel time to work - 10 to 19 minutes (%)
Travel time to work - 10 to 19 minutes (% change since 2000)
Travel time to work - 20 to 29 minutes (%)
Travel time to work - 20 to 29 minutes (% change since 2000)
Travel time to work - 30 to 39 minutes (%)
Travel time to work - 30 to 39 minutes (% change since 2000)
Travel time to work - 40 to 59 minutes (%)
Travel time to work - 40 to 59 minutes (% change since 2000)
Travel time to work - 60 to 89 minutes (%)
Travel time to work - 60 to 89 minutes (% change since 2000)
Travel time to work - 90 or more minutes (%)
Travel time to work - 90 or more minutes (% change since 2000)
Latest news about work in Bridgeport, AL collected exclusively by city-data.com from local newspapers, TV, and radio stations
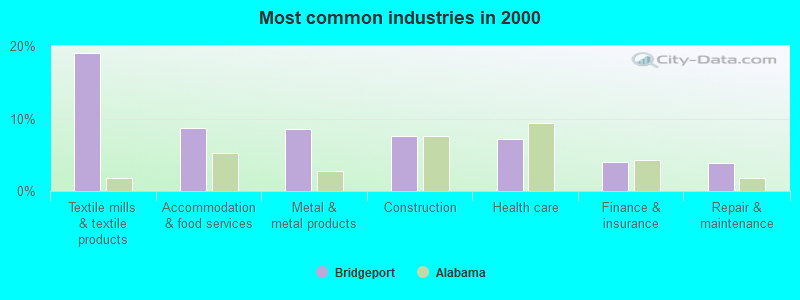
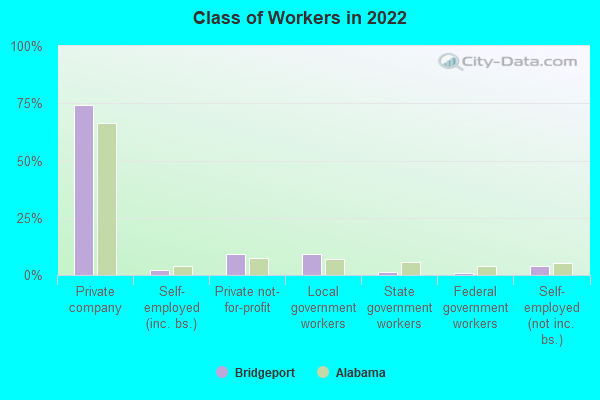
The most common industries in Bridgeport are: Textile mills & textile products (19.0% of civilian employees), Accommodation & food services (8.7% of civilian employees), Metal & metal products (8.5% of civilian employees). 47.1% of workers work in Jackson County and 4.5% of all workers work at home. 74.2% of workers are employees of private companies, which is 10.7% greater than the rate of 66.3% across the entire state of Alabama.
Whole page based on the data from 2000 / 2022 when the population of Bridgeport, Alabama was 2,728 / 2,388
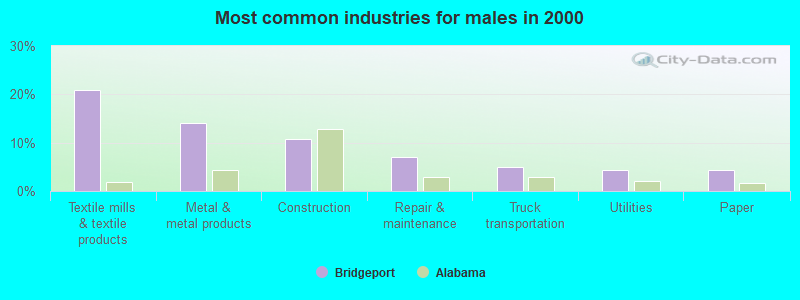
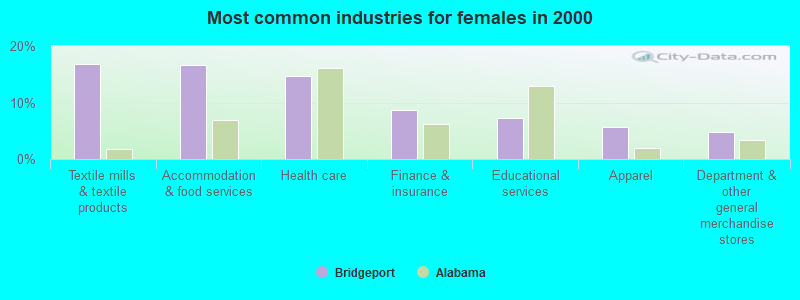
Most common industries
Most common industries Industry All Males Females
Textile mills and textile products 19.0% 20.9% 16.8% Accommodation and food services 8.7% 1.9% 16.6% Metal and metal products 8.5% 14.1% 2.1% Construction 7.6% 10.7% 4.1% Health care 7.2% 0.8% 14.6% Finance and insurance 4.1% 0.0% 8.8% Repair and maintenance 3.8% 7.1% 0.0% Educational services 3.7% 0.6% 7.3% Department and other general merchandise stores 3.0% 1.4% 4.8% Truck transportation 2.7% 5.0% 0.0% Apparel 2.7% 0.0% 5.7% Paper 2.7% 4.3% 0.7% Public administration 2.5% 3.3% 1.6% Machinery 2.4% 3.1% 1.6% Utilities 2.3% 4.3% 0.0% Social assistance 1.7% 0.9% 2.5% Wood products 1.5% 2.0% 0.9% Food and beverage stores 1.3% 0.9% 1.8% Personal and laundry services 1.3% 0.0% 2.9% Transportation equipment 1.2% 2.3% 0.0% Food 1.1% 0.6% 1.6% Building material and garden equipment and supplies dealers 1.1% 1.1% 1.1% Furniture and related product manufacturing 0.9% 0.6% 1.2% Printing and related support activities 0.8% 1.5% 0.0% Professional, scientific, and technical services 0.8% 0.8% 0.9% Administrative and support and waste management services 0.8% 1.5% 0.0% Mining, quarrying, and oil and gas extraction 0.7% 1.2% 0.0% Plastics and rubber products 0.7% 0.8% 0.5% Nonmetallic mineral products 0.6% 1.1% 0.0% Rail transportation 0.6% 1.1% 0.0% Motor vehicle and parts dealers 0.4% 0.8% 0.0% Agriculture, forestry, fishing and hunting 0.3% 0.6% 0.0% Jewelry, luggage, and leather goods stores 0.3% 0.6% 0.0% Chemicals 0.3% 0.6% 0.0% Computer and electronic products 0.3% 0.6% 0.0% Electrical equipment, appliances, and components 0.3% 0.6% 0.0% Retail florists 0.3% 0.6% 0.0% Broadcasting and telecommunications 0.3% 0.0% 0.7% Miscellaneous nondurable goods merchant wholesalers 0.3% 0.6% 0.0% Miscellaneous manufacturing 0.2% 0.5% 0.0% Used merchandise, gift, novelty, and souvenir, and other miscellaneous stores 0.2% 0.0% 0.5% Real estate and rental and leasing 0.2% 0.0% 0.5% Petroleum and petroleum products merchant wholesalers 0.2% 0.5% 0.0%
Unemployment in Bridgeport Unemployment by race in 2022
Unemployment rate for White non-Hispanic residents 4.9% Males8.1% FemalesUnemployment rate for Black residents 64.3% MalesUnemployment by race in 2000
Unemployment rate for White non-Hispanic residents 5.0% Males4.6% FemalesUnemployment rate for Black residents 12.2% Males12.0% FemalesUnemployment rate for two or more race residents 20.0% Males
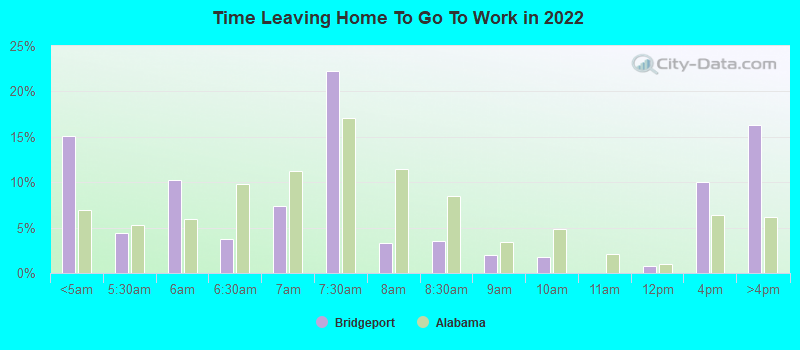
Time leaving home to go to work 12:00 a.m. to 4:59 a.m.: Bridgeport:
15.0% (117)Alabama:
6.9% (142,387)
5:00 a.m. to 5:29 a.m.: Bridgeport:
4.4% (34)Alabama:
5.2% (107,994)
5:30 a.m. to 5:59 a.m.: Bridgeport:
10.3% (80)Alabama:
5.9% (122,369)
6:00 a.m. to 6:29 a.m.: Bridgeport:
3.7% (29)Alabama:
9.8% (202,329)
6:30 a.m. to 6:59 a.m.: Bridgeport:
7.3% (57)Alabama:
11.2% (230,301)
7:00 a.m. to 7:29 a.m.: Bridgeport:
22.3% (173)Alabama:
17.1% (351,870)
7:30 a.m. to 7:59 a.m.: Bridgeport:
3.3% (25)Alabama:
11.5% (236,564)
8:00 a.m. to 8:29 a.m.: Bridgeport:
3.5% (27)Alabama:
8.5% (174,204)
8:30 a.m. to 8:59 a.m.: Bridgeport:
2.0% (15)Alabama:
3.4% (70,689)
9:00 a.m. to 9:59 a.m.: Bridgeport:
1.8% (14)Alabama:
4.8% (98,817)
11:00 a.m. to 11:59 a.m.: Bridgeport:
0.8% (6)Alabama:
1.0% (20,887)
12:00 p.m. to 3:59 p.m.: Bridgeport:
10.0% (77)Alabama:
6.4% (131,127)
4:00 p.m. to 11:59 p.m.: Bridgeport:
16.3% (127)Alabama:
6.1% (126,353)
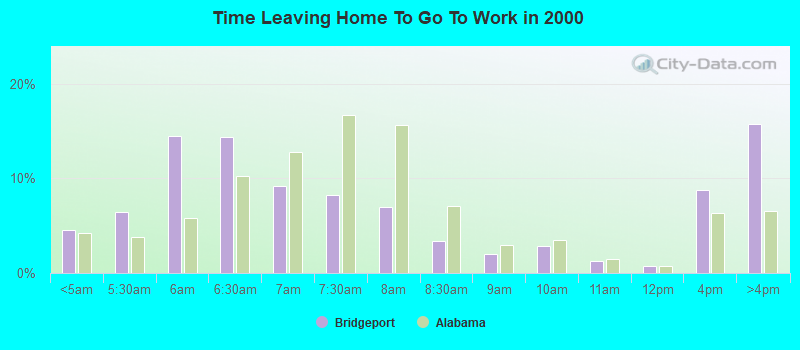
<5am: Bridgeport:
4.5% (53)Alabama:
4.2% (80,283)
5:30am: Bridgeport:
6.5% (76)Alabama:
3.9% (73,270)
6am: Bridgeport:
14.4% (169)Alabama:
5.8% (109,814)
6:30am: Bridgeport:
14.4% (168)Alabama:
10.3% (195,070)
7am: Bridgeport:
9.2% (108)Alabama:
12.7% (242,086)
7:30am: Bridgeport:
8.2% (96)Alabama:
16.7% (317,590)
8am: Bridgeport:
7.0% (82)Alabama:
15.7% (298,086)
8:30am: Bridgeport:
3.3% (39)Alabama:
7.1% (135,165)
9am: Bridgeport:
2.1% (24)Alabama:
2.9% (55,392)
10am: Bridgeport:
2.9% (34)Alabama:
3.5% (67,166)
11am: Bridgeport:
1.3% (15)Alabama:
1.5% (29,085)
12pm: Bridgeport:
0.8% (9)Alabama:
0.7% (13,694)
4pm: Bridgeport:
8.8% (103)Alabama:
6.3% (119,754)
>4pm: Bridgeport:
15.7% (184)Alabama:
6.5% (124,331)
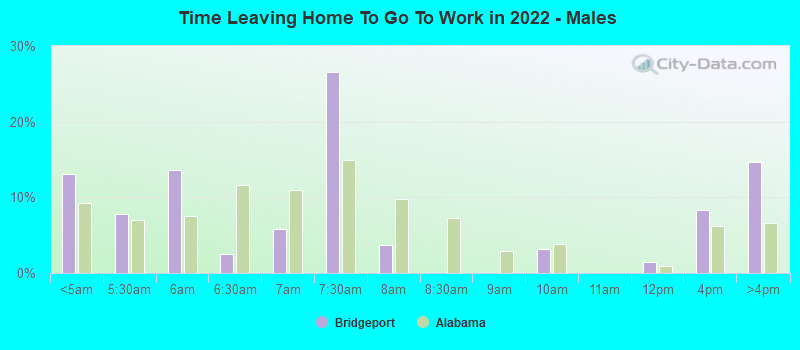
12:00 a.m. to 4:59 a.m. - Males: Bridgeport:
13.1% (56)Alabama:
9.2% (100,860)
5:00 a.m. to 5:29 a.m. - Males: Bridgeport:
7.8% (34)Alabama:
7.0% (76,240)
5:30 a.m. to 5:59 a.m. - Males: Bridgeport:
13.6% (59)Alabama:
7.5% (82,102)
6:00 a.m. to 6:29 a.m. - Males: Bridgeport:
2.6% (11)Alabama:
11.6% (127,090)
6:30 a.m. to 6:59 a.m. - Males: Bridgeport:
5.8% (25)Alabama:
11.0% (120,602)
7:00 a.m. to 7:29 a.m. - Males: Bridgeport:
26.5% (114)Alabama:
14.9% (163,229)
7:30 a.m. to 7:59 a.m. - Males: Bridgeport:
3.7% (16)Alabama:
9.7% (106,349)
9:00 a.m. to 9:59 a.m. - Males: Bridgeport:
3.2% (14)Alabama:
3.8% (41,927)
11:00 a.m. to 11:59 a.m. - Males: Bridgeport:
1.5% (6)Alabama:
0.9% (9,376)
12:00 p.m. to 3:59 p.m. - Males: Bridgeport:
8.4% (36)Alabama:
6.2% (67,527)
4:00 p.m. to 11:59 p.m. - Males: Bridgeport:
14.6% (63)Alabama:
6.6% (72,202)
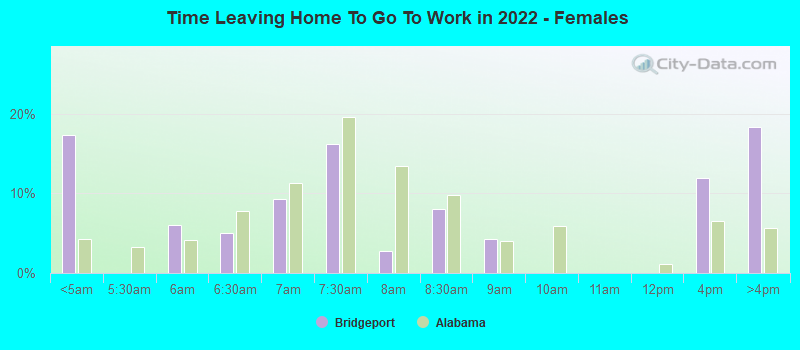
12:00 a.m. to 4:59 a.m. - Females: Bridgeport:
17.4% (60)Alabama:
4.3% (41,527)
5:30 a.m. to 5:59 a.m. - Females: Bridgeport:
6.0% (21)Alabama:
4.2% (40,267)
6:00 a.m. to 6:29 a.m. - Females: Bridgeport:
5.1% (17)Alabama:
7.8% (75,239)
6:30 a.m. to 6:59 a.m. - Females: Bridgeport:
9.3% (32)Alabama:
11.4% (109,699)
7:00 a.m. to 7:29 a.m. - Females: Bridgeport:
16.2% (56)Alabama:
19.5% (188,641)
7:30 a.m. to 7:59 a.m. - Females: Bridgeport:
2.7% (9)Alabama:
13.5% (130,215)
8:00 a.m. to 8:29 a.m. - Females: Bridgeport:
8.1% (28)Alabama:
9.8% (94,324)
8:30 a.m. to 8:59 a.m. - Females: Bridgeport:
4.3% (15)Alabama:
4.0% (39,071)
12:00 p.m. to 3:59 p.m. - Females: Bridgeport:
12.0% (41)Alabama:
6.6% (63,600)
4:00 p.m. to 11:59 p.m. - Females: Bridgeport:
18.3% (63)Alabama:
5.6% (54,151)
Travel time to work Percentage of workers working in this county: 47.1%Number of people working at home: 37 (4.5% of all workers )
Less than 5 minutes: Bridgeport:
8.8% (73)Alabama:
2.9% (58,582)
5 to 9 minutes: Bridgeport:
7.4% (61)Alabama:
9.3% (186,754)
10 to 14 minutes: Bridgeport:
8.7% (72)Alabama:
13.9% (279,925)
15 to 19 minutes: Bridgeport:
11.3% (93)Alabama:
16.3% (327,575)
20 to 24 minutes: Bridgeport:
12.9% (106)Alabama:
15.4% (310,101)
25 to 29 minutes: Bridgeport:
8.5% (70)Alabama:
7.1% (143,110)
30 to 34 minutes: Bridgeport:
12.6% (104)Alabama:
14.1% (285,096)
35 to 39 minutes: Bridgeport:
0.5% (4)Alabama:
3.5% (70,004)
40 to 44 minutes: Bridgeport:
4.0% (33)Alabama:
3.1% (61,619)
45 to 59 minutes: Bridgeport:
16.1% (133)Alabama:
7.9% (158,586)
60 to 89 minutes: Bridgeport:
7.7% (63)Alabama:
4.6% (93,163)
90 or more minutes: Bridgeport:
1.9% (16)Alabama:
2.0% (41,010)
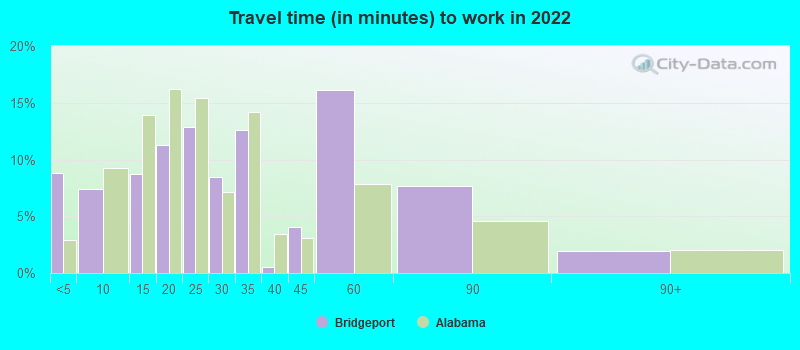
Less than 5 minutes: Bridgeport:
7.9% (93)Alabama:
3.1% (58,125)
5 to 9 minutes: Bridgeport:
15.6% (182)Alabama:
10.3% (196,568)
10 to 14 minutes: Bridgeport:
22.0% (257)Alabama:
15.0% (284,405)
15 to 19 minutes: Bridgeport:
20.3% (238)Alabama:
17.0% (323,887)
20 to 24 minutes: Bridgeport:
6.5% (76)Alabama:
15.0% (285,904)
30 to 34 minutes: Bridgeport:
7.0% (82)Alabama:
13.7% (260,798)
35 to 39 minutes: Bridgeport:
2.2% (26)Alabama:
2.5% (46,607)
40 to 44 minutes: Bridgeport:
3.8% (44)Alabama:
2.6% (49,212)
45 to 59 minutes: Bridgeport:
7.3% (85)Alabama:
6.7% (127,205)
60 to 89 minutes: Bridgeport:
4.3% (50)Alabama:
3.7% (69,866)
90 or more minutes: Bridgeport:
2.3% (27)Alabama:
2.5% (48,005)
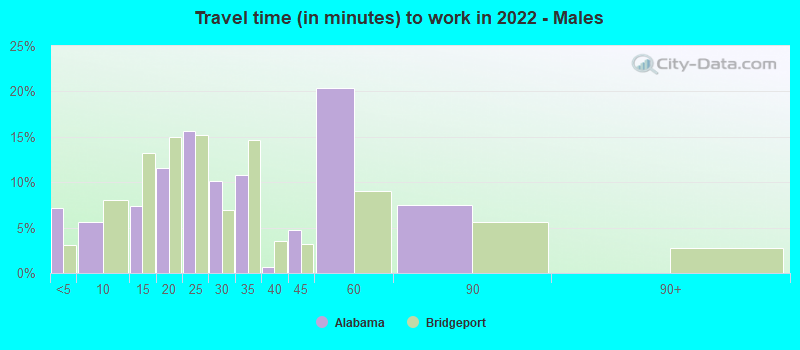
Less than 5 minutes - Males: Bridgeport:
7.2% (49)Alabama:
3.1% (32,846)
5 to 9 minutes - Males: Bridgeport:
5.6% (38)Alabama:
8.1% (86,294)
10 to 14 minutes - Males: Bridgeport:
7.4% (50)Alabama:
13.2% (140,867)
15 to 19 minutes - Males: Bridgeport:
11.5% (79)Alabama:
15.0% (159,981)
20 to 24 minutes - Males: Bridgeport:
15.6% (106)Alabama:
15.2% (162,214)
25 to 29 minutes - Males: Bridgeport:
10.2% (69)Alabama:
6.9% (73,819)
30 to 34 minutes - Males: Bridgeport:
10.7% (73)Alabama:
14.7% (156,884)
35 to 39 minutes - Males: Bridgeport:
0.6% (4)Alabama:
3.5% (37,059)
40 to 44 minutes - Males: Bridgeport:
4.8% (32)Alabama:
3.1% (33,614)
45 to 59 minutes - Males: Bridgeport:
20.3% (139)Alabama:
9.0% (96,289)
60 to 89 minutes - Males: Bridgeport:
7.4% (51)Alabama:
5.6% (59,809)
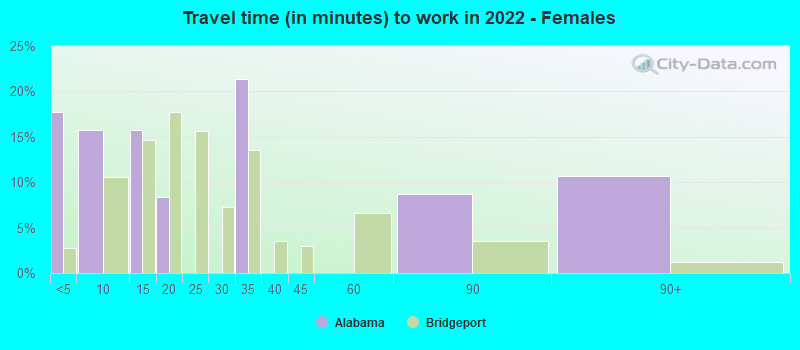
Less than 5 minutes - Females: Bridgeport:
17.8% (26)Alabama:
2.7% (25,736)
5 to 9 minutes - Females: Bridgeport:
15.8% (23)Alabama:
10.6% (100,460)
10 to 14 minutes - Females: Bridgeport:
15.8% (23)Alabama:
14.7% (139,058)
15 to 19 minutes - Females: Bridgeport:
8.4% (12)Alabama:
17.7% (167,594)
30 to 34 minutes - Females: Bridgeport:
21.4% (31)Alabama:
13.5% (128,212)
60 to 89 minutes - Females: Bridgeport:
8.7% (12)Alabama:
3.5% (33,354)
90 or more minutes - Females: Bridgeport:
10.6% (15)Alabama:
1.2% (11,520)
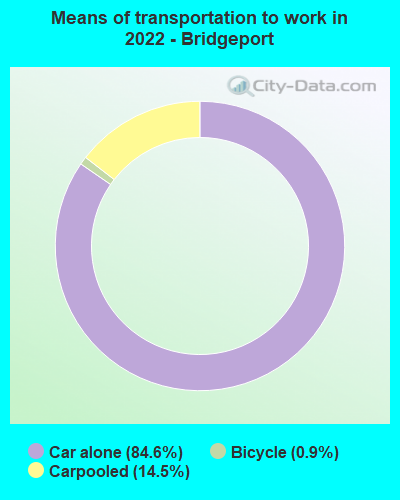
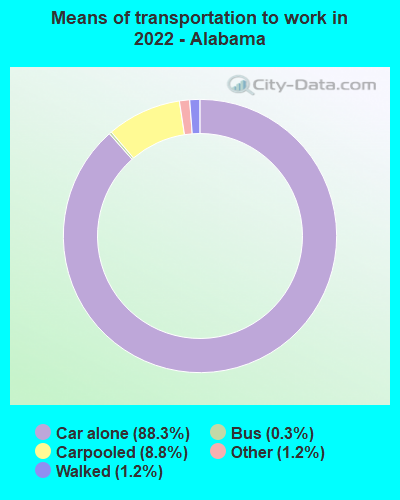
Means of transportation to work Drove car alone: Bridgeport:
84.6% (716)Alabama:
88.3% (835,794)
Carpooled: Bridgeport:
14.5% (123)Alabama:
8.8% (86,879)
Bicycle: Bridgeport:
0.9% (7)Alabama:
0.1% (580)
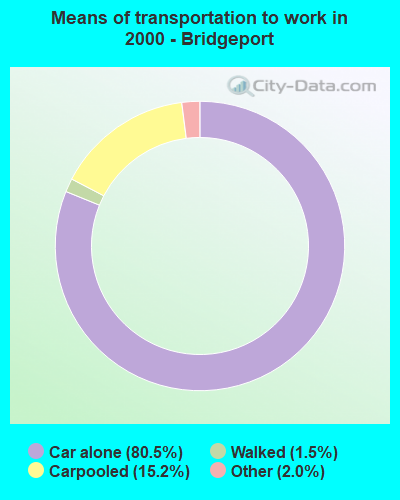
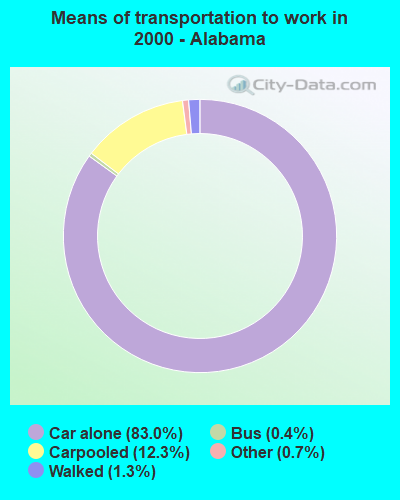
Drove car alone: Bridgeport:
80.5% (942)Alabama:
83.0% (1,576,882)
Carpooled: Bridgeport:
15.2% (178)Alabama:
12.3% (234,020)
Walked: Bridgeport:
1.5% (17)Alabama:
1.3% (25,360)
Other means: Bridgeport:
2.0% (23)Alabama:
0.7% (12,430)
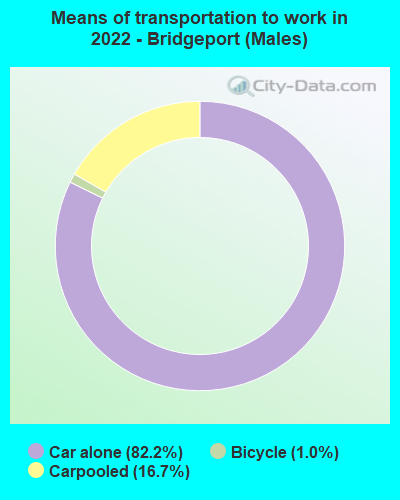
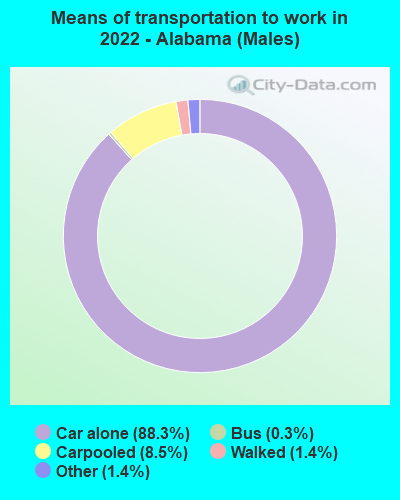
Drove car alone - Males: Bridgeport:
82.2% (572)Alabama:
88.3% (835,794)
Carpooled - Males: Bridgeport:
16.7% (116)Alabama:
8.5% (86,879)
Bicycle - Males: Bridgeport:
1.0% (7)Alabama:
0.1% (580)
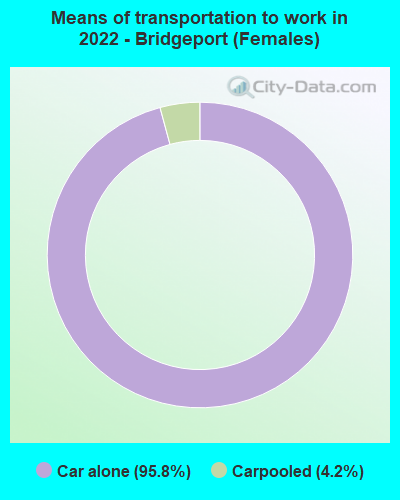
Drove car alone - Females: Bridgeport:
95.8% (142)Alabama:
88.3% (835,794)
Carpooled - Females: Bridgeport:
4.2% (6)Alabama:
9.2% (86,879)
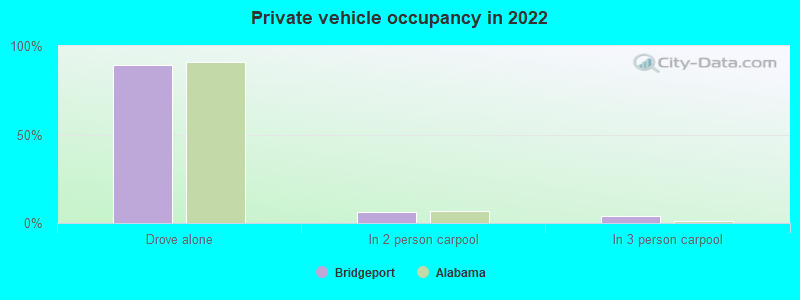
Private vehicle occupancy Drove alone: Bridgeport:
89.3% (672)Alabama:
91.0% (1,820,084)
In 2 person carpool: Bridgeport:
6.5% (49)Alabama:
6.9% (137,324)
In 3 person carpool: Bridgeport:
4.2% (32)Alabama:
1.2% (24,905)
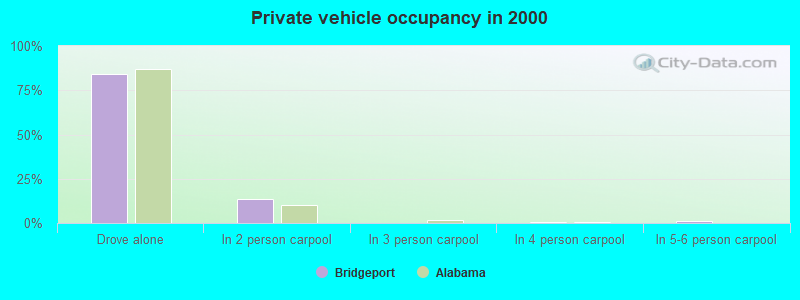
Drove alone: Bridgeport:
84.1% (942)Alabama:
87.1% (1,576,882)
In 2 person carpool: Bridgeport:
13.8% (155)Alabama:
10.1% (182,201)
In 4 person carpool: Bridgeport:
0.4% (4)Alabama:
0.6% (10,909)
In 5-6 person carpool: Bridgeport:
1.2% (14)Alabama:
0.3% (4,815)
In 7+ person carpool: Bridgeport:
0.4% (5)Alabama:
0.1% (2,353)
Class of workers
Employee of private company: Bridgeport:
74.2% (621)Alabama:
66.3% (1,510,956)
Self-employed in own incorporated business: Bridgeport:
2.0% (16)Alabama:
4.1% (92,420)
Private not-for-profit wage and salary workers: Bridgeport:
9.0% (75)Alabama:
7.5% (171,905)
Local government workers: Bridgeport:
9.0% (75)Alabama:
7.0% (159,468)
State government workers: Bridgeport:
1.1% (9)Alabama:
5.5% (124,918)
Federal government workers: Bridgeport:
0.7% (6)Alabama:
4.0% (90,851)
Self-employed workers in own not incorporated business: Bridgeport:
3.9% (33)Alabama:
5.4% (122,821)
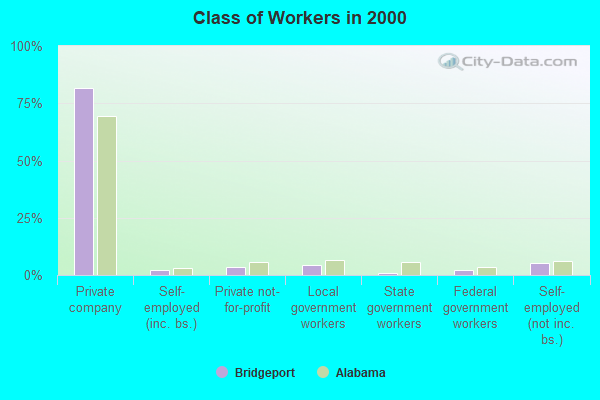
Employee of private company: Bridgeport:
81.7% (985)Alabama:
69.3% (1,330,489)
Self-employed in own incorporated business: Bridgeport:
2.4% (29)Alabama:
3.0% (56,994)
Private not-for-profit wage and salary workers: Bridgeport:
3.4% (41)Alabama:
5.7% (109,055)
Local government workers: Bridgeport:
4.1% (50)Alabama:
6.7% (128,778)
State government workers: Bridgeport:
0.7% (8)Alabama:
5.5% (105,286)
Federal government workers: Bridgeport:
2.0% (24)Alabama:
3.4% (64,370)
Self-employed workers in own not incorporated business: Bridgeport:
5.4% (65)Alabama:
6.2% (119,345)
Unpaid family workers: Bridgeport:
0.3% (4)Alabama:
0.3% (5,872)
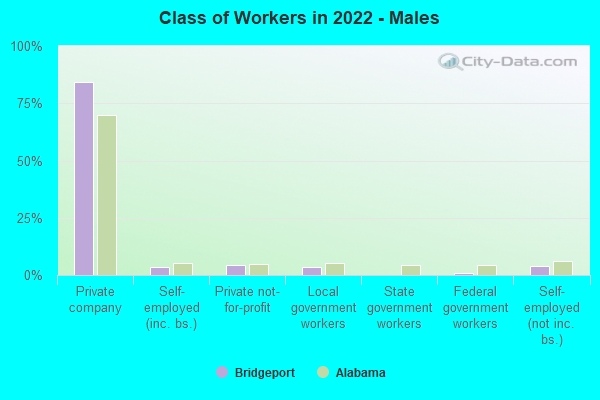
Employee of private company - Males: Bridgeport:
84.5% (398)Alabama:
70.1% (833,392)
Self-employed in own incorporated business - Males: Bridgeport:
3.5% (16)Alabama:
5.2% (61,823)
Private not-for-profit wage and salary workers - Males: Bridgeport:
4.2% (20)Alabama:
4.7% (55,319)
Local government workers - Males: Bridgeport:
3.3% (15)Alabama:
5.4% (64,465)
Federal government workers - Males: Bridgeport:
0.9% (4)Alabama:
4.2% (50,378)
Self-employed workers in own not incorporated business - Males: Bridgeport:
3.7% (18)Alabama:
6.0% (71,853)
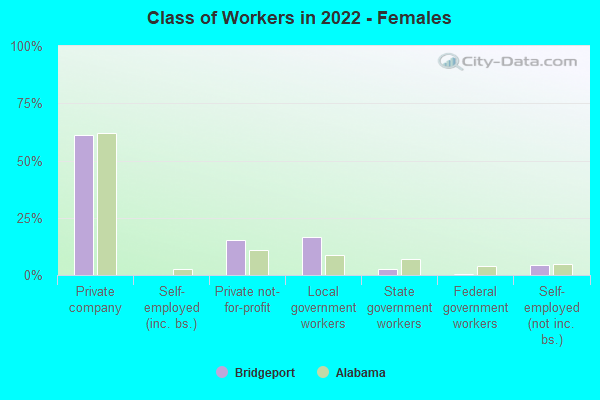
Employee of private company - Females: Bridgeport:
61.0% (223)Alabama:
62.2% (677,564)
Private not-for-profit wage and salary workers - Females: Bridgeport:
15.3% (56)Alabama:
10.7% (116,586)
Local government workers - Females: Bridgeport:
16.4% (60)Alabama:
8.7% (95,003)
State government workers - Females: Bridgeport:
2.5% (9)Alabama:
6.9% (74,988)
Federal government workers - Females: Bridgeport:
0.6% (2)Alabama:
3.7% (40,473)
Self-employed workers in own not incorporated business - Females: Bridgeport:
4.2% (15)Alabama:
4.7% (50,968)