Work and Jobs in Burrillville, Rhode Island (RI) Detailed Stats
Occupations, Industries, Unemployment, Workers, Commute
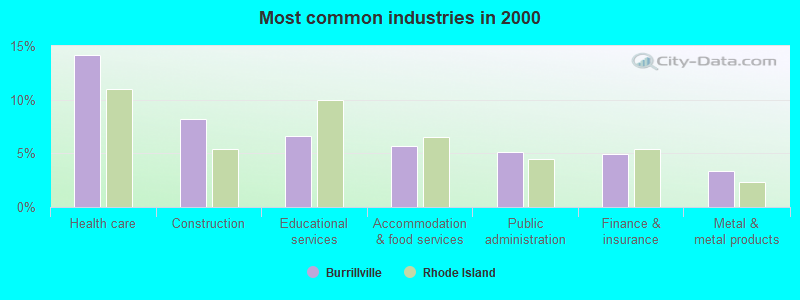
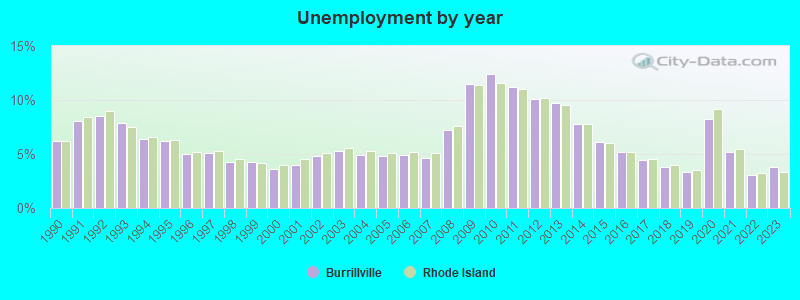
The unemployment rate in 2023 in Burrillville, RI was 3.8%, which was 13.2% greater than the unemployment rate of 3.3% across the entire state of Rhode Island. Compared to the unemployment rate of 9.7% in 2013, this represents a decrease of 155.3%. The most common industries in Burrillville are: Health care (14.2% of civilian employees), Construction (8.2% of civilian employees), Educational services (6.6% of civilian employees). 70.6% of workers are employees of private companies, which is 5.2% greater than the rate of 66.9% across the entire state of Rhode Island.
Most common industries
Most common industries | |||
|---|---|---|---|
Industry | All | Males | Females |
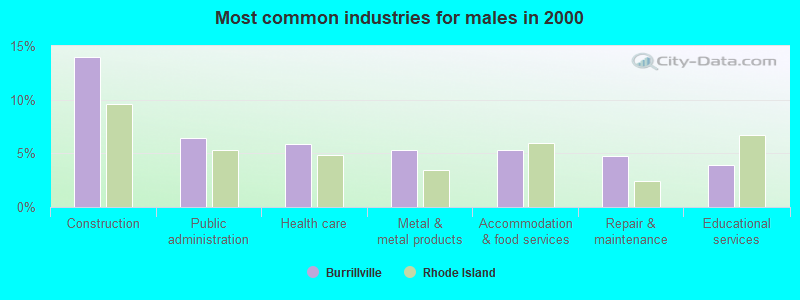
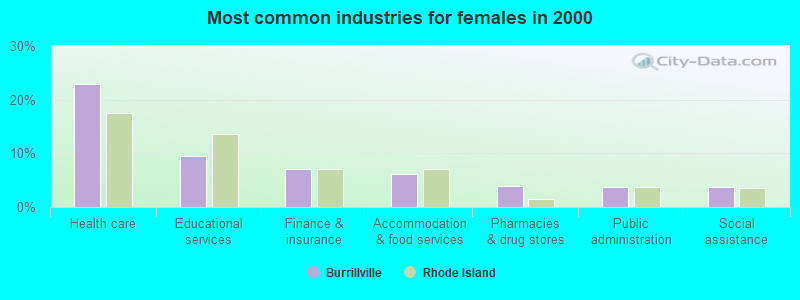
| Health care | 14.2% (1,202) | 5.9% (257) | 22.9% (945) |
| Construction | 8.2% (697) | 14.0% (609) | 2.1% (88) |
| Educational services | 6.6% (562) | 3.9% (171) | 9.5% (391) |
| Accommodation and food services | 5.7% (483) | 5.3% (231) | 6.1% (252) |
| Public administration | 5.1% (435) | 6.4% (279) | 3.8% (156) |
| Finance and insurance | 4.9% (417) | 3.0% (129) | 7.0% (288) |
| Metal and metal products | 3.4% (287) | 5.3% (233) | 1.3% (54) |
| Professional, scientific, and technical services | 2.7% (232) | 2.1% (93) | 3.4% (139) |
| Repair and maintenance | 2.7% (225) | 4.8% (208) | 0.4% (17) |
| Food and beverage stores | 2.7% (225) | 3.0% (130) | 2.3% (95) |
| Pharmacies and drug stores | 2.5% (212) | 1.2% (53) | 3.9% (159) |
| Miscellaneous manufacturing | 2.5% (212) | 2.4% (106) | 2.6% (106) |
| Administrative and support and waste management services | 2.2% (189) | 2.8% (122) | 1.6% (67) |
| Social assistance | 2.0% (173) | 0.5% (23) | 3.6% (150) |
| Plastics and rubber products | 2.0% (170) | 3.1% (136) | 0.8% (34) |
| Computer and electronic products | 1.6% (136) | 1.9% (81) | 1.3% (55) |
| Other transportation, and support activities, and couriers | 1.4% (117) | 1.2% (53) | 1.6% (64) |
| Personal and laundry services | 1.3% (111) | 0.5% (21) | 2.2% (90) |
| Printing and related support activities | 1.2% (105) | 1.0% (45) | 1.5% (60) |
| Broadcasting and telecommunications | 1.2% (101) | 1.4% (60) | 1.0% (41) |
| Chemicals | 1.1% (95) | 1.2% (52) | 1.0% (43) |
| Motor vehicle and parts dealers | 1.1% (95) | 2.0% (88) | 0.2% (7) |
| Utilities | 1.1% (95) | 1.4% (62) | 0.8% (33) |
| Arts, entertainment, and recreation | 1.1% (94) | 1.5% (66) | 0.7% (28) |
| Transportation equipment | 1.1% (94) | 1.3% (56) | 0.9% (38) |
| Real estate and rental and leasing | 1.1% (92) | 0.7% (30) | 1.5% (62) |
| Department and other general merchandise stores | 1.1% (90) | 0.4% (19) | 1.7% (71) |
| Religious, grantmaking, civic, professional, and similar organizations | 1.0% (88) | 0.8% (34) | 1.3% (54) |
| U. S. Postal service | 1.0% (87) | 1.3% (56) | 0.8% (31) |
| Food | 1.0% (87) | 1.8% (78) | 0.2% (9) |
| Truck transportation | 1.0% (86) | 1.8% (79) | 0.2% (7) |
| Radio, TV, and computer stores | 0.8% (69) | 0.9% (40) | 0.7% (29) |
| Other direct selling establishments | 0.8% (68) | 0.6% (28) | 1.0% (40) |
| Machinery, equipment, and supplies merchant wholesalers | 0.8% (65) | 0.6% (28) | 0.9% (37) |
| Building material and garden equipment and supplies dealers | 0.7% (62) | 1.1% (50) | 0.3% (12) |
| Furniture and home furnishings, and household appliance stores | 0.7% (56) | 0.6% (26) | 0.7% (30) |
| Miscellaneous nondurable goods merchant wholesalers | 0.6% (50) | 0.4% (19) | 0.8% (31) |
| Retail florists | 0.6% (49) | 0.3% (13) | 0.9% (36) |
| Publishing, and motion picture and sound recording industries | 0.6% (49) | 0.3% (12) | 0.9% (37) |
| Data processing, libraries, and other information services | 0.6% (48) | 0.3% (13) | 0.8% (35) |
| Warehousing and storage | 0.5% (43) | 0.8% (35) | 0.2% (8) |
| Electrical and electronic goods merchant wholesalers | 0.5% (42) | 0.7% (32) | 0.2% (10) |
| Groceries and related products merchant wholesalers | 0.5% (40) | 0.9% (40) | 0.0% (0) |
| Electrical equipment, appliances, and components | 0.4% (38) | 0.9% (38) | 0.0% (0) |
| Machinery | 0.4% (37) | 0.5% (21) | 0.4% (16) |
| Textile mills and textile products | 0.4% (36) | 0.5% (21) | 0.4% (15) |
| Private households | 0.4% (33) | 0.0% (0) | 0.8% (33) |
| Clothing and accessories, including shoe, stores | 0.4% (32) | 0.2% (10) | 0.5% (22) |
| Hardware, plumbing and heating equipment, and supplies merchant wholesalers | 0.3% (28) | 0.5% (23) | 0.1% (5) |
| Motor vehicles, parts and supplies merchant wholesalers | 0.3% (27) | 0.6% (27) | 0.0% (0) |
| Apparel | 0.3% (26) | 0.2% (8) | 0.4% (18) |
| Rail transportation | 0.3% (25) | 0.6% (25) | 0.0% (0) |
| Miscellaneous durable goods merchant wholesalers | 0.3% (25) | 0.3% (14) | 0.3% (11) |
| Used merchandise, gift, novelty, and souvenir, and other miscellaneous stores | 0.2% (21) | 0.0% (0) | 0.5% (21) |
| Sporting goods, camera, and hobby and toy stores | 0.2% (20) | 0.0% (0) | 0.5% (20) |
| Fuel dealers | 0.2% (19) | 0.4% (19) | 0.0% (0) |
| Furniture and related product manufacturing | 0.2% (17) | 0.4% (17) | 0.0% (0) |
| Agriculture, forestry, fishing and hunting | 0.2% (16) | 0.2% (10) | 0.1% (6) |
| Nonmetallic mineral products | 0.2% (15) | 0.3% (15) | 0.0% (0) |
| Wood products | 0.2% (15) | 0.3% (15) | 0.0% (0) |
| Air transportation | 0.2% (15) | 0.3% (15) | 0.0% (0) |
| Paper | 0.2% (14) | 0.1% (6) | 0.2% (8) |
| Metals and minerals, except petroleum, merchant wholesalers | 0.2% (13) | 0.3% (13) | 0.0% (0) |
| Health and personal care, except drug, stores | 0.1% (12) | 0.3% (12) | 0.0% (0) |
| Vending machine operators | 0.1% (11) | 0.3% (11) | 0.0% (0) |
| Paper and paper products merchant wholesalers | 0.1% (11) | 0.3% (11) | 0.0% (0) |
| Apparel, fabrics, and notions merchant wholesalers | 0.1% (8) | 0.2% (8) | 0.0% (0) |
| Mining, quarrying, and oil and gas extraction | 0.1% (7) | 0.2% (7) | 0.0% (0) |
| Gasoline stations | 0.1% (7) | 0.2% (7) | 0.0% (0) |
| Lumber and other construction materials merchant wholesalers | 0.1% (7) | 0.2% (7) | 0.0% (0) |
| Petroleum and petroleum products merchant wholesalers | 0.1% (5) | 0.1% (5) | 0.0% (0) |
Unemployment in Burrillville
- Unemployment by race in 2000
- Unemployment rate for White non-Hispanic residents
- 6.1%Males
- 3.5%Females
- Unemployment rate for Black residents
- 27.3%Males
Unemployment in 2023:
| Burrillville: | 3.8% |
| Rhode Island: | 3.3% |
Unemployment in 2022:
| Burrillville: | 3.1% |
| Rhode Island: | 3.2% |
Unemployment in 2021:
| Burrillville: | 5.2% |
| Rhode Island: | 5.5% |
Unemployment in 2020:
| Burrillville: | 8.2% |
| Rhode Island: | 9.2% |
Unemployment in 2019:
| Burrillville: | 3.3% |
| Rhode Island: | 3.5% |
Unemployment in 2018:
| Burrillville: | 3.8% |
| Rhode Island: | 4.0% |
Unemployment in 2017:
| Burrillville: | 4.4% |
| Rhode Island: | 4.5% |
Unemployment in 2016:
| Burrillville: | 5.2% |
| Rhode Island: | 5.2% |
Unemployment in 2015:
| Burrillville: | 6.1% |
| Rhode Island: | 6.0% |
Unemployment in 2014:
| Burrillville: | 7.8% |
| Rhode Island: | 7.8% |
Unemployment in 2013:
| Burrillville: | 9.7% |
| Rhode Island: | 9.5% |
Unemployment in 2012:
| Burrillville: | 10.1% |
| Rhode Island: | 10.2% |
Unemployment in 2011:
| Burrillville: | 11.2% |
| Rhode Island: | 11.0% |
Unemployment in 2010:
| Burrillville: | 12.4% |
| Rhode Island: | 11.6% |
Unemployment in 2009:
| Burrillville: | 11.5% |
| Rhode Island: | 11.4% |
Unemployment in 2008:
| Burrillville: | 7.2% |
| Rhode Island: | 7.6% |
Unemployment in 2007:
| Burrillville: | 4.6% |
| Rhode Island: | 5.1% |
Unemployment in 2006:
| Burrillville: | 4.9% |
| Rhode Island: | 5.2% |
Unemployment in 2005:
| Burrillville: | 4.8% |
| Rhode Island: | 5.1% |
Unemployment in 2004:
| Burrillville: | 4.9% |
| Rhode Island: | 5.3% |
Unemployment in 2003:
| Burrillville: | 5.3% |
| Rhode Island: | 5.6% |
Unemployment in 2002:
| Burrillville: | 4.8% |
| Rhode Island: | 5.1% |
Unemployment in 2001:
| Burrillville: | 4.0% |
| Rhode Island: | 4.5% |
Unemployment in 2000:
| Burrillville: | 3.6% |
| Rhode Island: | 4.0% |
Unemployment in 1999:
| Burrillville: | 4.3% |
| Rhode Island: | 4.2% |
Unemployment in 1998:
| Burrillville: | 4.3% |
| Rhode Island: | 4.5% |
Unemployment in 1997:
| Burrillville: | 5.1% |
| Rhode Island: | 5.3% |
Unemployment in 1996:
| Burrillville: | 5.0% |
| Rhode Island: | 5.2% |
Unemployment in 1995:
| Burrillville: | 6.2% |
| Rhode Island: | 6.3% |
Unemployment in 1994:
| Burrillville: | 6.4% |
| Rhode Island: | 6.6% |
Unemployment in 1993:
| Burrillville: | 7.9% |
| Rhode Island: | 7.5% |
Unemployment in 1992:
| Burrillville: | 8.5% |
| Rhode Island: | 9.0% |
Unemployment in 1991:
| Burrillville: | 8.1% |
| Rhode Island: | 8.4% |
Unemployment in 1990:
| Burrillville: | 6.2% |
| Rhode Island: | 6.2% |
Time leaving home to go to work
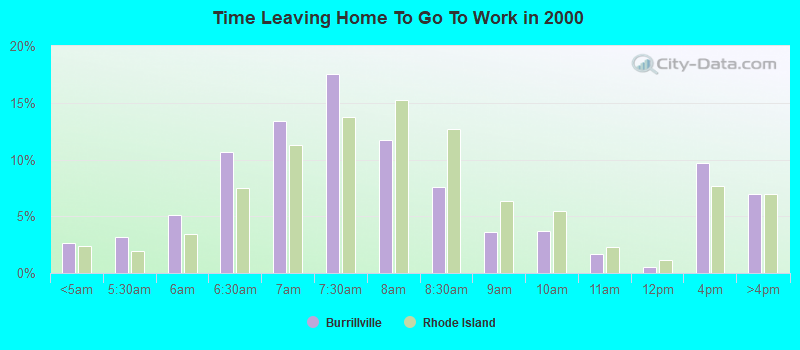
<5am:
| Burrillville: | 2.7% (221) |
| Rhode Island: | 2.4% (11,721) |
5:30am:
| Burrillville: | 3.2% (264) |
| Rhode Island: | 1.9% (9,427) |
6am:
| Burrillville: | 5.1% (424) |
| Rhode Island: | 3.4% (16,776) |
6:30am:
| Burrillville: | 10.7% (887) |
| Rhode Island: | 7.4% (36,550) |
7am:
| Burrillville: | 13.4% (1,113) |
| Rhode Island: | 11.2% (55,159) |
7:30am:
| Burrillville: | 17.6% (1,455) |
| Rhode Island: | 13.7% (67,410) |
8am:
| Burrillville: | 11.7% (972) |
| Rhode Island: | 15.2% (74,686) |
8:30am:
| Burrillville: | 7.6% (629) |
| Rhode Island: | 12.7% (62,164) |
9am:
| Burrillville: | 3.6% (296) |
| Rhode Island: | 6.3% (31,014) |
10am:
| Burrillville: | 3.7% (307) |
| Rhode Island: | 5.5% (26,918) |
11am:
| Burrillville: | 1.7% (141) |
| Rhode Island: | 2.3% (11,126) |
12pm:
| Burrillville: | 0.5% (45) |
| Rhode Island: | 1.1% (5,446) |
4pm:
| Burrillville: | 9.7% (803) |
| Rhode Island: | 7.6% (37,510) |
>4pm:
| Burrillville: | 6.9% (575) |
| Rhode Island: | 6.9% (34,003) |
Travel time to work
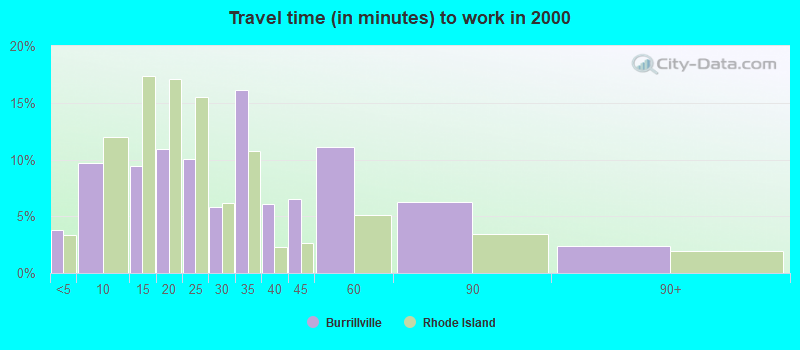
Less than 5 minutes:
| Burrillville: | 3.8% (313) |
| Rhode Island: | 3.4% (16,500) |
5 to 9 minutes:
| Burrillville: | 9.7% (801) |
| Rhode Island: | 12.0% (59,005) |
10 to 14 minutes:
| Burrillville: | 9.5% (784) |
| Rhode Island: | 17.3% (85,107) |
15 to 19 minutes:
| Burrillville: | 10.9% (904) |
| Rhode Island: | 17.1% (83,738) |
20 to 24 minutes:
| Burrillville: | 10.1% (835) |
| Rhode Island: | 15.5% (76,224) |
25 to 29 minutes:
| Burrillville: | 5.8% (480) |
| Rhode Island: | 6.2% (30,333) |
30 to 34 minutes:
| Burrillville: | 16.1% (1,338) |
| Rhode Island: | 10.7% (52,752) |
35 to 39 minutes:
| Burrillville: | 6.1% (504) |
| Rhode Island: | 2.3% (11,163) |
40 to 44 minutes:
| Burrillville: | 6.5% (538) |
| Rhode Island: | 2.7% (13,119) |
45 to 59 minutes:
| Burrillville: | 11.1% (918) |
| Rhode Island: | 5.2% (25,297) |
60 to 89 minutes:
| Burrillville: | 6.3% (520) |
| Rhode Island: | 3.5% (16,992) |
90 or more minutes:
| Burrillville: | 2.4% (197) |
| Rhode Island: | 2.0% (9,680) |
Means of transportation to work
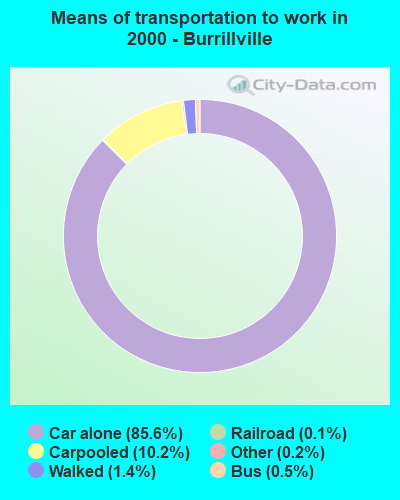
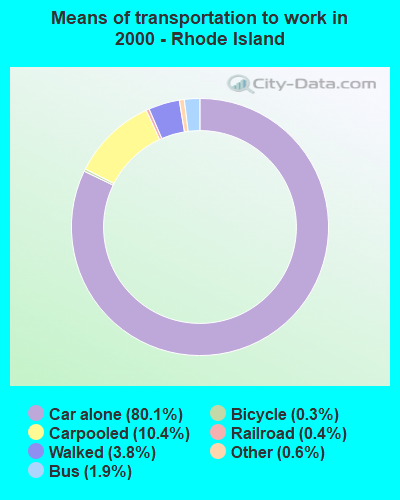
Drove car alone:
| Burrillville: | 85.6% (7,091) |
| Rhode Island: | 80.1% (393,322) |
Carpooled:
| Burrillville: | 10.2% (846) |
| Rhode Island: | 10.4% (51,004) |
Bus or trolley bus:
| Burrillville: | 0.5% (43) |
| Rhode Island: | 1.9% (9,171) |
Subway or elevated:
| Burrillville: | 0.1% (6) |
| Rhode Island: | 0.0% (236) |
Railroad:
| Burrillville: | 0.1% (9) |
| Rhode Island: | 0.4% (2,015) |
Walked:
| Burrillville: | 1.4% (120) |
| Rhode Island: | 3.8% (18,717) |
Other means:
| Burrillville: | 0.2% (17) |
| Rhode Island: | 0.6% (3,118) |
Private vehicle occupancy
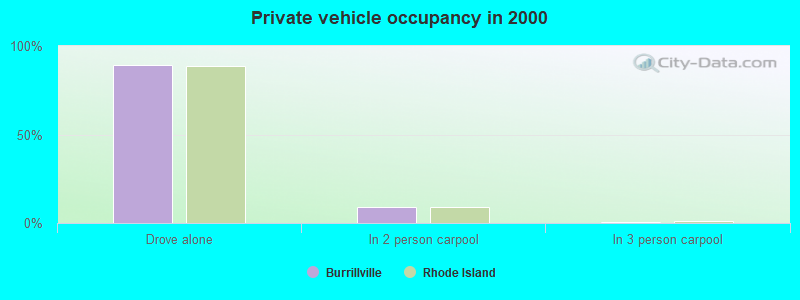
Drove alone:
| Burrillville: | 89.3% (7,091) |
| Rhode Island: | 88.5% (393,322) |
In 2 person carpool:
| Burrillville: | 9.2% (730) |
| Rhode Island: | 9.3% (41,362) |
In 3 person carpool:
| Burrillville: | 0.8% (63) |
| Rhode Island: | 1.3% (5,736) |
In 4 person carpool:
| Burrillville: | 0.1% (5) |
| Rhode Island: | 0.4% (1,768) |
In 5-6 person carpool:
| Burrillville: | 0.1% (6) |
| Rhode Island: | 0.3% (1,129) |
In 7+ person carpool:
| Burrillville: | 0.5% (42) |
| Rhode Island: | 0.2% (1,009) |
Class of workers
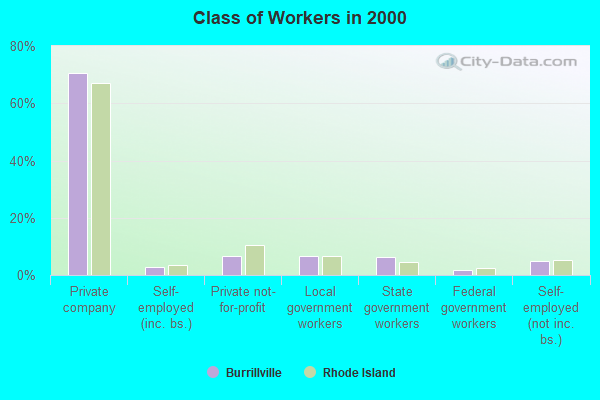
Employee of private company:
| Burrillville: | 70.6% (5,990) |
| Rhode Island: | 66.9% (335,216) |
Self-employed in own incorporated business:
| Burrillville: | 2.8% (240) |
| Rhode Island: | 3.3% (16,647) |
Private not-for-profit wage and salary workers:
| Burrillville: | 6.8% (578) |
| Rhode Island: | 10.3% (51,704) |
Local government workers:
| Burrillville: | 6.7% (565) |
| Rhode Island: | 6.7% (33,698) |
State government workers:
| Burrillville: | 6.3% (533) |
| Rhode Island: | 4.6% (23,172) |
Federal government workers:
| Burrillville: | 1.8% (154) |
| Rhode Island: | 2.4% (12,228) |
Self-employed workers in own not incorporated business:
| Burrillville: | 5.0% (422) |
| Rhode Island: | 5.4% (26,974) |
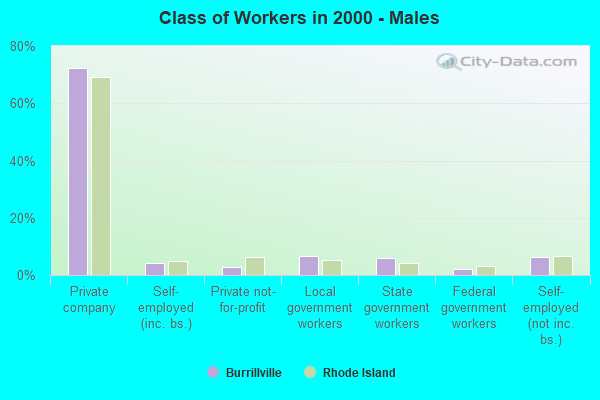
Employee of private company - Males:
| Burrillville: | 72.1% (3,146) |
| Rhode Island: | 69.2% (178,819) |
Self-employed in own incorporated business - Males:
| Burrillville: | 4.2% (183) |
| Rhode Island: | 4.8% (12,406) |
Private not-for-profit wage and salary workers - Males:
| Burrillville: | 2.9% (127) |
| Rhode Island: | 6.5% (16,690) |
Local government workers - Males:
| Burrillville: | 6.5% (283) |
| Rhode Island: | 5.3% (13,791) |
State government workers - Males:
| Burrillville: | 5.8% (255) |
| Rhode Island: | 4.2% (10,825) |
Federal government workers - Males:
| Burrillville: | 2.2% (98) |
| Rhode Island: | 3.1% (8,047) |
Self-employed workers in own not incorporated business - Males:
| Burrillville: | 6.2% (269) |
| Rhode Island: | 6.6% (17,109) |
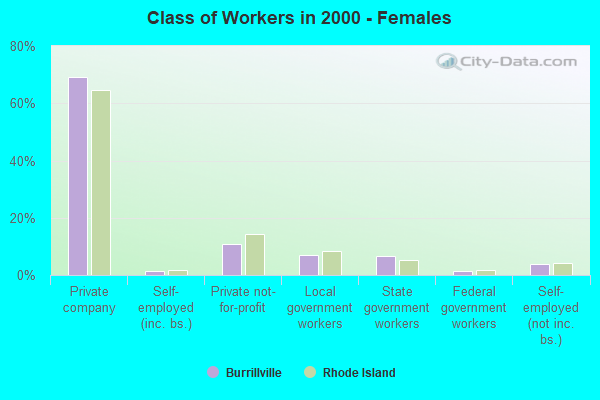
Employee of private company - Females:
| Burrillville: | 69.0% (2,844) |
| Rhode Island: | 64.5% (156,397) |
Self-employed in own incorporated business - Females:
| Burrillville: | 1.4% (57) |
| Rhode Island: | 1.7% (4,241) |
Private not-for-profit wage and salary workers - Females:
| Burrillville: | 10.9% (451) |
| Rhode Island: | 14.4% (35,014) |
Local government workers - Females:
| Burrillville: | 6.8% (282) |
| Rhode Island: | 8.2% (19,907) |
State government workers - Females:
| Burrillville: | 6.7% (278) |
| Rhode Island: | 5.1% (12,347) |
Federal government workers - Females:
| Burrillville: | 1.4% (56) |
| Rhode Island: | 1.7% (4,181) |
Self-employed workers in own not incorporated business - Females:
| Burrillville: | 3.7% (153) |
| Rhode Island: | 4.1% (9,865) |