Work and Jobs in Calvert City, Kentucky (KY) Detailed Stats
Occupations, Industries, Unemployment, Workers, Commute
Settings
X


Recent posts about work in Calvert City, Kentucky on our local forum with over 2,400,000 registered users:
 | LBLfor family and in-laws - Maybe Grand Rivers? (6 replies) |
| Input on local towns and jobs near Kuttawa, KY (5 replies) |
| Calvert City? (9 replies) |
| Seriously considering a move to Paducah, KY (8 replies) |
| Education (1 reply) |
| Questions for Paducah Residents (5 replies) |
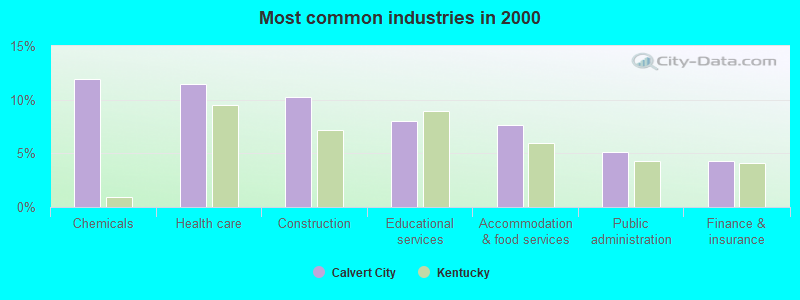
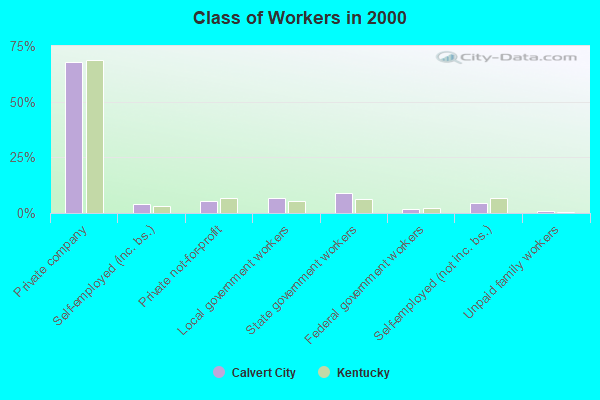
The most common industries in Calvert City are: Chemicals (11.9% of civilian employees), Health care (11.4% of civilian employees), Construction (10.3% of civilian employees). 61.9% of workers work in Marshall County and 2.4% of all workers work at home. 65.7% of workers are employees of private companies, which is 2.3% less than the rate of 67.2% across the entire state of Kentucky.
Whole page based on the data from 2000 / 2022 when the population of Calvert City, Kentucky was 2,701 / 2,529
Whole page based on the data from 2000 / 2022 when the population of Calvert City, Kentucky was 2,701 / 2,529
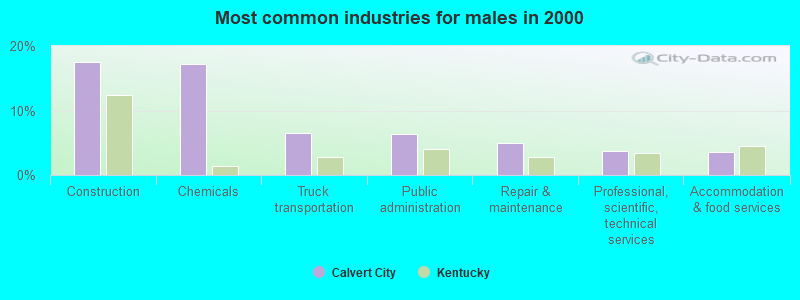
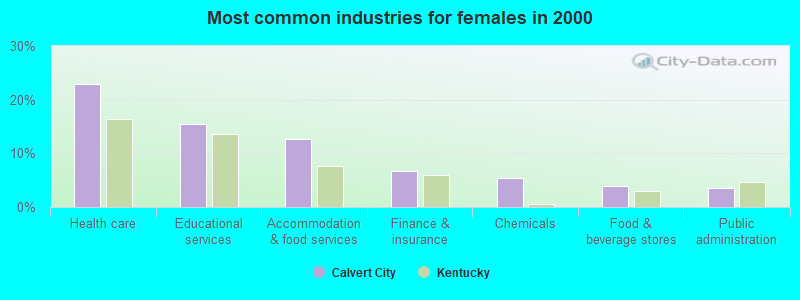
Most common industries
Most common industries | |||
|---|---|---|---|
Industry | All | Males | Females |
| Chemicals | 11.9% (155) | 17.2% (123) | 5.4% (32) |
| Health care | 11.4% (149) | 2.0% (14) | 23.0% (135) |
| Construction | 10.3% (134) | 17.5% (125) | 1.5% (9) |
| Educational services | 8.0% (104) | 1.8% (13) | 15.5% (91) |
| Accommodation and food services | 7.7% (100) | 3.5% (25) | 12.8% (75) |
| Public administration | 5.1% (67) | 6.4% (46) | 3.6% (21) |
| Finance and insurance | 4.3% (56) | 2.2% (16) | 6.8% (40) |
| Truck transportation | 3.9% (51) | 6.6% (47) | 0.7% (4) |
| Professional, scientific, and technical services | 2.9% (38) | 3.8% (27) | 1.9% (11) |
| Repair and maintenance | 2.7% (35) | 4.9% (35) | 0.0% (0) |
| Utilities | 2.5% (32) | 3.1% (22) | 1.7% (10) |
| Administrative and support and waste management services | 2.1% (28) | 2.5% (18) | 1.7% (10) |
| Religious, grantmaking, civic, professional, and similar organizations | 2.1% (27) | 3.2% (23) | 0.7% (4) |
| Food and beverage stores | 1.8% (23) | 0.0% (0) | 3.9% (23) |
| Plastics and rubber products | 1.8% (23) | 2.5% (18) | 0.9% (5) |
| Arts, entertainment, and recreation | 1.4% (18) | 0.7% (5) | 2.2% (13) |
| Publishing, and motion picture and sound recording industries | 1.4% (18) | 2.0% (14) | 0.7% (4) |
| Department and other general merchandise stores | 1.2% (16) | 0.7% (5) | 1.9% (11) |
| Social assistance | 1.1% (14) | 0.0% (0) | 2.4% (14) |
| Metal and metal products | 0.8% (11) | 1.0% (7) | 0.7% (4) |
| Personal and laundry services | 0.8% (10) | 0.6% (4) | 1.0% (6) |
| Machinery, equipment, and supplies merchant wholesalers | 0.8% (10) | 1.4% (10) | 0.0% (0) |
| Wood products | 0.8% (10) | 1.4% (10) | 0.0% (0) |
| Building material and garden equipment and supplies dealers | 0.7% (9) | 1.3% (9) | 0.0% (0) |
| Used merchandise, gift, novelty, and souvenir, and other miscellaneous stores | 0.7% (9) | 1.3% (9) | 0.0% (0) |
| Food | 0.7% (9) | 1.3% (9) | 0.0% (0) |
| Broadcasting and telecommunications | 0.7% (9) | 0.0% (0) | 1.5% (9) |
| Recyclable material merchant wholesalers | 0.7% (9) | 1.3% (9) | 0.0% (0) |
| Motor vehicle and parts dealers | 0.7% (9) | 0.7% (5) | 0.7% (4) |
| Miscellaneous manufacturing | 0.6% (8) | 0.7% (5) | 0.5% (3) |
| Clothing and accessories, including shoe, stores | 0.6% (8) | 0.7% (5) | 0.5% (3) |
| Water transportation | 0.6% (8) | 1.1% (8) | 0.0% (0) |
| U. S. Postal service | 0.6% (8) | 0.0% (0) | 1.4% (8) |
| Electrical and electronic goods merchant wholesalers | 0.6% (8) | 0.7% (5) | 0.5% (3) |
| Mining, quarrying, and oil and gas extraction | 0.5% (7) | 0.7% (5) | 0.3% (2) |
| Jewelry, luggage, and leather goods stores | 0.5% (7) | 0.3% (2) | 0.9% (5) |
| Other direct selling establishments | 0.5% (7) | 0.4% (3) | 0.7% (4) |
| Printing and related support activities | 0.5% (6) | 0.8% (6) | 0.0% (0) |
| Machinery | 0.5% (6) | 0.0% (0) | 1.0% (6) |
| Miscellaneous nondurable goods merchant wholesalers | 0.5% (6) | 0.8% (6) | 0.0% (0) |
| Real estate and rental and leasing | 0.5% (6) | 0.8% (6) | 0.0% (0) |
| Drugs, sundries, and chemical and allied products merchant wholesalers | 0.4% (5) | 0.0% (0) | 0.9% (5) |
| Retail florists | 0.3% (4) | 0.6% (4) | 0.0% (0) |
| Furniture and home furnishing merchant wholesalers | 0.3% (4) | 0.6% (4) | 0.0% (0) |
| Health and personal care, except drug, stores | 0.3% (4) | 0.0% (0) | 0.7% (4) |
| Electrical equipment, appliances, and components | 0.3% (4) | 0.0% (0) | 0.7% (4) |
| Agriculture, forestry, fishing and hunting | 0.2% (3) | 0.4% (3) | 0.0% (0) |
| Furniture and home furnishings, and household appliance stores | 0.2% (3) | 0.0% (0) | 0.5% (3) |
| Rail transportation | 0.2% (3) | 0.0% (0) | 0.5% (3) |
| Other transportation, and support activities, and couriers | 0.2% (3) | 0.4% (3) | 0.0% (0) |
| Miscellaneous durable goods merchant wholesalers | 0.2% (3) | 0.4% (3) | 0.0% (0) |
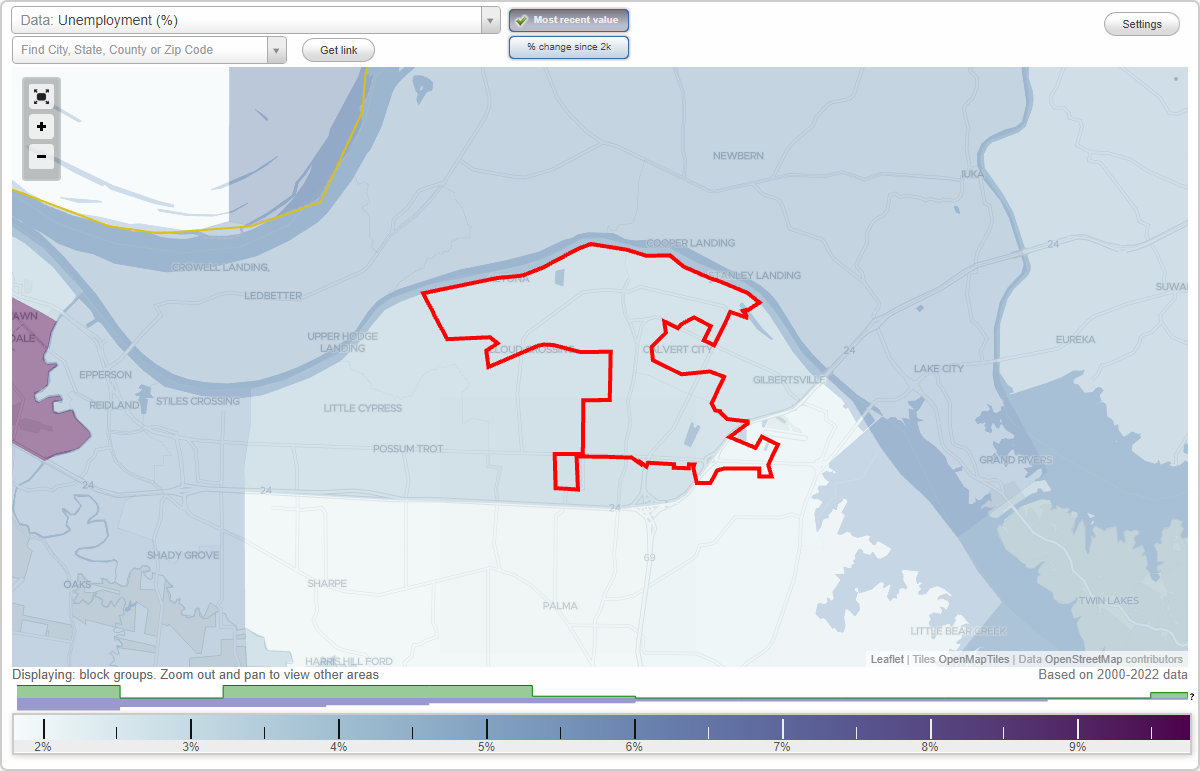
Unemployment in Calvert City
- Unemployment by race in 2022
- Unemployment rate for White non-Hispanic residents
- 3.9%Males
- 1.9%Females
- Unemployment rate for American Indian and Alaska Native residents
- 100.0%Males
- Unemployment rate for two or more race residents
- 100.0%Females
- Unemployment by race in 2000
- Unemployment rate for White non-Hispanic residents
- 7.5%Males
- 8.4%Females
Time leaving home to go to work
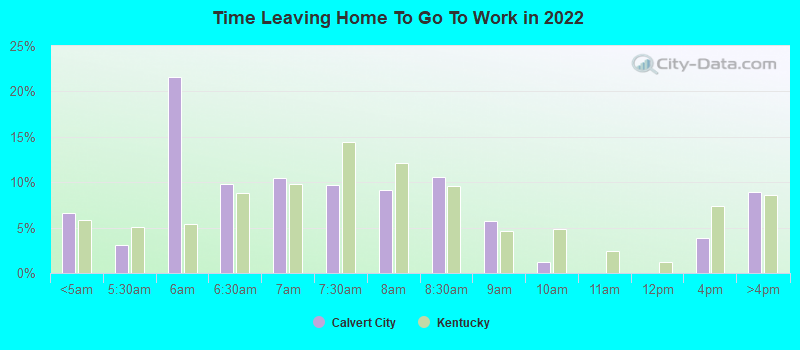
12:00 a.m. to 4:59 a.m.:
| Calvert City: | 6.6% (75) |
| Kentucky: | 5.8% (106,411) |
5:00 a.m. to 5:29 a.m.:
| Calvert City: | 3.0% (34) |
| Kentucky: | 5.0% (91,562) |
5:30 a.m. to 5:59 a.m.:
| Calvert City: | 21.6% (245) |
| Kentucky: | 5.4% (97,792) |
6:00 a.m. to 6:29 a.m.:
| Calvert City: | 9.9% (112) |
| Kentucky: | 8.8% (160,781) |
6:30 a.m. to 6:59 a.m.:
| Calvert City: | 10.5% (119) |
| Kentucky: | 9.8% (177,898) |
7:00 a.m. to 7:29 a.m.:
| Calvert City: | 9.7% (110) |
| Kentucky: | 14.4% (262,079) |
7:30 a.m. to 7:59 a.m.:
| Calvert City: | 9.2% (104) |
| Kentucky: | 12.2% (221,546) |
8:00 a.m. to 8:29 a.m.:
| Calvert City: | 10.6% (120) |
| Kentucky: | 9.6% (174,071) |
8:30 a.m. to 8:59 a.m.:
| Calvert City: | 5.7% (64) |
| Kentucky: | 4.6% (84,129) |
9:00 a.m. to 9:59 a.m.:
| Calvert City: | 1.2% (14) |
| Kentucky: | 4.9% (88,917) |
12:00 p.m. to 3:59 p.m.:
| Calvert City: | 3.9% (44) |
| Kentucky: | 7.4% (134,033) |
4:00 p.m. to 11:59 p.m.:
| Calvert City: | 8.9% (101) |
| Kentucky: | 8.6% (156,276) |
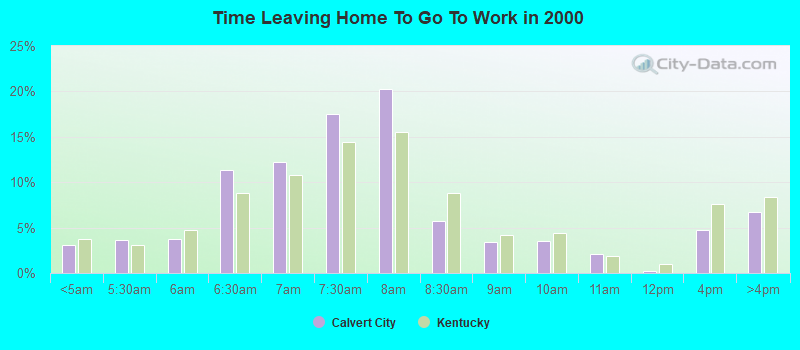
<5am:
| Calvert City: | 3.1% (39) |
| Kentucky: | 3.7% (65,918) |
5:30am:
| Calvert City: | 3.6% (46) |
| Kentucky: | 3.1% (55,792) |
6am:
| Calvert City: | 3.8% (48) |
| Kentucky: | 4.7% (84,161) |
6:30am:
| Calvert City: | 11.3% (144) |
| Kentucky: | 8.8% (156,072) |
7am:
| Calvert City: | 12.3% (156) |
| Kentucky: | 10.8% (191,924) |
7:30am:
| Calvert City: | 17.5% (223) |
| Kentucky: | 14.4% (256,256) |
8am:
| Calvert City: | 20.3% (258) |
| Kentucky: | 15.6% (277,275) |
8:30am:
| Calvert City: | 5.7% (73) |
| Kentucky: | 8.8% (156,855) |
9am:
| Calvert City: | 3.4% (43) |
| Kentucky: | 4.2% (75,532) |
10am:
| Calvert City: | 3.5% (45) |
| Kentucky: | 4.4% (77,954) |
11am:
| Calvert City: | 2.0% (26) |
| Kentucky: | 1.9% (33,406) |
12pm:
| Calvert City: | 0.2% (3) |
| Kentucky: | 1.0% (17,303) |
4pm:
| Calvert City: | 4.7% (60) |
| Kentucky: | 7.6% (135,045) |
>4pm:
| Calvert City: | 6.8% (86) |
| Kentucky: | 8.4% (150,096) |
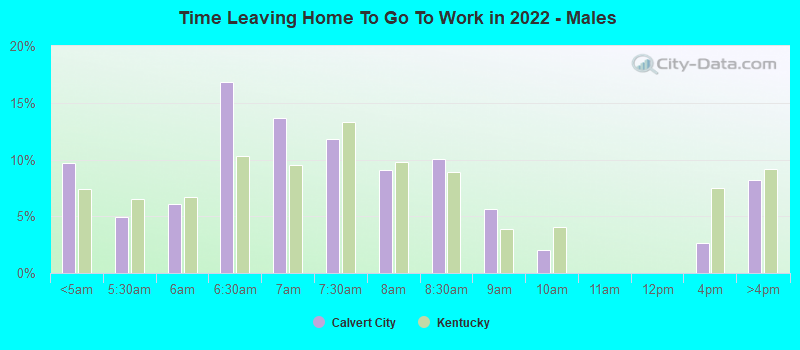
12:00 a.m. to 4:59 a.m. - Males:
| Calvert City: | 9.7% (51) |
| Kentucky: | 7.4% (72,814) |
5:00 a.m. to 5:29 a.m. - Males:
| Calvert City: | 4.9% (26) |
| Kentucky: | 6.5% (63,906) |
5:30 a.m. to 5:59 a.m. - Males:
| Calvert City: | 6.1% (32) |
| Kentucky: | 6.7% (65,195) |
6:00 a.m. to 6:29 a.m. - Males:
| Calvert City: | 16.8% (89) |
| Kentucky: | 10.3% (101,417) |
6:30 a.m. to 6:59 a.m. - Males:
| Calvert City: | 13.6% (72) |
| Kentucky: | 9.5% (93,068) |
7:00 a.m. to 7:29 a.m. - Males:
| Calvert City: | 11.8% (62) |
| Kentucky: | 13.3% (130,226) |
7:30 a.m. to 7:59 a.m. - Males:
| Calvert City: | 9.1% (48) |
| Kentucky: | 9.8% (95,903) |
8:00 a.m. to 8:29 a.m. - Males:
| Calvert City: | 10.0% (53) |
| Kentucky: | 8.9% (86,957) |
8:30 a.m. to 8:59 a.m. - Males:
| Calvert City: | 5.6% (30) |
| Kentucky: | 3.9% (38,346) |
9:00 a.m. to 9:59 a.m. - Males:
| Calvert City: | 2.0% (11) |
| Kentucky: | 4.0% (39,548) |
12:00 p.m. to 3:59 p.m. - Males:
| Calvert City: | 2.6% (14) |
| Kentucky: | 7.5% (73,140) |
4:00 p.m. to 11:59 p.m. - Males:
| Calvert City: | 8.2% (43) |
| Kentucky: | 9.1% (89,441) |
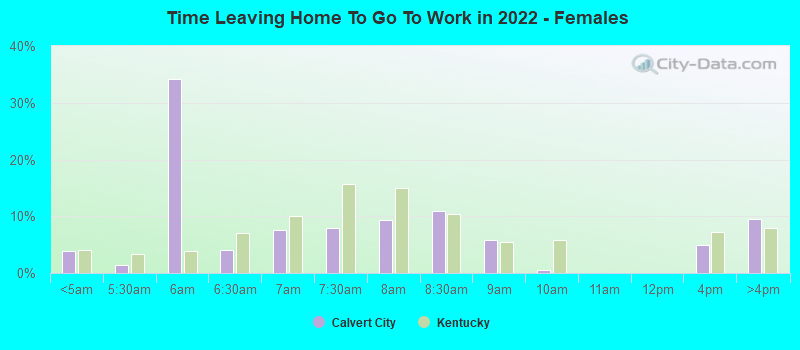
12:00 a.m. to 4:59 a.m. - Females:
| Calvert City: | 3.9% (23) |
| Kentucky: | 4.0% (33,597) |
5:00 a.m. to 5:29 a.m. - Females:
| Calvert City: | 1.4% (9) |
| Kentucky: | 3.3% (27,656) |
5:30 a.m. to 5:59 a.m. - Females:
| Calvert City: | 34.2% (206) |
| Kentucky: | 3.9% (32,597) |
6:00 a.m. to 6:29 a.m. - Females:
| Calvert City: | 4.1% (25) |
| Kentucky: | 7.1% (59,364) |
6:30 a.m. to 6:59 a.m. - Females:
| Calvert City: | 7.6% (46) |
| Kentucky: | 10.1% (84,830) |
7:00 a.m. to 7:29 a.m. - Females:
| Calvert City: | 7.9% (48) |
| Kentucky: | 15.7% (131,853) |
7:30 a.m. to 7:59 a.m. - Females:
| Calvert City: | 9.3% (56) |
| Kentucky: | 14.9% (125,643) |
8:00 a.m. to 8:29 a.m. - Females:
| Calvert City: | 11.0% (66) |
| Kentucky: | 10.3% (87,114) |
8:30 a.m. to 8:59 a.m. - Females:
| Calvert City: | 5.7% (35) |
| Kentucky: | 5.4% (45,783) |
9:00 a.m. to 9:59 a.m. - Females:
| Calvert City: | 0.5% (3) |
| Kentucky: | 5.9% (49,369) |
12:00 p.m. to 3:59 p.m. - Females:
| Calvert City: | 5.0% (30) |
| Kentucky: | 7.2% (60,893) |
4:00 p.m. to 11:59 p.m. - Females:
| Calvert City: | 9.4% (57) |
| Kentucky: | 7.9% (66,835) |
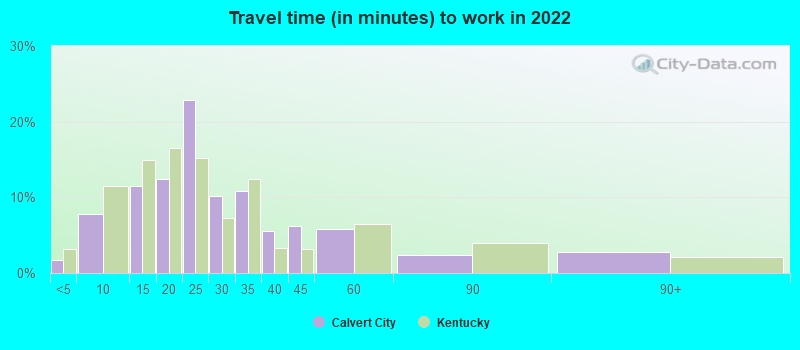
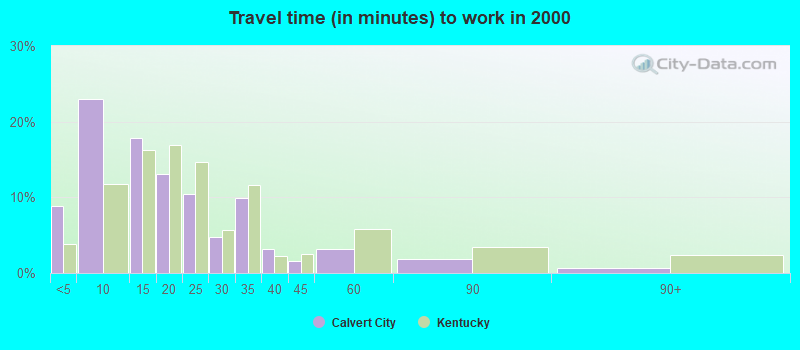
Travel time to work
Percentage of workers working in this county: 61.9%
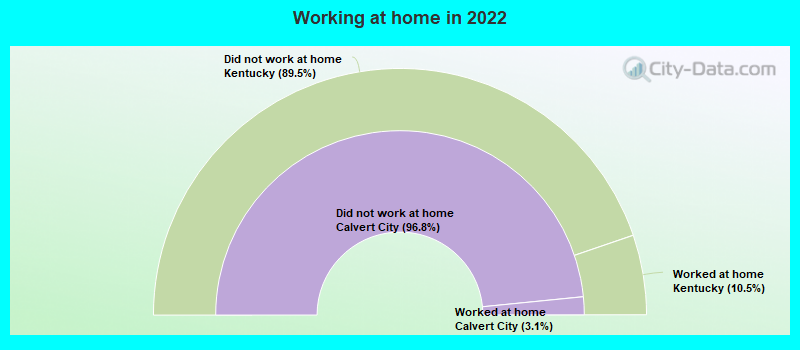
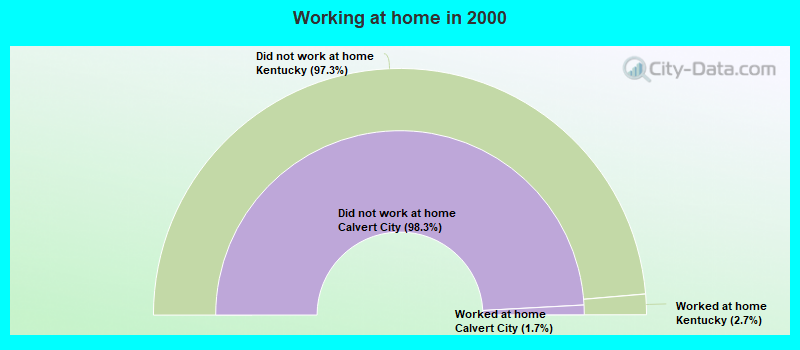
Number of people working at home: 28 (2.4% of all workers)
Daytime population change due to commuting: +2,584 (+95.7%)
Workers who live and work in this city: 489 (38.4%)
Number of people working at home: 28 (2.4% of all workers)
Daytime population change due to commuting: +2,584 (+95.7%)
Workers who live and work in this city: 489 (38.4%)
Less than 5 minutes:
| Calvert City: | 1.7% (75) |
| Kentucky: | 3.1% (57,124) |
5 to 9 minutes:
| Calvert City: | 7.9% (349) |
| Kentucky: | 11.5% (211,437) |
10 to 14 minutes:
| Calvert City: | 11.5% (513) |
| Kentucky: | 14.9% (273,865) |
15 to 19 minutes:
| Calvert City: | 12.5% (554) |
| Kentucky: | 16.5% (303,998) |
20 to 24 minutes:
| Calvert City: | 22.9% (1,019) |
| Kentucky: | 15.2% (279,854) |
25 to 29 minutes:
| Calvert City: | 10.1% (451) |
| Kentucky: | 7.3% (134,451) |
30 to 34 minutes:
| Calvert City: | 10.9% (485) |
| Kentucky: | 12.4% (227,363) |
35 to 39 minutes:
| Calvert City: | 5.6% (247) |
| Kentucky: | 3.3% (60,017) |
40 to 44 minutes:
| Calvert City: | 6.2% (277) |
| Kentucky: | 3.1% (57,367) |
45 to 59 minutes:
| Calvert City: | 5.8% (256) |
| Kentucky: | 6.4% (118,008) |
60 to 89 minutes:
| Calvert City: | 2.4% (108) |
| Kentucky: | 4.0% (73,723) |
90 or more minutes:
| Calvert City: | 2.7% (121) |
| Kentucky: | 2.2% (40,026) |
Less than 5 minutes:
| Calvert City: | 8.8% (112) |
| Kentucky: | 3.8% (67,210) |
5 to 9 minutes:
| Calvert City: | 23.0% (292) |
| Kentucky: | 11.8% (210,440) |
10 to 14 minutes:
| Calvert City: | 17.8% (227) |
| Kentucky: | 16.3% (290,128) |
15 to 19 minutes:
| Calvert City: | 13.1% (166) |
| Kentucky: | 16.9% (301,009) |
20 to 24 minutes:
| Calvert City: | 10.5% (133) |
| Kentucky: | 14.7% (262,418) |
25 to 29 minutes:
| Calvert City: | 4.7% (60) |
| Kentucky: | 5.7% (101,130) |
30 to 34 minutes:
| Calvert City: | 9.9% (126) |
| Kentucky: | 11.7% (208,362) |
35 to 39 minutes:
| Calvert City: | 3.2% (41) |
| Kentucky: | 2.3% (40,576) |
40 to 44 minutes:
| Calvert City: | 1.7% (21) |
| Kentucky: | 2.5% (44,172) |
45 to 59 minutes:
| Calvert City: | 3.1% (40) |
| Kentucky: | 5.8% (102,842) |
60 to 89 minutes:
| Calvert City: | 1.9% (24) |
| Kentucky: | 3.5% (61,841) |
90 or more minutes:
| Calvert City: | 0.6% (8) |
| Kentucky: | 2.4% (43,461) |
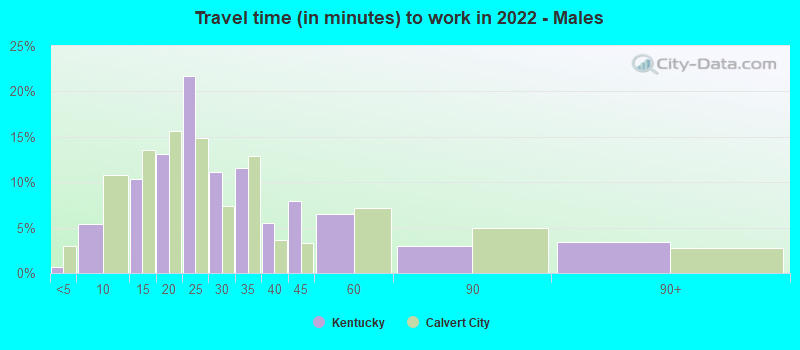
Less than 5 minutes - Males:
| Calvert City: | 0.7% (23) |
| Kentucky: | 3.0% (29,563) |
5 to 9 minutes - Males:
| Calvert City: | 5.4% (187) |
| Kentucky: | 10.8% (107,031) |
10 to 14 minutes - Males:
| Calvert City: | 10.4% (360) |
| Kentucky: | 13.6% (134,403) |
15 to 19 minutes - Males:
| Calvert City: | 13.1% (455) |
| Kentucky: | 15.7% (155,170) |
20 to 24 minutes - Males:
| Calvert City: | 21.7% (752) |
| Kentucky: | 14.9% (147,466) |
25 to 29 minutes - Males:
| Calvert City: | 11.1% (385) |
| Kentucky: | 7.4% (73,585) |
30 to 34 minutes - Males:
| Calvert City: | 11.6% (400) |
| Kentucky: | 12.9% (128,210) |
35 to 39 minutes - Males:
| Calvert City: | 5.5% (191) |
| Kentucky: | 3.6% (35,629) |
40 to 44 minutes - Males:
| Calvert City: | 7.9% (275) |
| Kentucky: | 3.3% (33,123) |
45 to 59 minutes - Males:
| Calvert City: | 6.5% (223) |
| Kentucky: | 7.2% (70,995) |
60 to 89 minutes - Males:
| Calvert City: | 3.0% (104) |
| Kentucky: | 4.9% (48,643) |
90 or more minutes - Males:
| Calvert City: | 3.4% (117) |
| Kentucky: | 2.8% (27,585) |
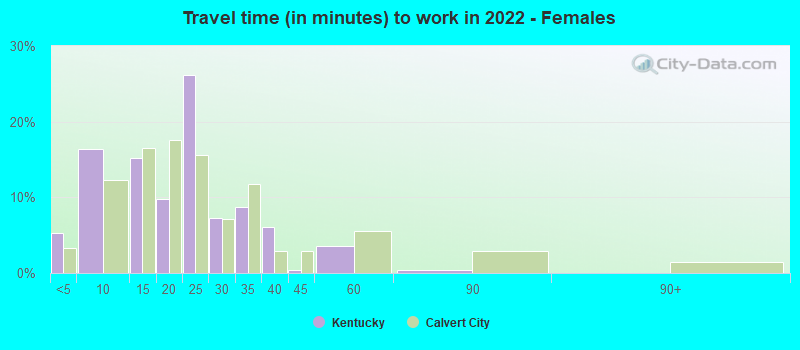
Less than 5 minutes - Females:
| Calvert City: | 5.3% (53) |
| Kentucky: | 3.3% (27,561) |
5 to 9 minutes - Females:
| Calvert City: | 16.4% (163) |
| Kentucky: | 12.3% (104,406) |
10 to 14 minutes - Females:
| Calvert City: | 15.3% (151) |
| Kentucky: | 16.5% (139,462) |
15 to 19 minutes - Females:
| Calvert City: | 9.8% (98) |
| Kentucky: | 17.6% (148,828) |
20 to 24 minutes - Females:
| Calvert City: | 26.2% (260) |
| Kentucky: | 15.7% (132,388) |
25 to 29 minutes - Females:
| Calvert City: | 7.3% (72) |
| Kentucky: | 7.2% (60,866) |
30 to 34 minutes - Females:
| Calvert City: | 8.7% (87) |
| Kentucky: | 11.7% (99,153) |
35 to 39 minutes - Females:
| Calvert City: | 6.1% (61) |
| Kentucky: | 2.9% (24,388) |
40 to 44 minutes - Females:
| Calvert City: | 0.4% (4) |
| Kentucky: | 2.9% (24,244) |
45 to 59 minutes - Females:
| Calvert City: | 3.5% (35) |
| Kentucky: | 5.6% (47,013) |
60 to 89 minutes - Females:
| Calvert City: | 0.4% (4) |
| Kentucky: | 3.0% (25,080) |
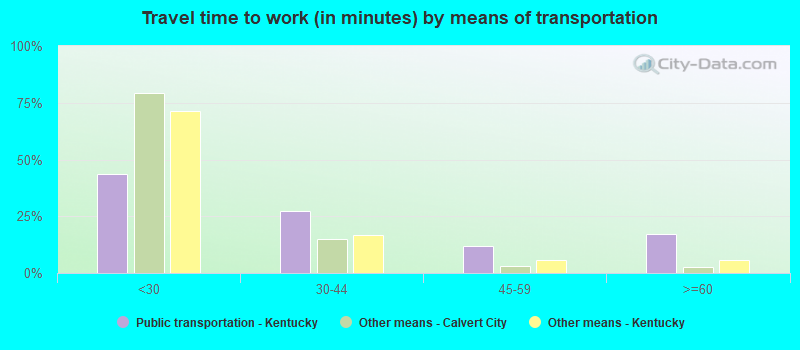
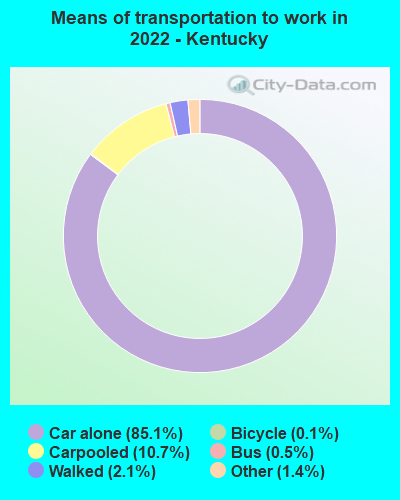
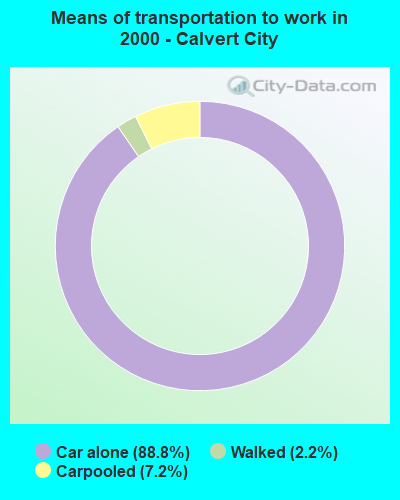
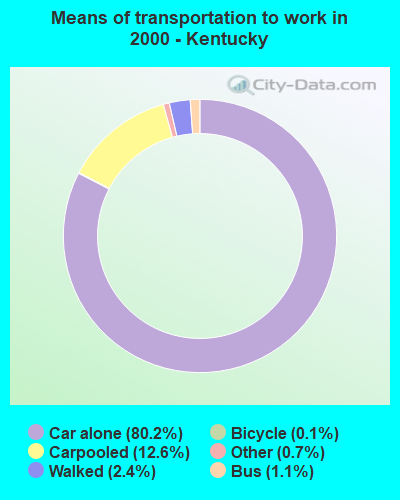
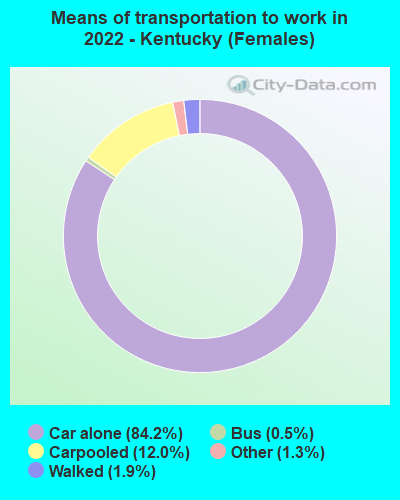
Means of transportation to work
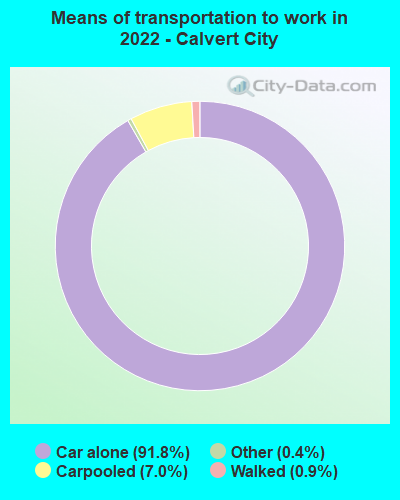
Drove car alone:
| Calvert City: | 91.8% (4,194) |
| Kentucky: | 85.1% (712,348) |
Carpooled:
| Calvert City: | 7.0% (318) |
| Kentucky: | 10.7% (101,769) |
Walked:
| Calvert City: | 0.9% (41) |
| Kentucky: | 2.1% (15,962) |
Other means:
| Calvert City: | 0.4% (16) |
| Kentucky: | 1.4% (10,693) |
Drove car alone:
| Calvert City: | 88.8% (1,130) |
| Kentucky: | 80.2% (1,429,053) |
Carpooled:
| Calvert City: | 7.2% (92) |
| Kentucky: | 12.6% (224,643) |
Walked:
| Calvert City: | 2.2% (28) |
| Kentucky: | 2.4% (42,494) |
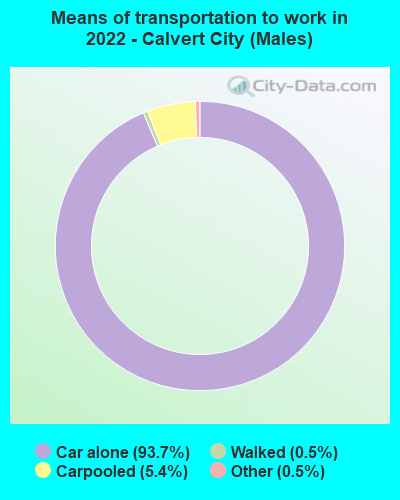

Drove car alone - Males:
| Calvert City: | 93.7% (3,305) |
| Kentucky: | 85.8% (712,348) |
Carpooled - Males:
| Calvert City: | 5.4% (190) |
| Kentucky: | 9.6% (101,769) |
Walked - Males:
| Calvert City: | 0.5% (16) |
| Kentucky: | 2.4% (15,962) |
Other means - Males:
| Calvert City: | 0.5% (16) |
| Kentucky: | 1.5% (10,693) |
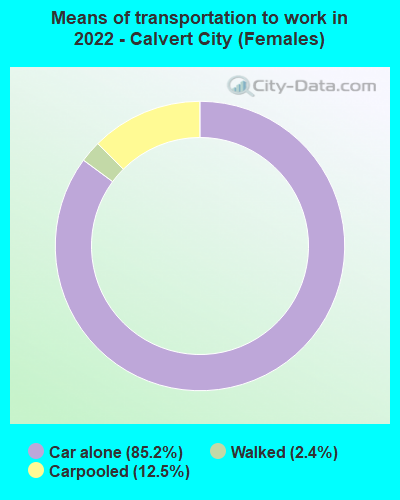
Drove car alone - Females:
| Calvert City: | 85.2% (877) |
| Kentucky: | 84.2% (712,348) |
Carpooled - Females:
| Calvert City: | 12.5% (128) |
| Kentucky: | 12.0% (101,769) |
Walked - Females:
| Calvert City: | 2.4% (25) |
| Kentucky: | 1.9% (15,962) |
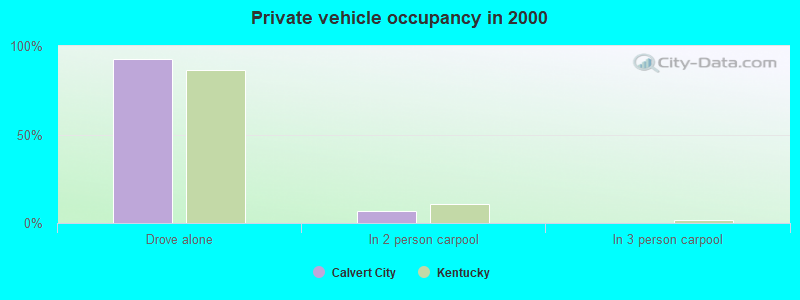
Private vehicle occupancy

Drove alone:
| Calvert City: | 91.1% (1,027) |
| Kentucky: | 88.5% (1,545,744) |
In 2 person carpool:
| Calvert City: | 7.4% (84) |
| Kentucky: | 9.0% (157,727) |
In 3 person carpool:
| Calvert City: | 0.6% (7) |
| Kentucky: | 1.6% (28,081) |
In 7+ person carpool:
| Calvert City: | 0.4% (5) |
| Kentucky: | 0.1% (1,947) |
Drove alone:
| Calvert City: | 92.5% (1,130) |
| Kentucky: | 86.4% (1,429,053) |
In 2 person carpool:
| Calvert City: | 7.0% (85) |
| Kentucky: | 10.8% (178,387) |
In 3 person carpool:
| Calvert City: | 0.2% (2) |
| Kentucky: | 1.8% (30,156) |
In 7+ person carpool:
| Calvert City: | 0.4% (5) |
| Kentucky: | 0.1% (2,116) |
Class of workers
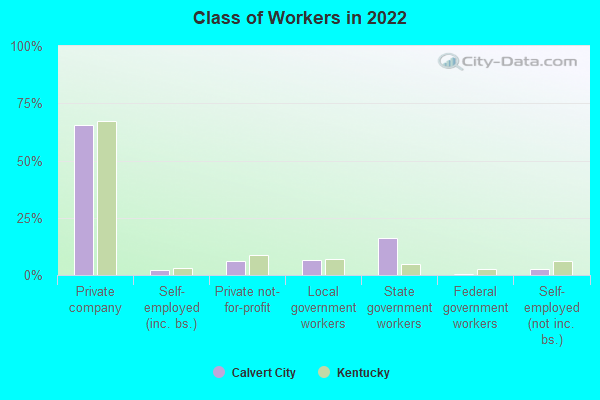
Employee of private company:
| Calvert City: | 65.7% (799) |
| Kentucky: | 67.2% (1,385,496) |
Self-employed in own incorporated business:
| Calvert City: | 2.3% (27) |
| Kentucky: | 3.1% (63,067) |
Private not-for-profit wage and salary workers:
| Calvert City: | 6.2% (75) |
| Kentucky: | 8.9% (184,048) |
Local government workers:
| Calvert City: | 6.5% (79) |
| Kentucky: | 7.1% (147,000) |
State government workers:
| Calvert City: | 16.3% (198) |
| Kentucky: | 4.9% (100,503) |
Federal government workers:
| Calvert City: | 0.4% (5) |
| Kentucky: | 2.6% (53,473) |
Self-employed workers in own not incorporated business:
| Calvert City: | 2.6% (32) |
| Kentucky: | 6.0% (123,667) |
Employee of private company:
| Calvert City: | 67.7% (883) |
| Kentucky: | 68.7% (1,235,989) |
Self-employed in own incorporated business:
| Calvert City: | 4.2% (55) |
| Kentucky: | 3.0% (53,084) |
Private not-for-profit wage and salary workers:
| Calvert City: | 5.5% (72) |
| Kentucky: | 6.8% (121,764) |
Local government workers:
| Calvert City: | 6.7% (87) |
| Kentucky: | 5.6% (100,920) |
State government workers:
| Calvert City: | 9.0% (117) |
| Kentucky: | 6.4% (114,791) |
Federal government workers:
| Calvert City: | 1.6% (21) |
| Kentucky: | 2.5% (44,072) |
Self-employed workers in own not incorporated business:
| Calvert City: | 4.4% (57) |
| Kentucky: | 6.7% (120,288) |
Unpaid family workers:
| Calvert City: | 0.9% (12) |
| Kentucky: | 0.4% (7,356) |
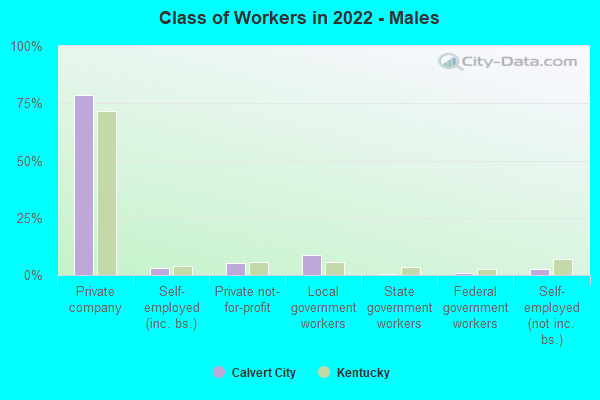
Employee of private company - Males:
| Calvert City: | 78.8% (442) |
| Kentucky: | 71.5% (773,461) |
Self-employed in own incorporated business - Males:
| Calvert City: | 3.3% (18) |
| Kentucky: | 3.7% (40,392) |
Private not-for-profit wage and salary workers - Males:
| Calvert City: | 5.4% (31) |
| Kentucky: | 5.7% (61,487) |
Local government workers - Males:
| Calvert City: | 8.5% (48) |
| Kentucky: | 5.5% (59,107) |
State government workers - Males:
| Calvert City: | 0.5% (3) |
| Kentucky: | 3.6% (38,667) |
Federal government workers - Males:
| Calvert City: | 0.9% (5) |
| Kentucky: | 2.8% (30,519) |
Self-employed workers in own not incorporated business - Males:
| Calvert City: | 2.5% (14) |
| Kentucky: | 7.1% (76,456) |
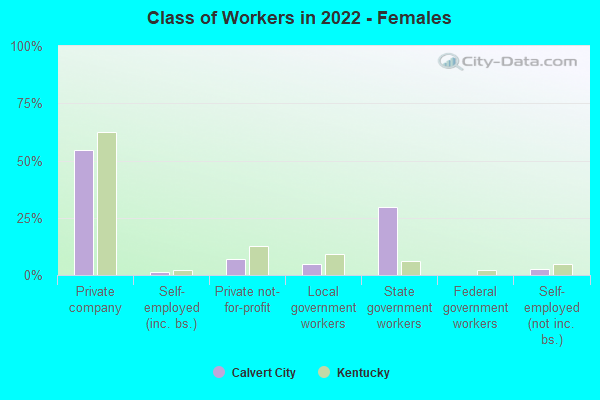
Employee of private company - Females:
| Calvert City: | 54.5% (357) |
| Kentucky: | 62.5% (612,035) |
Self-employed in own incorporated business - Females:
| Calvert City: | 1.4% (9) |
| Kentucky: | 2.3% (22,675) |
Private not-for-profit wage and salary workers - Females:
| Calvert City: | 6.8% (45) |
| Kentucky: | 12.5% (122,561) |
Local government workers - Females:
| Calvert City: | 4.8% (32) |
| Kentucky: | 9.0% (87,893) |
State government workers - Females:
| Calvert City: | 29.8% (195) |
| Kentucky: | 6.3% (61,836) |
Self-employed workers in own not incorporated business - Females:
| Calvert City: | 2.6% (17) |
| Kentucky: | 4.8% (47,211) |