Work and Jobs in DeSoto, Texas (TX) Detailed Stats
Occupations, Industries, Unemployment, Workers, Commute
Settings
X


Recent posts about work in DeSoto, Texas on our local forum with over 2,400,000 registered users:
 | Carrollton/West Plano Custom Home (98 replies) |
| Affordable Housing : Winds of change in Plano (45 replies) |
| HEB announces Plano and Frisco stores (100 replies) |
| Prosperous Black Family Moving to Dallas (52 replies) |
| relocating from Ireland to Dallas (49 replies) |
| Is Texas Right for Us? (48 replies) |
Latest news about work in DeSoto, TX collected exclusively by city-data.com from local newspapers, TV, and radio stations
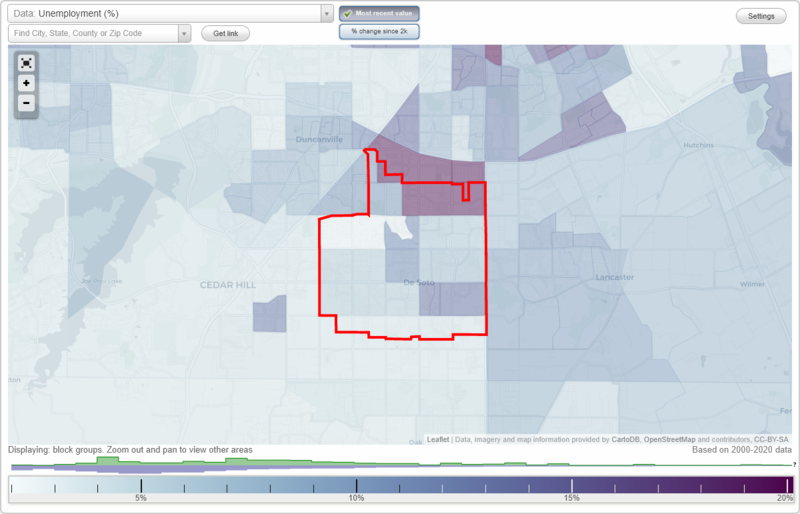
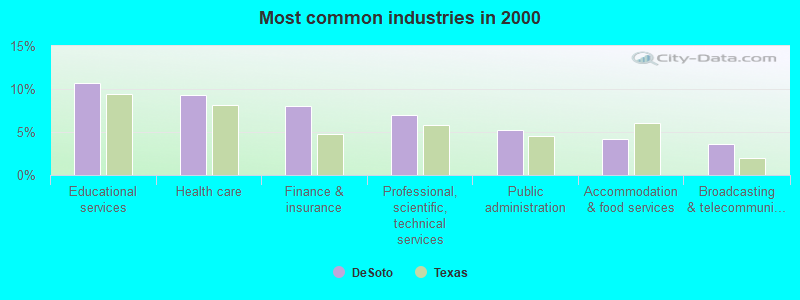
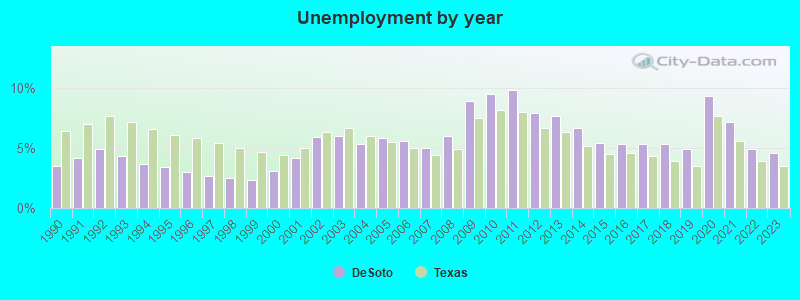
The unemployment rate in 2023 in DeSoto, TX was 4.6%, which was 23.9% greater than the unemployment rate of 3.5% across the entire state of Texas. Compared to the unemployment rate of 7.7% in 2013, this represents a decrease of 67.4%. The most common industries in DeSoto are: Educational services (10.7% of civilian employees), Health care (9.3% of civilian employees), Finance & insurance (8.0% of civilian employees). 83.3% of workers work in Dallas County and 13.3% of all workers work at home. 64.6% of workers are employees of private companies, which is 7.7% less than the rate of 69.6% across the entire state of Texas.
Whole page based on the data from 2000 / 2022 when the population of DeSoto, Texas was 37,646 / 55,813
Whole page based on the data from 2000 / 2022 when the population of DeSoto, Texas was 37,646 / 55,813
Most common industries
Most common industries | |||
|---|---|---|---|
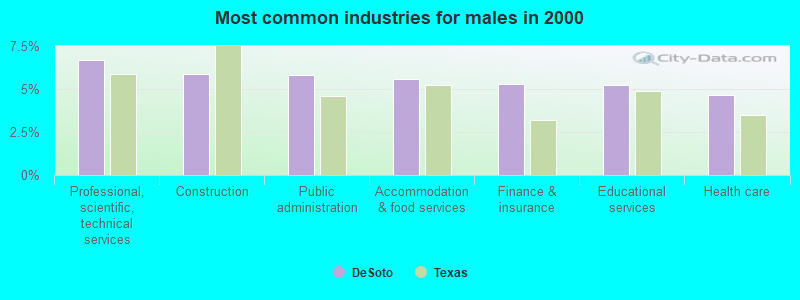
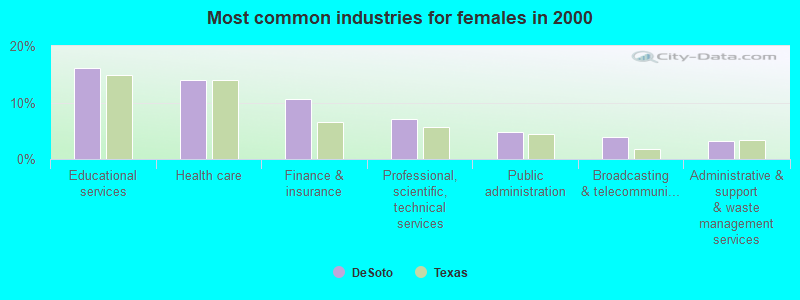
Industry | All | Males | Females |
| Educational services | 10.7% (2,102) | 5.3% (514) | 16.0% (1,588) |
| Health care | 9.3% (1,839) | 4.7% (455) | 14.0% (1,384) |
| Finance and insurance | 8.0% (1,575) | 5.3% (520) | 10.6% (1,055) |
| Professional, scientific, and technical services | 6.9% (1,366) | 6.7% (656) | 7.2% (710) |
| Public administration | 5.3% (1,041) | 5.8% (571) | 4.7% (470) |
| Accommodation and food services | 4.2% (820) | 5.6% (545) | 2.8% (275) |
| Broadcasting and telecommunications | 3.6% (712) | 3.4% (332) | 3.8% (380) |
| Construction | 3.4% (677) | 5.9% (576) | 1.0% (101) |
| Administrative and support and waste management services | 3.0% (589) | 2.8% (275) | 3.2% (314) |
| Real estate and rental and leasing | 2.9% (566) | 2.7% (267) | 3.0% (299) |
| Religious, grantmaking, civic, professional, and similar organizations | 2.6% (504) | 2.6% (254) | 2.5% (250) |
| Truck transportation | 2.3% (460) | 4.1% (398) | 0.6% (62) |
| Other transportation, and support activities, and couriers | 2.1% (407) | 2.9% (287) | 1.2% (120) |
| U. S. Postal service | 2.0% (397) | 2.7% (265) | 1.3% (132) |
| Personal and laundry services | 2.0% (389) | 1.4% (140) | 2.5% (249) |
| Food and beverage stores | 1.9% (382) | 1.9% (183) | 2.0% (199) |
| Social assistance | 1.7% (325) | 0.8% (75) | 2.5% (250) |
| Department and other general merchandise stores | 1.6% (322) | 1.5% (144) | 1.8% (178) |
| Transportation equipment | 1.3% (258) | 2.0% (191) | 0.7% (67) |
| Computer and electronic products | 1.3% (256) | 1.2% (122) | 1.4% (134) |
| Motor vehicle and parts dealers | 1.2% (242) | 2.1% (201) | 0.4% (41) |
| Miscellaneous manufacturing | 1.2% (242) | 1.6% (160) | 0.8% (82) |
| Utilities | 1.2% (234) | 1.7% (171) | 0.6% (63) |
| Repair and maintenance | 1.0% (204) | 1.9% (182) | 0.2% (22) |
| Machinery | 1.0% (202) | 1.7% (167) | 0.4% (35) |
| Printing and related support activities | 1.0% (200) | 1.4% (137) | 0.6% (63) |
| Metal and metal products | 0.9% (181) | 1.7% (162) | 0.2% (19) |
| Air transportation | 0.9% (174) | 0.9% (92) | 0.8% (82) |
| Groceries and related products merchant wholesalers | 0.8% (167) | 1.1% (110) | 0.6% (57) |
| Arts, entertainment, and recreation | 0.7% (145) | 0.7% (68) | 0.8% (77) |
| Professional and commercial equipment and supplies merchant wholesalers | 0.7% (134) | 0.7% (72) | 0.6% (62) |
| Publishing, and motion picture and sound recording industries | 0.7% (132) | 0.6% (56) | 0.8% (76) |
| Food | 0.7% (131) | 0.8% (77) | 0.5% (54) |
| Mining, quarrying, and oil and gas extraction | 0.7% (128) | 0.7% (73) | 0.6% (55) |
| Clothing and accessories, including shoe, stores | 0.6% (118) | 0.5% (47) | 0.7% (71) |
| Plastics and rubber products | 0.6% (116) | 0.8% (83) | 0.3% (33) |
| Radio, TV, and computer stores | 0.5% (106) | 0.9% (90) | 0.2% (16) |
| Furniture and home furnishings, and household appliance stores | 0.5% (97) | 0.7% (65) | 0.3% (32) |
| Used merchandise, gift, novelty, and souvenir, and other miscellaneous stores | 0.5% (97) | 0.0% (0) | 1.0% (97) |
| Motor vehicles, parts and supplies merchant wholesalers | 0.5% (96) | 0.7% (68) | 0.3% (28) |
| Pharmacies and drug stores | 0.5% (91) | 0.3% (30) | 0.6% (61) |
| Electrical and electronic goods merchant wholesalers | 0.5% (90) | 0.8% (82) | 0.1% (8) |
| Building material and garden equipment and supplies dealers | 0.5% (90) | 0.8% (75) | 0.2% (15) |
| Chemicals | 0.4% (88) | 0.6% (63) | 0.3% (25) |
| Nonmetallic mineral products | 0.4% (86) | 0.9% (86) | 0.0% (0) |
| Data processing, libraries, and other information services | 0.4% (84) | 0.3% (26) | 0.6% (58) |
| Private households | 0.3% (65) | 0.0% (0) | 0.7% (65) |
| Warehousing and storage | 0.3% (63) | 0.5% (49) | 0.1% (14) |
| Miscellaneous durable goods merchant wholesalers | 0.3% (63) | 0.3% (25) | 0.4% (38) |
| Wood products | 0.3% (60) | 0.5% (48) | 0.1% (12) |
| Electrical equipment, appliances, and components | 0.3% (58) | 0.4% (35) | 0.2% (23) |
| Beverage and tobacco products | 0.3% (55) | 0.4% (35) | 0.2% (20) |
| Machinery, equipment, and supplies merchant wholesalers | 0.3% (55) | 0.6% (55) | 0.0% (0) |
| Paper | 0.3% (53) | 0.3% (32) | 0.2% (21) |
| Other direct selling establishments | 0.3% (53) | 0.3% (31) | 0.2% (22) |
| Electronic shopping and mail-order houses | 0.2% (44) | 0.3% (28) | 0.2% (16) |
| Petroleum and coal products | 0.2% (37) | 0.4% (37) | 0.0% (0) |
| Furniture and related product manufacturing | 0.2% (30) | 0.2% (20) | 0.1% (10) |
| Miscellaneous nondurable goods merchant wholesalers | 0.1% (29) | 0.2% (22) | 0.1% (7) |
| Jewelry, luggage, and leather goods stores | 0.1% (29) | 0.0% (0) | 0.3% (29) |
| Gasoline stations | 0.1% (28) | 0.1% (13) | 0.2% (15) |
| Metals and minerals, except petroleum, merchant wholesalers | 0.1% (28) | 0.2% (21) | 0.1% (7) |
| Drugs, sundries, and chemical and allied products merchant wholesalers | 0.1% (25) | 0.1% (13) | 0.1% (12) |
| Health and personal care, except drug, stores | 0.1% (22) | 0.1% (7) | 0.2% (15) |
| Recyclable material merchant wholesalers | 0.1% (22) | 0.1% (10) | 0.1% (12) |
| Sporting goods, camera, and hobby and toy stores | 0.1% (21) | 0.1% (14) | 0.1% (7) |
| Furniture and home furnishing merchant wholesalers | 0.1% (21) | 0.0% (0) | 0.2% (21) |
| Book stores and news dealers | 0.1% (10) | 0.1% (10) | 0.0% (0) |
Unemployment in DeSoto
- Unemployment by race in 2022
- Unemployment rate for White non-Hispanic residents
- 4.9%Females
- Unemployment rate for Black residents
- 9.7%Males
- 6.2%Females
- Unemployment rate for Asian residents
- 16.2%Males
- Unemployment rate for other race residents
- 1.2%Males
- Unemployment rate for two or more race residents
- 15.6%Males
- 1.2%Females
- Unemployment rate for Hispanic or Latino residents
- 9.0%Males
- Unemployment by race in 2000
- Unemployment rate for White non-Hispanic residents
- 2.6%Males
- 2.6%Females
- Unemployment rate for Black residents
- 5.2%Males
- 6.3%Females
- Unemployment rate for American Indian and Alaska Native residents
- 26.2%Males
- 13.3%Females
- Unemployment rate for other race residents
- 1.6%Males
- 10.0%Females
- Unemployment rate for two or more race residents
- 38.6%Males
- Unemployment rate for Hispanic or Latino residents
- 5.3%Males
- 6.6%Females
Unemployment in 2023:
| DeSoto: | 4.6% |
| Texas: | 3.5% |
Unemployment in 2022:
| DeSoto: | 4.9% |
| Texas: | 3.9% |
Unemployment in 2021:
| DeSoto: | 7.2% |
| Texas: | 5.6% |
Unemployment in 2020:
| DeSoto: | 9.3% |
| Texas: | 7.7% |
Unemployment in 2019:
| DeSoto: | 4.9% |
| Texas: | 3.5% |
Unemployment in 2018:
| DeSoto: | 5.3% |
| Texas: | 3.9% |
Unemployment in 2017:
| DeSoto: | 5.3% |
| Texas: | 4.3% |
Unemployment in 2016:
| DeSoto: | 5.3% |
| Texas: | 4.6% |
Unemployment in 2015:
| DeSoto: | 5.4% |
| Texas: | 4.5% |
Unemployment in 2014:
| DeSoto: | 6.7% |
| Texas: | 5.2% |
Unemployment in 2013:
| DeSoto: | 7.7% |
| Texas: | 6.3% |
Unemployment in 2012:
| DeSoto: | 7.9% |
| Texas: | 6.7% |
Unemployment in 2011:
| DeSoto: | 9.8% |
| Texas: | 8.0% |
Unemployment in 2010:
| DeSoto: | 9.5% |
| Texas: | 8.2% |
Unemployment in 2009:
| DeSoto: | 8.9% |
| Texas: | 7.5% |
Unemployment in 2008:
| DeSoto: | 6.0% |
| Texas: | 4.9% |
Unemployment in 2007:
| DeSoto: | 5.0% |
| Texas: | 4.4% |
Unemployment in 2006:
| DeSoto: | 5.6% |
| Texas: | 5.0% |
Unemployment in 2005:
| DeSoto: | 5.8% |
| Texas: | 5.5% |
Unemployment in 2004:
| DeSoto: | 5.3% |
| Texas: | 6.0% |
Unemployment in 2003:
| DeSoto: | 6.0% |
| Texas: | 6.7% |
Unemployment in 2002:
| DeSoto: | 5.9% |
| Texas: | 6.3% |
Unemployment in 2001:
| DeSoto: | 4.2% |
| Texas: | 5.0% |
Unemployment in 2000:
| DeSoto: | 3.1% |
| Texas: | 4.4% |
Unemployment in 1999:
| DeSoto: | 2.3% |
| Texas: | 4.7% |
Unemployment in 1998:
| DeSoto: | 2.5% |
| Texas: | 5.0% |
Unemployment in 1997:
| DeSoto: | 2.7% |
| Texas: | 5.4% |
Unemployment in 1996:
| DeSoto: | 3.0% |
| Texas: | 5.8% |
Unemployment in 1995:
| DeSoto: | 3.4% |
| Texas: | 6.1% |
Unemployment in 1994:
| DeSoto: | 3.7% |
| Texas: | 6.6% |
Unemployment in 1993:
| DeSoto: | 4.3% |
| Texas: | 7.2% |
Unemployment in 1992:
| DeSoto: | 4.9% |
| Texas: | 7.7% |
Unemployment in 1991:
| DeSoto: | 4.2% |
| Texas: | 7.0% |
Unemployment in 1990:
| DeSoto: | 3.5% |
| Texas: | 6.4% |
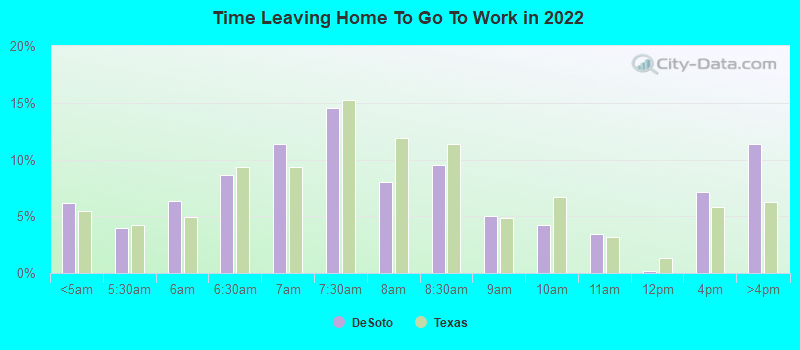
Time leaving home to go to work
12:00 a.m. to 4:59 a.m.:
| DeSoto: | 6.1% (1,432) |
| Texas: | 5.5% (678,264) |
5:00 a.m. to 5:29 a.m.:
| DeSoto: | 3.9% (915) |
| Texas: | 4.3% (525,841) |
5:30 a.m. to 5:59 a.m.:
| DeSoto: | 6.3% (1,478) |
| Texas: | 4.9% (603,953) |
6:00 a.m. to 6:29 a.m.:
| DeSoto: | 8.7% (2,018) |
| Texas: | 9.4% (1,155,020) |
6:30 a.m. to 6:59 a.m.:
| DeSoto: | 11.3% (2,644) |
| Texas: | 9.3% (1,152,822) |
7:00 a.m. to 7:29 a.m.:
| DeSoto: | 14.6% (3,397) |
| Texas: | 15.3% (1,885,477) |
7:30 a.m. to 7:59 a.m.:
| DeSoto: | 8.0% (1,868) |
| Texas: | 11.9% (1,469,628) |
8:00 a.m. to 8:29 a.m.:
| DeSoto: | 9.5% (2,209) |
| Texas: | 11.3% (1,400,175) |
8:30 a.m. to 8:59 a.m.:
| DeSoto: | 5.1% (1,178) |
| Texas: | 4.9% (599,574) |
9:00 a.m. to 9:59 a.m.:
| DeSoto: | 4.2% (988) |
| Texas: | 6.7% (829,367) |
10:00 a.m. to 10:59 a.m.:
| DeSoto: | 3.4% (793) |
| Texas: | 3.2% (390,354) |
11:00 a.m. to 11:59 a.m.:
| DeSoto: | 0.2% (49) |
| Texas: | 1.3% (162,330) |
12:00 p.m. to 3:59 p.m.:
| DeSoto: | 7.1% (1,661) |
| Texas: | 5.8% (720,594) |
4:00 p.m. to 11:59 p.m.:
| DeSoto: | 11.3% (2,642) |
| Texas: | 6.3% (777,072) |
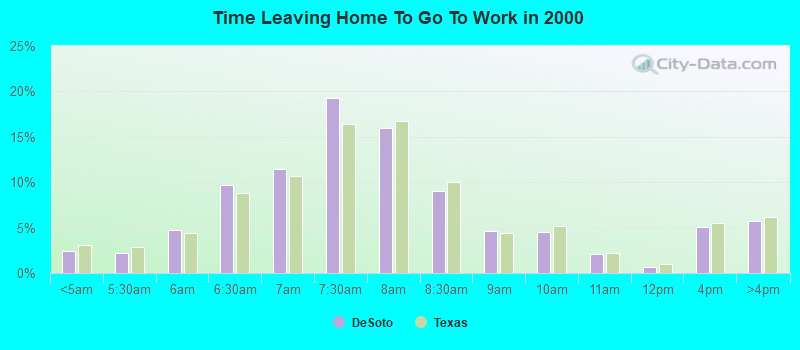
<5am:
| DeSoto: | 2.4% (458) |
| Texas: | 3.1% (281,361) |
5:30am:
| DeSoto: | 2.2% (422) |
| Texas: | 2.9% (262,060) |
6am:
| DeSoto: | 4.7% (908) |
| Texas: | 4.4% (403,423) |
6:30am:
| DeSoto: | 9.7% (1,878) |
| Texas: | 8.8% (808,876) |
7am:
| DeSoto: | 11.4% (2,202) |
| Texas: | 10.7% (976,557) |
7:30am:
| DeSoto: | 19.3% (3,714) |
| Texas: | 16.4% (1,500,904) |
8am:
| DeSoto: | 16.0% (3,079) |
| Texas: | 16.8% (1,536,308) |
8:30am:
| DeSoto: | 9.1% (1,747) |
| Texas: | 10.0% (913,601) |
9am:
| DeSoto: | 4.7% (898) |
| Texas: | 4.4% (398,656) |
10am:
| DeSoto: | 4.5% (869) |
| Texas: | 5.2% (472,592) |
11am:
| DeSoto: | 2.1% (405) |
| Texas: | 2.2% (197,844) |
12pm:
| DeSoto: | 0.7% (128) |
| Texas: | 0.9% (86,997) |
4pm:
| DeSoto: | 5.0% (972) |
| Texas: | 5.5% (503,565) |
>4pm:
| DeSoto: | 5.7% (1,107) |
| Texas: | 6.1% (563,107) |
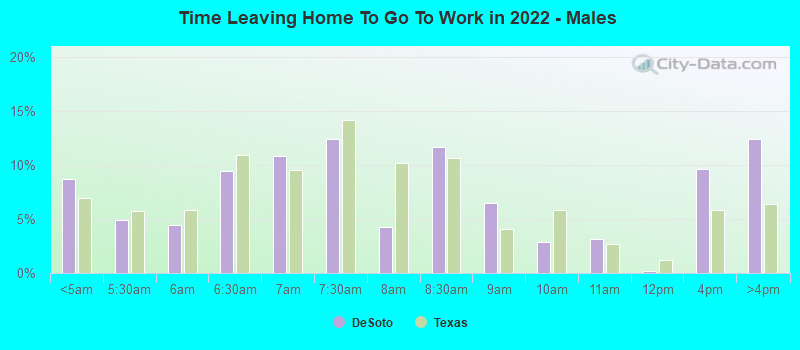
12:00 a.m. to 4:59 a.m. - Males:
| DeSoto: | 8.7% (1,038) |
| Texas: | 7.0% (477,284) |
5:00 a.m. to 5:29 a.m. - Males:
| DeSoto: | 4.9% (580) |
| Texas: | 5.8% (394,876) |
5:30 a.m. to 5:59 a.m. - Males:
| DeSoto: | 4.4% (526) |
| Texas: | 5.9% (402,788) |
6:00 a.m. to 6:29 a.m. - Males:
| DeSoto: | 9.5% (1,132) |
| Texas: | 10.9% (751,118) |
6:30 a.m. to 6:59 a.m. - Males:
| DeSoto: | 10.8% (1,288) |
| Texas: | 9.5% (652,306) |
7:00 a.m. to 7:29 a.m. - Males:
| DeSoto: | 12.4% (1,476) |
| Texas: | 14.1% (970,598) |
7:30 a.m. to 7:59 a.m. - Males:
| DeSoto: | 4.3% (509) |
| Texas: | 10.2% (696,429) |
8:00 a.m. to 8:29 a.m. - Males:
| DeSoto: | 11.6% (1,388) |
| Texas: | 10.6% (729,041) |
8:30 a.m. to 8:59 a.m. - Males:
| DeSoto: | 6.4% (770) |
| Texas: | 4.1% (281,762) |
9:00 a.m. to 9:59 a.m. - Males:
| DeSoto: | 2.8% (338) |
| Texas: | 5.8% (401,071) |
10:00 a.m. to 10:59 a.m. - Males:
| DeSoto: | 3.2% (378) |
| Texas: | 2.7% (186,469) |
11:00 a.m. to 11:59 a.m. - Males:
| DeSoto: | 0.2% (26) |
| Texas: | 1.2% (82,242) |
12:00 p.m. to 3:59 p.m. - Males:
| DeSoto: | 9.6% (1,151) |
| Texas: | 5.8% (397,795) |
4:00 p.m. to 11:59 p.m. - Males:
| DeSoto: | 12.4% (1,476) |
| Texas: | 6.4% (435,950) |
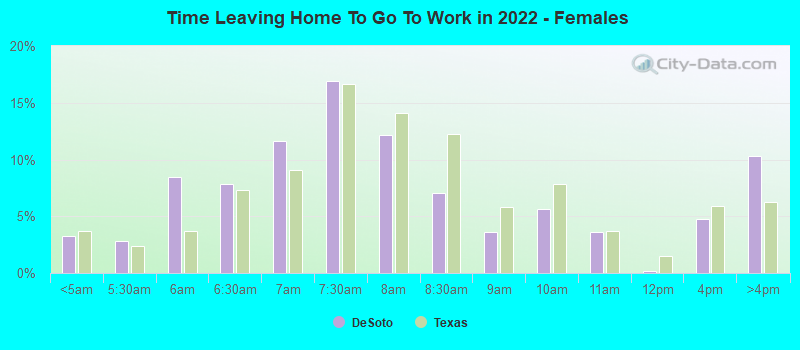
12:00 a.m. to 4:59 a.m. - Females:
| DeSoto: | 3.2% (366) |
| Texas: | 3.7% (200,980) |
5:00 a.m. to 5:29 a.m. - Females:
| DeSoto: | 2.8% (321) |
| Texas: | 2.4% (130,965) |
5:30 a.m. to 5:59 a.m. - Females:
| DeSoto: | 8.4% (955) |
| Texas: | 3.7% (201,165) |
6:00 a.m. to 6:29 a.m. - Females:
| DeSoto: | 7.9% (891) |
| Texas: | 7.4% (403,902) |
6:30 a.m. to 6:59 a.m. - Females:
| DeSoto: | 11.6% (1,317) |
| Texas: | 9.1% (500,516) |
7:00 a.m. to 7:29 a.m. - Females:
| DeSoto: | 16.9% (1,918) |
| Texas: | 16.7% (914,879) |
7:30 a.m. to 7:59 a.m. - Females:
| DeSoto: | 12.2% (1,380) |
| Texas: | 14.1% (773,199) |
8:00 a.m. to 8:29 a.m. - Females:
| DeSoto: | 7.0% (798) |
| Texas: | 12.2% (671,134) |
8:30 a.m. to 8:59 a.m. - Females:
| DeSoto: | 3.6% (413) |
| Texas: | 5.8% (317,812) |
9:00 a.m. to 9:59 a.m. - Females:
| DeSoto: | 5.7% (644) |
| Texas: | 7.8% (428,296) |
10:00 a.m. to 10:59 a.m. - Females:
| DeSoto: | 3.6% (410) |
| Texas: | 3.7% (203,885) |
11:00 a.m. to 11:59 a.m. - Females:
| DeSoto: | 0.2% (22) |
| Texas: | 1.5% (80,088) |
12:00 p.m. to 3:59 p.m. - Females:
| DeSoto: | 4.7% (536) |
| Texas: | 5.9% (322,799) |
4:00 p.m. to 11:59 p.m. - Females:
| DeSoto: | 10.3% (1,169) |
| Texas: | 6.2% (341,122) |
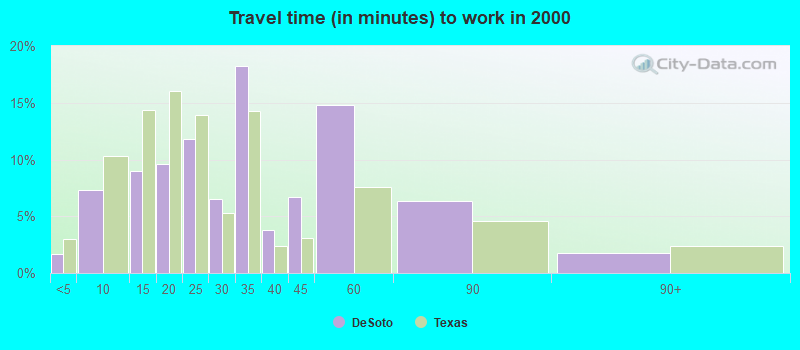
Travel time to work
Percentage of workers working in this county: 83.3%
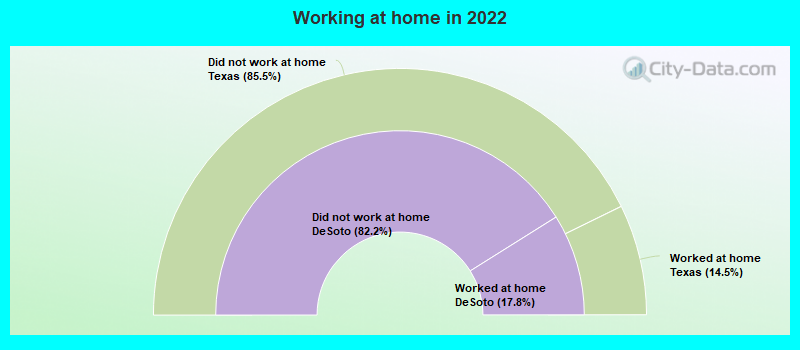
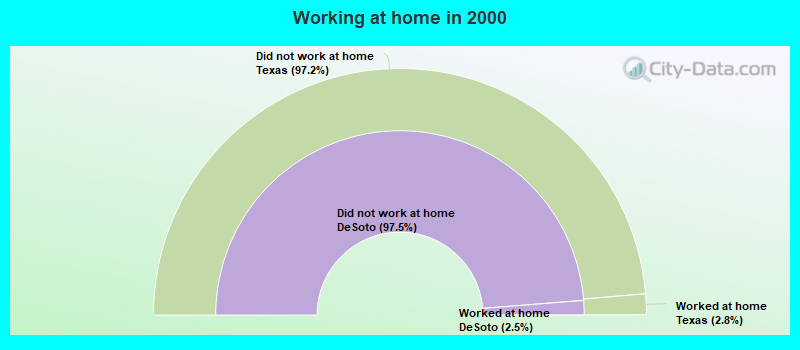
Number of people working at home: 3,742 (13.3% of all workers)
Daytime population change due to commuting: -8,972 (-23.8%)
Workers who live and work in this city: 3,061 (15.9%)
Number of people working at home: 3,742 (13.3% of all workers)
Daytime population change due to commuting: -8,972 (-23.8%)
Workers who live and work in this city: 3,061 (15.9%)
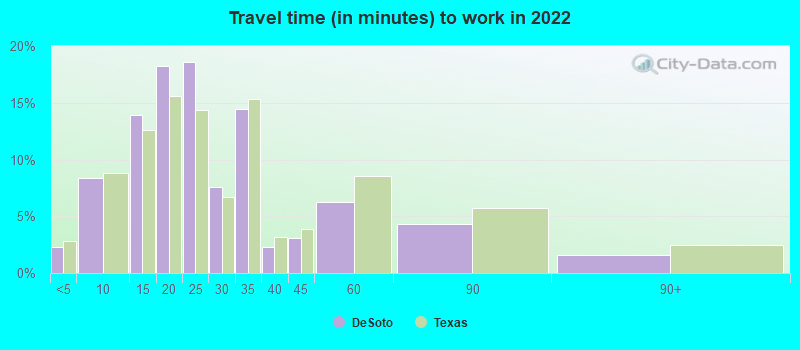
Less than 5 minutes:
| DeSoto: | 2.3% (286) |
| Texas: | 2.8% (350,462) |
5 to 9 minutes:
| DeSoto: | 8.4% (1,055) |
| Texas: | 8.8% (1,087,762) |
10 to 14 minutes:
| DeSoto: | 13.9% (1,747) |
| Texas: | 12.6% (1,550,271) |
15 to 19 minutes:
| DeSoto: | 18.3% (2,292) |
| Texas: | 15.6% (1,918,353) |
20 to 24 minutes:
| DeSoto: | 18.6% (2,336) |
| Texas: | 14.4% (1,772,079) |
25 to 29 minutes:
| DeSoto: | 7.6% (949) |
| Texas: | 6.7% (827,833) |
30 to 34 minutes:
| DeSoto: | 14.5% (1,820) |
| Texas: | 15.3% (1,887,878) |
35 to 39 minutes:
| DeSoto: | 2.3% (289) |
| Texas: | 3.2% (394,170) |
40 to 44 minutes:
| DeSoto: | 3.1% (390) |
| Texas: | 3.9% (476,118) |
45 to 59 minutes:
| DeSoto: | 6.3% (786) |
| Texas: | 8.6% (1,058,376) |
60 to 89 minutes:
| DeSoto: | 4.3% (545) |
| Texas: | 5.7% (706,002) |
90 or more minutes:
| DeSoto: | 1.6% (202) |
| Texas: | 2.4% (299,884) |
Less than 5 minutes:
| DeSoto: | 1.7% (327) |
| Texas: | 3.0% (277,642) |
5 to 9 minutes:
| DeSoto: | 7.3% (1,406) |
| Texas: | 10.3% (942,891) |
10 to 14 minutes:
| DeSoto: | 9.0% (1,726) |
| Texas: | 14.4% (1,317,555) |
15 to 19 minutes:
| DeSoto: | 9.6% (1,852) |
| Texas: | 16.0% (1,467,945) |
20 to 24 minutes:
| DeSoto: | 11.8% (2,276) |
| Texas: | 13.9% (1,276,781) |
25 to 29 minutes:
| DeSoto: | 6.5% (1,249) |
| Texas: | 5.3% (482,838) |
30 to 34 minutes:
| DeSoto: | 18.3% (3,519) |
| Texas: | 14.3% (1,309,699) |
35 to 39 minutes:
| DeSoto: | 3.8% (729) |
| Texas: | 2.4% (219,873) |
40 to 44 minutes:
| DeSoto: | 6.7% (1,283) |
| Texas: | 3.1% (280,916) |
45 to 59 minutes:
| DeSoto: | 14.8% (2,847) |
| Texas: | 7.6% (692,006) |
60 to 89 minutes:
| DeSoto: | 6.4% (1,226) |
| Texas: | 4.6% (418,905) |
90 or more minutes:
| DeSoto: | 1.8% (347) |
| Texas: | 2.4% (218,800) |
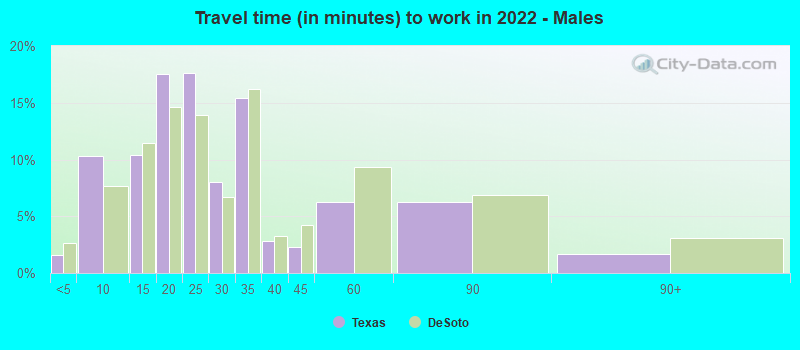
Less than 5 minutes - Males:
| DeSoto: | 1.6% (106) |
| Texas: | 2.7% (181,937) |
5 to 9 minutes - Males:
| DeSoto: | 10.3% (692) |
| Texas: | 7.6% (522,166) |
10 to 14 minutes - Males:
| DeSoto: | 10.4% (701) |
| Texas: | 11.5% (785,572) |
15 to 19 minutes - Males:
| DeSoto: | 17.6% (1,180) |
| Texas: | 14.6% (1,001,179) |
20 to 24 minutes - Males:
| DeSoto: | 17.6% (1,185) |
| Texas: | 13.9% (950,043) |
25 to 29 minutes - Males:
| DeSoto: | 8.0% (536) |
| Texas: | 6.7% (457,259) |
30 to 34 minutes - Males:
| DeSoto: | 15.4% (1,036) |
| Texas: | 16.2% (1,110,357) |
35 to 39 minutes - Males:
| DeSoto: | 2.8% (189) |
| Texas: | 3.3% (223,512) |
40 to 44 minutes - Males:
| DeSoto: | 2.3% (155) |
| Texas: | 4.2% (289,434) |
45 to 59 minutes - Males:
| DeSoto: | 6.3% (420) |
| Texas: | 9.3% (639,122) |
60 to 89 minutes - Males:
| DeSoto: | 6.3% (423) |
| Texas: | 6.8% (467,154) |
90 or more minutes - Males:
| DeSoto: | 1.7% (114) |
| Texas: | 3.1% (211,313) |
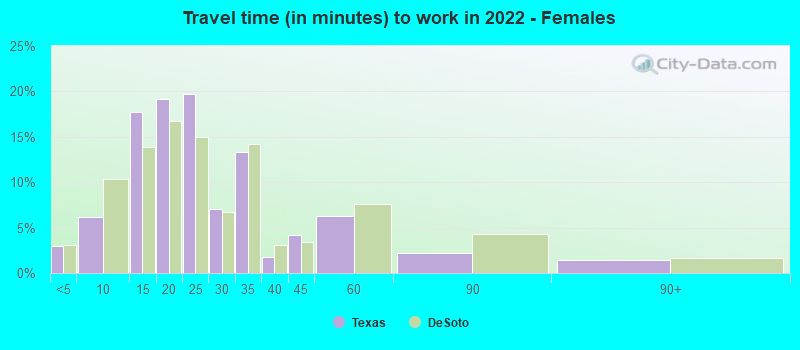
Less than 5 minutes - Females:
| DeSoto: | 2.9% (170) |
| Texas: | 3.1% (168,525) |
5 to 9 minutes - Females:
| DeSoto: | 6.1% (356) |
| Texas: | 10.3% (565,596) |
10 to 14 minutes - Females:
| DeSoto: | 17.7% (1,033) |
| Texas: | 13.9% (764,699) |
15 to 19 minutes - Females:
| DeSoto: | 19.1% (1,113) |
| Texas: | 16.7% (917,174) |
20 to 24 minutes - Females:
| DeSoto: | 19.7% (1,147) |
| Texas: | 15.0% (822,036) |
25 to 29 minutes - Females:
| DeSoto: | 7.1% (413) |
| Texas: | 6.7% (370,574) |
30 to 34 minutes - Females:
| DeSoto: | 13.3% (776) |
| Texas: | 14.2% (777,521) |
35 to 39 minutes - Females:
| DeSoto: | 1.7% (102) |
| Texas: | 3.1% (170,658) |
40 to 44 minutes - Females:
| DeSoto: | 4.2% (243) |
| Texas: | 3.4% (186,684) |
45 to 59 minutes - Females:
| DeSoto: | 6.2% (364) |
| Texas: | 7.6% (419,254) |
60 to 89 minutes - Females:
| DeSoto: | 2.2% (126) |
| Texas: | 4.4% (238,848) |
90 or more minutes - Females:
| DeSoto: | 1.4% (83) |
| Texas: | 1.6% (88,571) |
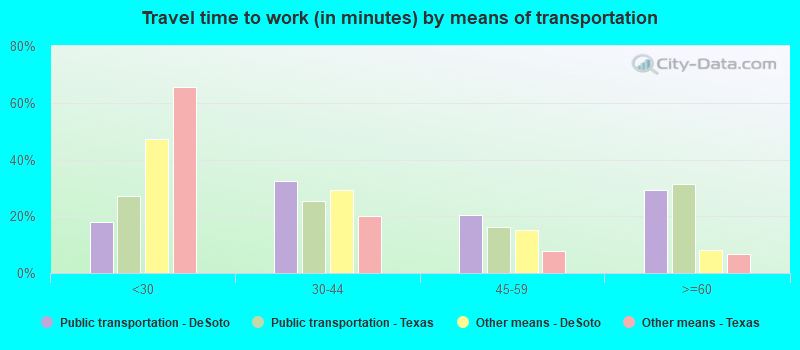
Means of transportation to work
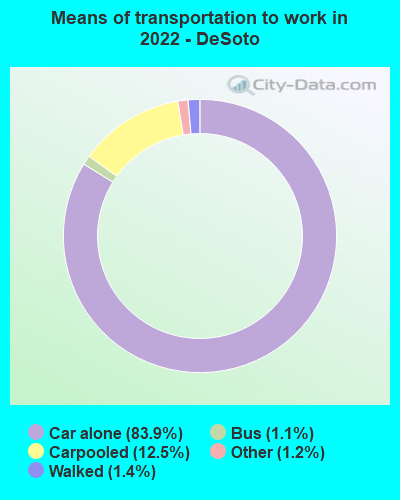

Drove car alone:
| DeSoto: | 83.9% (10,906) |
| Texas: | 83.3% (4,557,023) |
Carpooled:
| DeSoto: | 12.5% (1,624) |
| Texas: | 11.7% (674,818) |
Bus:
| DeSoto: | 1.1% (140) |
| Texas: | 0.9% (50,435) |
Walked:
| DeSoto: | 1.4% (180) |
| Texas: | 1.7% (99,911) |
Other means:
| DeSoto: | 1.2% (155) |
| Texas: | 2.0% (95,481) |
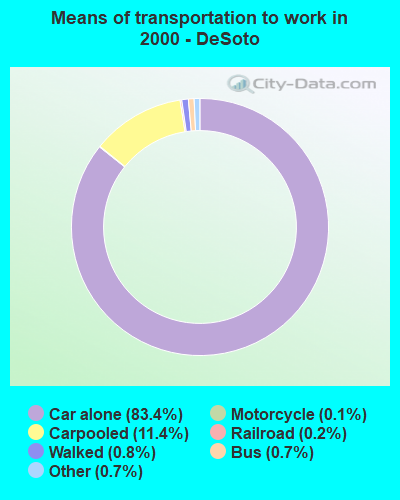

Drove car alone:
| DeSoto: | 83.4% (16,069) |
| Texas: | 77.7% (7,115,590) |
Carpooled:
| DeSoto: | 11.4% (2,193) |
| Texas: | 14.5% (1,326,012) |
Bus or trolley bus:
| DeSoto: | 0.7% (141) |
| Texas: | 1.7% (157,014) |
Railroad:
| DeSoto: | 0.2% (47) |
| Texas: | 0.0% (2,374) |
Taxicab:
| DeSoto: | 0.0% (7) |
| Texas: | 0.1% (6,102) |
Motorcycle:
| DeSoto: | 0.1% (23) |
| Texas: | 0.1% (12,068) |
Bicycle:
| DeSoto: | 0.0% (8) |
| Texas: | 0.2% (21,551) |
Walked:
| DeSoto: | 0.8% (155) |
| Texas: | 1.9% (173,670) |
Other means:
| DeSoto: | 0.7% (144) |
| Texas: | 0.9% (86,692) |
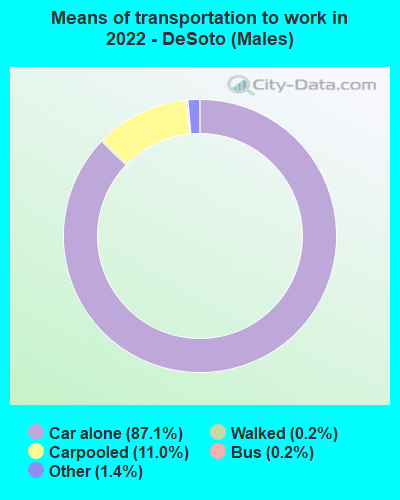

Drove car alone - Males:
| DeSoto: | 87.1% (6,018) |
| Texas: | 83.6% (4,557,023) |
Carpooled - Males:
| DeSoto: | 11.0% (763) |
| Texas: | 11.2% (674,818) |
Bus - Males:
| DeSoto: | 0.2% (14) |
| Texas: | 0.8% (50,435) |
Walked - Males:
| DeSoto: | 0.2% (11) |
| Texas: | 1.7% (99,911) |
Other means - Males:
| DeSoto: | 1.4% (100) |
| Texas: | 2.2% (95,481) |
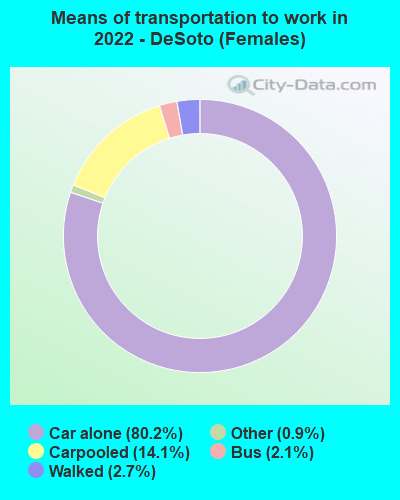

Drove car alone - Females:
| DeSoto: | 80.2% (4,887) |
| Texas: | 83.0% (4,557,023) |
Carpooled - Females:
| DeSoto: | 14.1% (859) |
| Texas: | 12.3% (674,818) |
Bus - Females:
| DeSoto: | 2.1% (125) |
| Texas: | 0.9% (50,435) |
Walked - Females:
| DeSoto: | 2.7% (167) |
| Texas: | 1.8% (99,911) |
Other means - Females:
| DeSoto: | 0.9% (55) |
| Texas: | 1.7% (95,481) |
Private vehicle occupancy
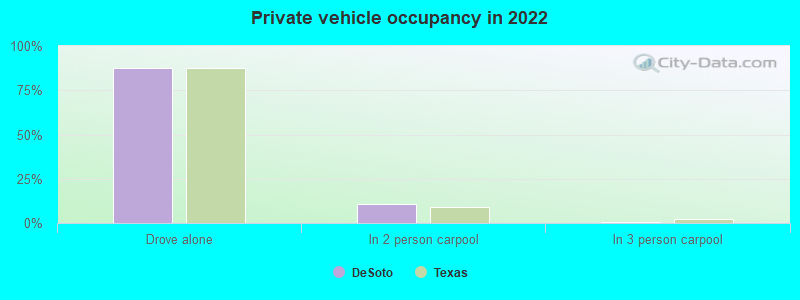
Drove alone:
| DeSoto: | 87.8% (20,021) |
| Texas: | 87.6% (10,283,021) |
In 2 person carpool:
| DeSoto: | 10.9% (2,494) |
| Texas: | 9.0% (1,052,595) |
In 3 person carpool:
| DeSoto: | 0.3% (75) |
| Texas: | 2.1% (244,139) |
In 4 person carpool:
| DeSoto: | 0.6% (131) |
| Texas: | 0.8% (92,732) |
In 5-6 person carpool:
| DeSoto: | 0.4% (91) |
| Texas: | 0.4% (44,947) |
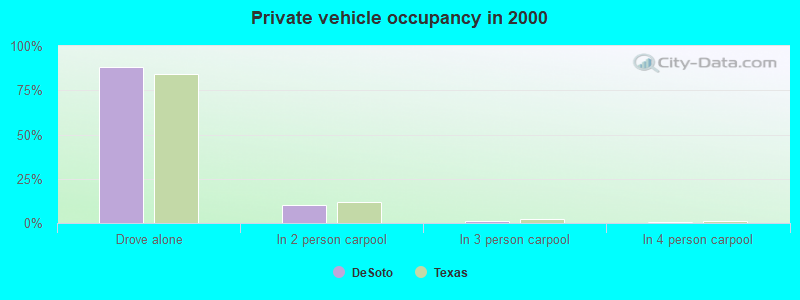
Drove alone:
| DeSoto: | 88.0% (16,069) |
| Texas: | 84.3% (7,115,590) |
In 2 person carpool:
| DeSoto: | 10.1% (1,846) |
| Texas: | 11.6% (982,994) |
In 3 person carpool:
| DeSoto: | 1.3% (235) |
| Texas: | 2.4% (201,602) |
In 4 person carpool:
| DeSoto: | 0.4% (73) |
| Texas: | 1.0% (83,518) |
In 5-6 person carpool:
| DeSoto: | 0.2% (39) |
| Texas: | 0.5% (40,662) |
Class of workers
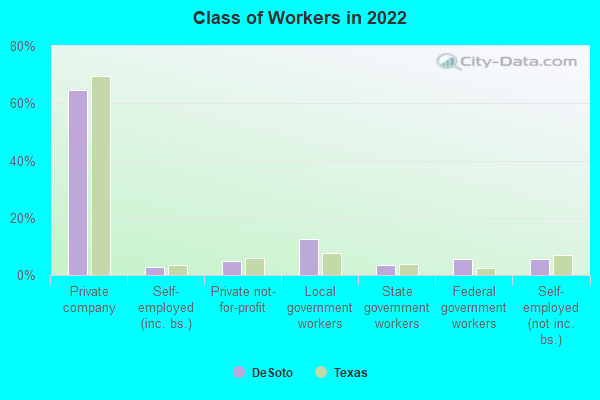
Employee of private company:
| DeSoto: | 64.6% (18,647) |
| Texas: | 69.6% (10,139,666) |
Self-employed in own incorporated business:
| DeSoto: | 2.9% (836) |
| Texas: | 3.5% (516,446) |
Private not-for-profit wage and salary workers:
| DeSoto: | 4.9% (1,414) |
| Texas: | 6.0% (870,454) |
Local government workers:
| DeSoto: | 12.8% (3,683) |
| Texas: | 7.6% (1,109,799) |
State government workers:
| DeSoto: | 3.5% (1,012) |
| Texas: | 3.8% (558,618) |
Federal government workers:
| DeSoto: | 5.6% (1,619) |
| Texas: | 2.5% (357,298) |
Self-employed workers in own not incorporated business:
| DeSoto: | 5.6% (1,630) |
| Texas: | 6.8% (998,270) |
Unpaid family workers:
| DeSoto: | 0.1% (43) |
| Texas: | 0.2% (27,882) |
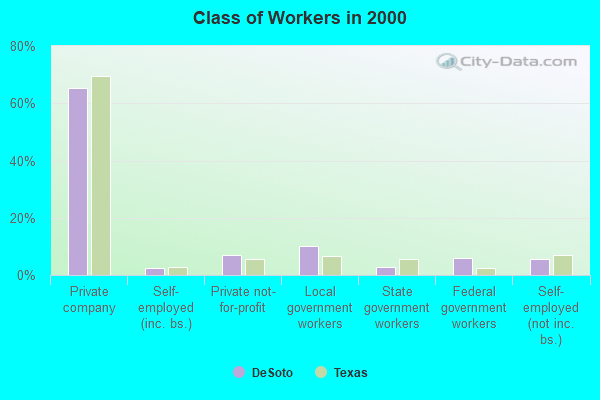
Employee of private company:
| DeSoto: | 65.5% (12,894) |
| Texas: | 69.6% (6,425,274) |
Self-employed in own incorporated business:
| DeSoto: | 2.4% (482) |
| Texas: | 2.7% (250,864) |
Private not-for-profit wage and salary workers:
| DeSoto: | 7.1% (1,388) |
| Texas: | 5.7% (526,631) |
Local government workers:
| DeSoto: | 10.1% (1,998) |
| Texas: | 6.6% (608,479) |
State government workers:
| DeSoto: | 2.9% (573) |
| Texas: | 5.4% (501,082) |
Federal government workers:
| DeSoto: | 6.0% (1,181) |
| Texas: | 2.6% (237,177) |
Self-employed workers in own not incorporated business:
| DeSoto: | 5.7% (1,126) |
| Texas: | 7.1% (653,527) |
Unpaid family workers:
| DeSoto: | 0.2% (43) |
| Texas: | 0.3% (31,338) |

Employee of private company - Males:
| DeSoto: | 68.2% (9,290) |
| Texas: | 73.1% (5,788,450) |
Self-employed in own incorporated business - Males:
| DeSoto: | 4.3% (582) |
| Texas: | 4.2% (332,655) |
Private not-for-profit wage and salary workers - Males:
| DeSoto: | 3.4% (462) |
| Texas: | 4.1% (323,476) |
Local government workers - Males:
| DeSoto: | 9.1% (1,243) |
| Texas: | 5.1% (405,467) |
State government workers - Males:
| DeSoto: | 1.8% (249) |
| Texas: | 3.0% (236,706) |
Federal government workers - Males:
| DeSoto: | 6.1% (835) |
| Texas: | 2.7% (211,629) |
Self-employed workers in own not incorporated business - Males:
| DeSoto: | 6.8% (932) |
| Texas: | 7.7% (609,246) |
Unpaid family workers - Males:
| DeSoto: | 0.2% (25) |
| Texas: | 0.2% (12,606) |

Employee of private company - Females:
| DeSoto: | 61.3% (9,357) |
| Texas: | 65.4% (4,351,216) |
Self-employed in own incorporated business - Females:
| DeSoto: | 1.7% (254) |
| Texas: | 2.8% (183,791) |
Private not-for-profit wage and salary workers - Females:
| DeSoto: | 6.2% (951) |
| Texas: | 8.2% (546,978) |
Local government workers - Females:
| DeSoto: | 16.0% (2,440) |
| Texas: | 10.6% (704,332) |
State government workers - Females:
| DeSoto: | 5.0% (763) |
| Texas: | 4.8% (321,912) |
Federal government workers - Females:
| DeSoto: | 5.1% (785) |
| Texas: | 2.2% (145,669) |
Self-employed workers in own not incorporated business - Females:
| DeSoto: | 4.6% (698) |
| Texas: | 5.8% (389,024) |
Unpaid family workers - Females:
| DeSoto: | 0.1% (18) |
| Texas: | 0.2% (15,276) |