Work and Jobs in Gilmore City, Iowa (IA) Detailed Stats
Occupations, Industries, Unemployment, Workers, Commute
Settings
X


Discuss Gilmore City, Iowa work on our local forum with over 2,400,000 registered users
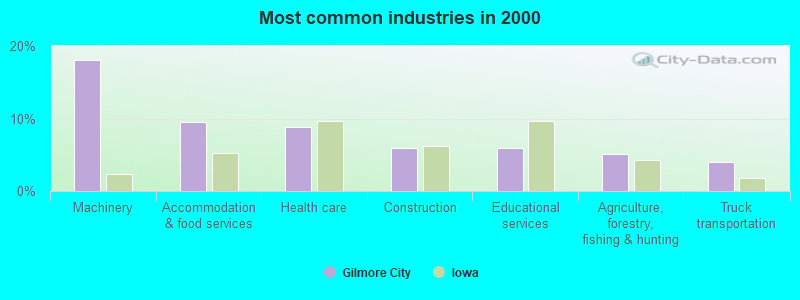
The most common industries in Gilmore City are: Machinery (18.0% of civilian employees), Accommodation & food services (9.6% of civilian employees), Health care (8.8% of civilian employees). 56.2% of workers work in Humboldt County and 3.2% of all workers work at home. 77.9% of workers are employees of private companies, which is 15.2% greater than the rate of 66.1% across the entire state of Iowa.
Whole page based on the data from 2000 / 2022 when the population of Gilmore City, Iowa was 556 / 611
Whole page based on the data from 2000 / 2022 when the population of Gilmore City, Iowa was 556 / 611
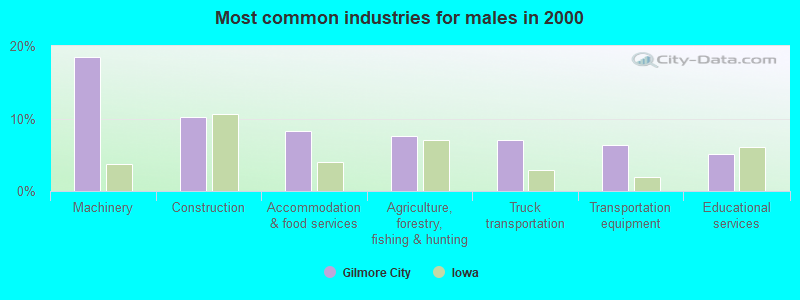
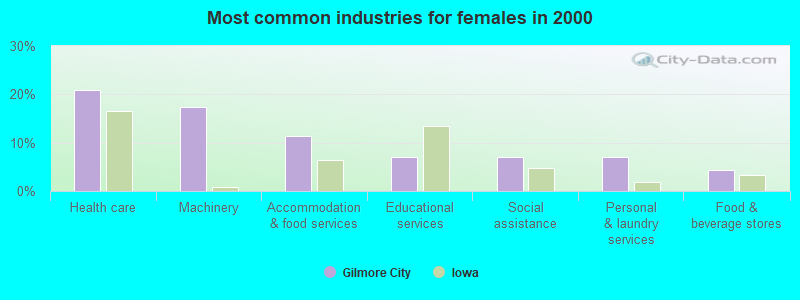
Most common industries
Most common industries | |||
|---|---|---|---|
Industry | All | Males | Females |
| Machinery | 18.0% (49) | 18.5% (29) | 17.4% (20) |
| Accommodation and food services | 9.6% (26) | 8.3% (13) | 11.3% (13) |
| Health care | 8.8% (24) | 0.0% (0) | 20.9% (24) |
| Construction | 5.9% (16) | 10.2% (16) | 0.0% (0) |
| Educational services | 5.9% (16) | 5.1% (8) | 7.0% (8) |
| Agriculture, forestry, fishing and hunting | 5.1% (14) | 7.6% (12) | 1.7% (2) |
| Truck transportation | 4.0% (11) | 7.0% (11) | 0.0% (0) |
| Transportation equipment | 3.7% (10) | 6.4% (10) | 0.0% (0) |
| Food and beverage stores | 3.7% (10) | 3.2% (5) | 4.3% (5) |
| Social assistance | 3.7% (10) | 1.3% (2) | 7.0% (8) |
| Public administration | 3.3% (9) | 2.5% (4) | 4.3% (5) |
| Mining, quarrying, and oil and gas extraction | 2.9% (8) | 3.8% (6) | 1.7% (2) |
| Personal and laundry services | 2.9% (8) | 0.0% (0) | 7.0% (8) |
| Gasoline stations | 2.6% (7) | 1.9% (3) | 3.5% (4) |
| Professional, scientific, and technical services | 2.2% (6) | 1.9% (3) | 2.6% (3) |
| Religious, grantmaking, civic, professional, and similar organizations | 1.8% (5) | 1.9% (3) | 1.7% (2) |
| Building material and garden equipment and supplies dealers | 1.8% (5) | 3.2% (5) | 0.0% (0) |
| Food | 1.5% (4) | 2.5% (4) | 0.0% (0) |
| Farm product raw materials merchant wholesalers | 1.5% (4) | 2.5% (4) | 0.0% (0) |
| Chemicals | 1.5% (4) | 2.5% (4) | 0.0% (0) |
| Department and other general merchandise stores | 1.5% (4) | 0.0% (0) | 3.5% (4) |
| Lumber and other construction materials merchant wholesalers | 1.1% (3) | 1.9% (3) | 0.0% (0) |
| Real estate and rental and leasing | 1.1% (3) | 1.3% (2) | 0.9% (1) |
| Repair and maintenance | 1.1% (3) | 1.9% (3) | 0.0% (0) |
| Machinery, equipment, and supplies merchant wholesalers | 0.7% (2) | 1.3% (2) | 0.0% (0) |
| Radio, TV, and computer stores | 0.7% (2) | 1.3% (2) | 0.0% (0) |
| Sporting goods, camera, and hobby and toy stores | 0.7% (2) | 0.0% (0) | 1.7% (2) |
| Nonmetallic mineral products | 0.7% (2) | 1.3% (2) | 0.0% (0) |
| Motor vehicle and parts dealers | 0.7% (2) | 0.0% (0) | 1.7% (2) |
| Finance and insurance | 0.7% (2) | 0.0% (0) | 1.7% (2) |
| Warehousing and storage | 0.4% (1) | 0.6% (1) | 0.0% (0) |
Unemployment in Gilmore City
- Unemployment by race in 2022
- Unemployment rate for White non-Hispanic residents
- 2.0%Males
- Unemployment by race in 2000
- Unemployment rate for White non-Hispanic residents
- 5.1%Males
- 6.5%Females
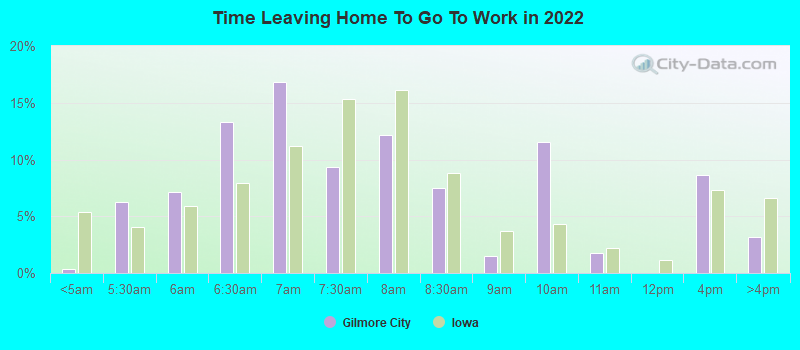
Time leaving home to go to work
12:00 a.m. to 4:59 a.m.:
| Gilmore City: | 0.4% (1) |
| Iowa: | 5.4% (78,069) |
5:00 a.m. to 5:29 a.m.:
| Gilmore City: | 6.3% (17) |
| Iowa: | 4.1% (59,137) |
5:30 a.m. to 5:59 a.m.:
| Gilmore City: | 7.2% (19) |
| Iowa: | 5.9% (85,191) |
6:00 a.m. to 6:29 a.m.:
| Gilmore City: | 13.3% (36) |
| Iowa: | 7.9% (115,215) |
6:30 a.m. to 6:59 a.m.:
| Gilmore City: | 16.8% (46) |
| Iowa: | 11.2% (163,096) |
7:00 a.m. to 7:29 a.m.:
| Gilmore City: | 9.3% (25) |
| Iowa: | 15.3% (222,036) |
7:30 a.m. to 7:59 a.m.:
| Gilmore City: | 12.1% (33) |
| Iowa: | 16.1% (233,545) |
8:00 a.m. to 8:29 a.m.:
| Gilmore City: | 7.5% (21) |
| Iowa: | 8.8% (128,101) |
8:30 a.m. to 8:59 a.m.:
| Gilmore City: | 1.5% (4) |
| Iowa: | 3.7% (54,230) |
9:00 a.m. to 9:59 a.m.:
| Gilmore City: | 11.5% (31) |
| Iowa: | 4.4% (63,292) |
10:00 a.m. to 10:59 a.m.:
| Gilmore City: | 1.8% (5) |
| Iowa: | 2.2% (31,476) |
12:00 p.m. to 3:59 p.m.:
| Gilmore City: | 8.6% (23) |
| Iowa: | 7.3% (106,198) |
4:00 p.m. to 11:59 p.m.:
| Gilmore City: | 3.2% (9) |
| Iowa: | 6.6% (96,179) |
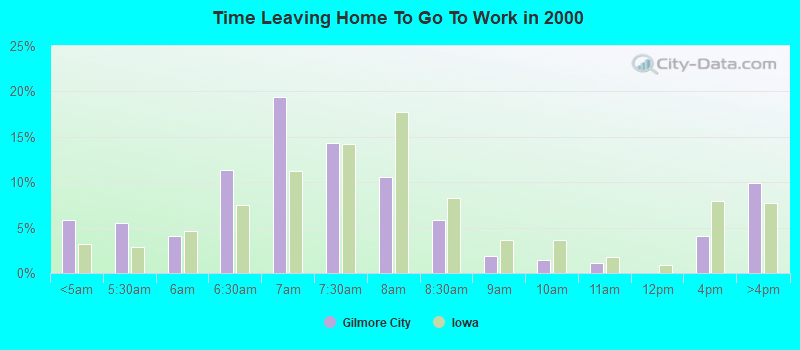
<5am:
| Gilmore City: | 5.9% (16) |
| Iowa: | 3.2% (47,736) |
5:30am:
| Gilmore City: | 5.5% (15) |
| Iowa: | 2.9% (42,797) |
6am:
| Gilmore City: | 4.0% (11) |
| Iowa: | 4.6% (68,195) |
6:30am:
| Gilmore City: | 11.4% (31) |
| Iowa: | 7.5% (110,529) |
7am:
| Gilmore City: | 19.4% (53) |
| Iowa: | 11.2% (164,470) |
7:30am:
| Gilmore City: | 14.3% (39) |
| Iowa: | 14.2% (208,547) |
8am:
| Gilmore City: | 10.6% (29) |
| Iowa: | 17.7% (260,172) |
8:30am:
| Gilmore City: | 5.9% (16) |
| Iowa: | 8.3% (121,843) |
9am:
| Gilmore City: | 1.8% (5) |
| Iowa: | 3.6% (53,363) |
10am:
| Gilmore City: | 1.5% (4) |
| Iowa: | 3.6% (53,533) |
11am:
| Gilmore City: | 1.1% (3) |
| Iowa: | 1.7% (25,691) |
4pm:
| Gilmore City: | 4.0% (11) |
| Iowa: | 8.0% (117,038) |
>4pm:
| Gilmore City: | 9.9% (27) |
| Iowa: | 7.7% (112,601) |
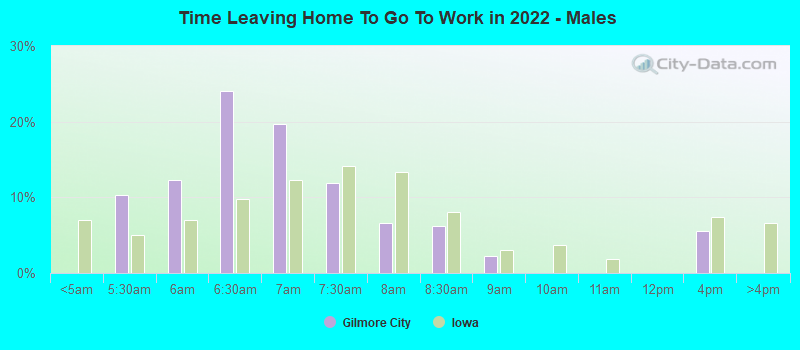
5:00 a.m. to 5:29 a.m. - Males:
| Gilmore City: | 10.4% (15) |
| Iowa: | 5.0% (38,853) |
5:30 a.m. to 5:59 a.m. - Males:
| Gilmore City: | 12.3% (17) |
| Iowa: | 6.9% (54,231) |
6:00 a.m. to 6:29 a.m. - Males:
| Gilmore City: | 24.0% (34) |
| Iowa: | 9.7% (76,023) |
6:30 a.m. to 6:59 a.m. - Males:
| Gilmore City: | 19.6% (28) |
| Iowa: | 12.3% (95,751) |
7:00 a.m. to 7:29 a.m. - Males:
| Gilmore City: | 12.0% (17) |
| Iowa: | 14.1% (110,477) |
7:30 a.m. to 7:59 a.m. - Males:
| Gilmore City: | 6.6% (9) |
| Iowa: | 13.3% (103,974) |
8:00 a.m. to 8:29 a.m. - Males:
| Gilmore City: | 6.3% (9) |
| Iowa: | 8.0% (62,850) |
8:30 a.m. to 8:59 a.m. - Males:
| Gilmore City: | 2.2% (3) |
| Iowa: | 3.0% (23,631) |
12:00 p.m. to 3:59 p.m. - Males:
| Gilmore City: | 5.6% (8) |
| Iowa: | 7.3% (57,343) |
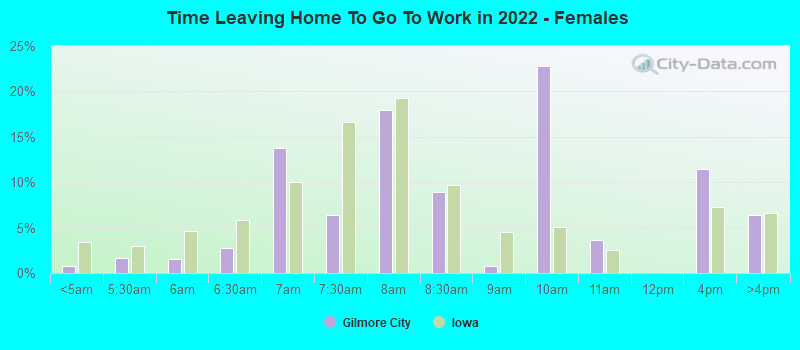
12:00 a.m. to 4:59 a.m. - Females:
| Gilmore City: | 0.8% (1) |
| Iowa: | 3.5% (23,162) |
5:00 a.m. to 5:29 a.m. - Females:
| Gilmore City: | 1.6% (2) |
| Iowa: | 3.0% (20,284) |
5:30 a.m. to 5:59 a.m. - Females:
| Gilmore City: | 1.6% (2) |
| Iowa: | 4.6% (30,960) |
6:00 a.m. to 6:29 a.m. - Females:
| Gilmore City: | 2.8% (4) |
| Iowa: | 5.8% (39,192) |
6:30 a.m. to 6:59 a.m. - Females:
| Gilmore City: | 13.7% (18) |
| Iowa: | 10.0% (67,345) |
7:00 a.m. to 7:29 a.m. - Females:
| Gilmore City: | 6.4% (8) |
| Iowa: | 16.6% (111,559) |
7:30 a.m. to 7:59 a.m. - Females:
| Gilmore City: | 18.0% (24) |
| Iowa: | 19.3% (129,571) |
8:00 a.m. to 8:29 a.m. - Females:
| Gilmore City: | 8.9% (12) |
| Iowa: | 9.7% (65,251) |
8:30 a.m. to 8:59 a.m. - Females:
| Gilmore City: | 0.8% (1) |
| Iowa: | 4.6% (30,599) |
9:00 a.m. to 9:59 a.m. - Females:
| Gilmore City: | 22.8% (30) |
| Iowa: | 5.1% (33,961) |
10:00 a.m. to 10:59 a.m. - Females:
| Gilmore City: | 3.6% (5) |
| Iowa: | 2.6% (17,120) |
12:00 p.m. to 3:59 p.m. - Females:
| Gilmore City: | 11.5% (15) |
| Iowa: | 7.3% (48,855) |
4:00 p.m. to 11:59 p.m. - Females:
| Gilmore City: | 6.4% (8) |
| Iowa: | 6.6% (44,191) |
Travel time to work
Percentage of workers working in this county: 56.2%
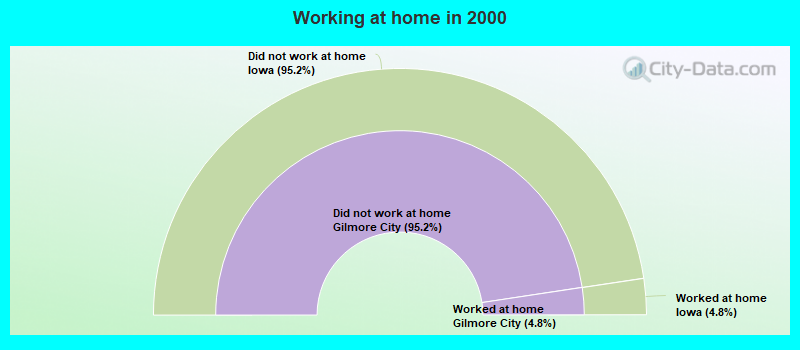
Number of people working at home: 9 (3.2% of all workers)
Number of people working at home: 9 (3.2% of all workers)
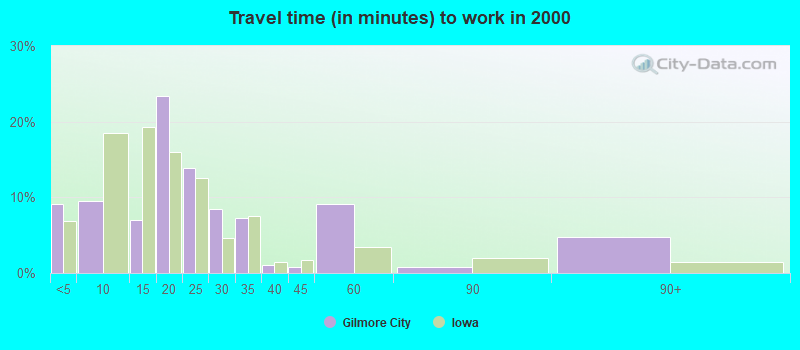
Less than 5 minutes:
| Gilmore City: | 9.2% (25) |
| Iowa: | 6.8% (100,616) |
5 to 9 minutes:
| Gilmore City: | 9.5% (26) |
| Iowa: | 18.5% (271,589) |
10 to 14 minutes:
| Gilmore City: | 7.0% (19) |
| Iowa: | 19.3% (283,804) |
15 to 19 minutes:
| Gilmore City: | 23.4% (64) |
| Iowa: | 16.0% (234,745) |
20 to 24 minutes:
| Gilmore City: | 13.9% (38) |
| Iowa: | 12.5% (183,539) |
25 to 29 minutes:
| Gilmore City: | 8.4% (23) |
| Iowa: | 4.6% (67,775) |
30 to 34 minutes:
| Gilmore City: | 7.3% (20) |
| Iowa: | 7.6% (111,454) |
35 to 39 minutes:
| Gilmore City: | 1.1% (3) |
| Iowa: | 1.5% (22,220) |
40 to 44 minutes:
| Gilmore City: | 0.7% (2) |
| Iowa: | 1.7% (24,880) |
45 to 59 minutes:
| Gilmore City: | 9.2% (25) |
| Iowa: | 3.4% (49,913) |
60 to 89 minutes:
| Gilmore City: | 0.7% (2) |
| Iowa: | 2.0% (28,703) |
90 or more minutes:
| Gilmore City: | 4.8% (13) |
| Iowa: | 1.4% (20,741) |
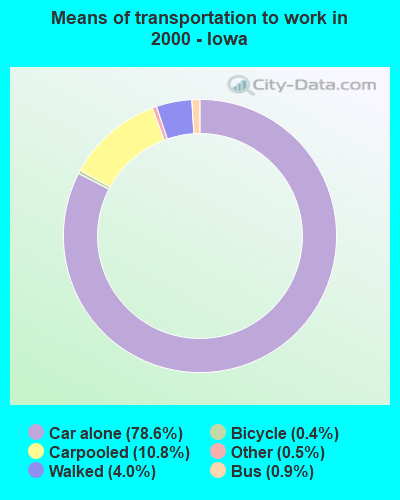
Means of transportation to work
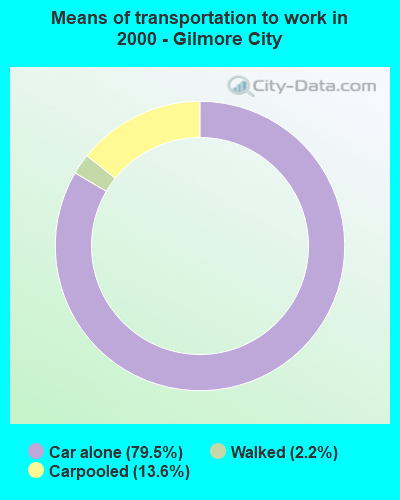
Drove car alone:
| Gilmore City: | 79.5% (217) |
| Iowa: | 78.6% (1,155,008) |
Carpooled:
| Gilmore City: | 13.6% (37) |
| Iowa: | 10.8% (158,699) |
Walked:
| Gilmore City: | 2.2% (6) |
| Iowa: | 4.0% (58,088) |
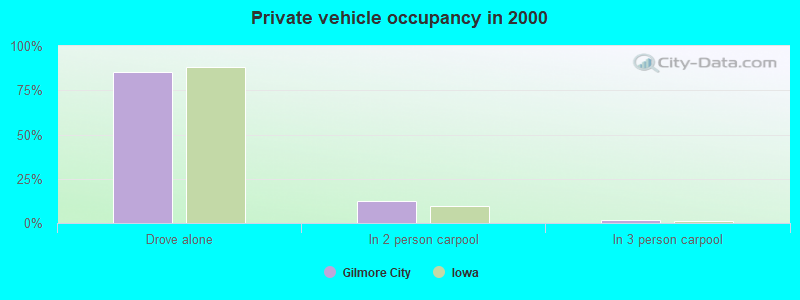
Private vehicle occupancy
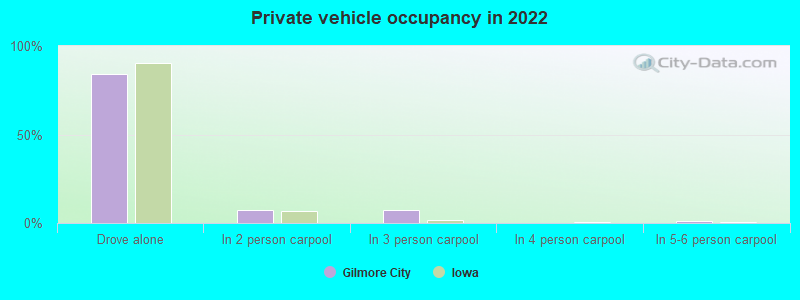
Drove alone:
| Gilmore City: | 84.3% (224) |
| Iowa: | 90.5% (1,240,859) |
In 2 person carpool:
| Gilmore City: | 7.1% (19) |
| Iowa: | 6.9% (94,195) |
In 3 person carpool:
| Gilmore City: | 7.5% (20) |
| Iowa: | 1.4% (19,770) |
In 5-6 person carpool:
| Gilmore City: | 1.0% (3) |
| Iowa: | 0.3% (4,603) |
Drove alone:
| Gilmore City: | 85.4% (217) |
| Iowa: | 87.9% (1,155,008) |
In 2 person carpool:
| Gilmore City: | 12.2% (31) |
| Iowa: | 9.8% (128,891) |
In 3 person carpool:
| Gilmore City: | 2.0% (5) |
| Iowa: | 1.4% (18,510) |
In 4 person carpool:
| Gilmore City: | 0.4% (1) |
| Iowa: | 0.5% (6,602) |
Class of workers
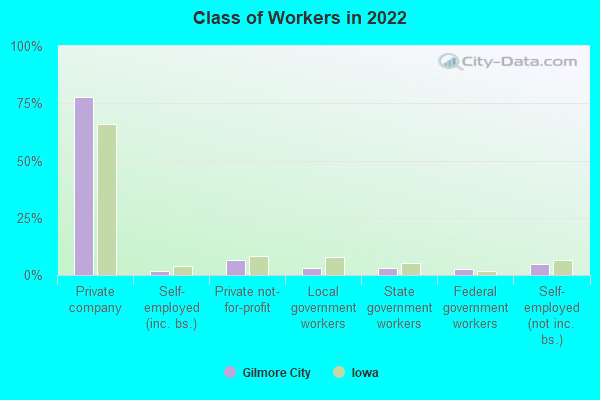
Employee of private company:
| Gilmore City: | 77.9% (223) |
| Iowa: | 66.1% (1,096,595) |
Self-employed in own incorporated business:
| Gilmore City: | 1.8% (5) |
| Iowa: | 4.1% (67,511) |
Private not-for-profit wage and salary workers:
| Gilmore City: | 6.4% (18) |
| Iowa: | 8.5% (140,926) |
Local government workers:
| Gilmore City: | 3.2% (9) |
| Iowa: | 7.8% (129,397) |
State government workers:
| Gilmore City: | 3.2% (9) |
| Iowa: | 5.2% (86,770) |
Federal government workers:
| Gilmore City: | 2.5% (7) |
| Iowa: | 1.7% (28,231) |
Self-employed workers in own not incorporated business:
| Gilmore City: | 5.0% (14) |
| Iowa: | 6.3% (105,099) |
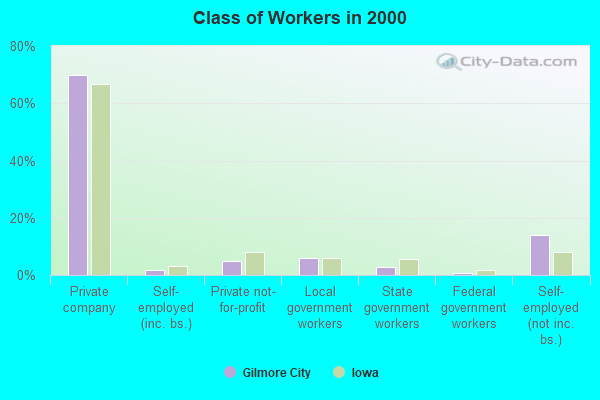
Employee of private company:
| Gilmore City: | 69.9% (190) |
| Iowa: | 66.6% (992,122) |
Self-employed in own incorporated business:
| Gilmore City: | 1.8% (5) |
| Iowa: | 3.0% (44,330) |
Private not-for-profit wage and salary workers:
| Gilmore City: | 4.8% (13) |
| Iowa: | 8.2% (121,940) |
Local government workers:
| Gilmore City: | 5.9% (16) |
| Iowa: | 6.1% (90,430) |
State government workers:
| Gilmore City: | 2.9% (8) |
| Iowa: | 5.8% (85,726) |
Federal government workers:
| Gilmore City: | 0.7% (2) |
| Iowa: | 1.8% (27,176) |
Self-employed workers in own not incorporated business:
| Gilmore City: | 14.0% (38) |
| Iowa: | 8.2% (121,579) |
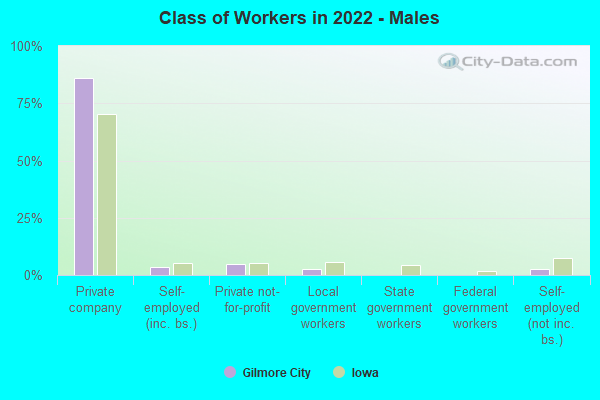
Employee of private company - Males:
| Gilmore City: | 86.0% (125) |
| Iowa: | 70.3% (615,735) |
Self-employed in own incorporated business - Males:
| Gilmore City: | 3.5% (5) |
| Iowa: | 5.3% (46,477) |
Private not-for-profit wage and salary workers - Males:
| Gilmore City: | 4.9% (7) |
| Iowa: | 5.1% (44,923) |
Local government workers - Males:
| Gilmore City: | 2.8% (4) |
| Iowa: | 5.7% (49,834) |
Self-employed workers in own not incorporated business - Males:
| Gilmore City: | 2.8% (4) |
| Iowa: | 7.4% (64,591) |
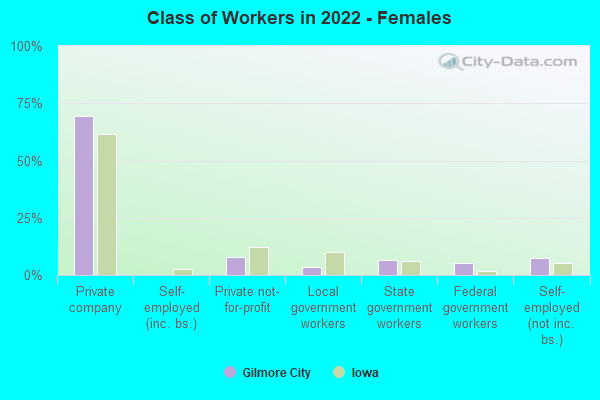
Employee of private company - Females:
| Gilmore City: | 69.6% (98) |
| Iowa: | 61.5% (480,860) |
Private not-for-profit wage and salary workers - Females:
| Gilmore City: | 8.0% (11) |
| Iowa: | 12.3% (96,003) |
Local government workers - Females:
| Gilmore City: | 3.6% (5) |
| Iowa: | 10.2% (79,563) |
State government workers - Females:
| Gilmore City: | 6.5% (9) |
| Iowa: | 6.2% (48,443) |
Federal government workers - Females:
| Gilmore City: | 5.1% (7) |
| Iowa: | 1.7% (13,661) |
Self-employed workers in own not incorporated business - Females:
| Gilmore City: | 7.2% (10) |
| Iowa: | 5.2% (40,508) |