Work and Jobs in Kapalua, Hawaii (HI) Detailed Stats
Data:
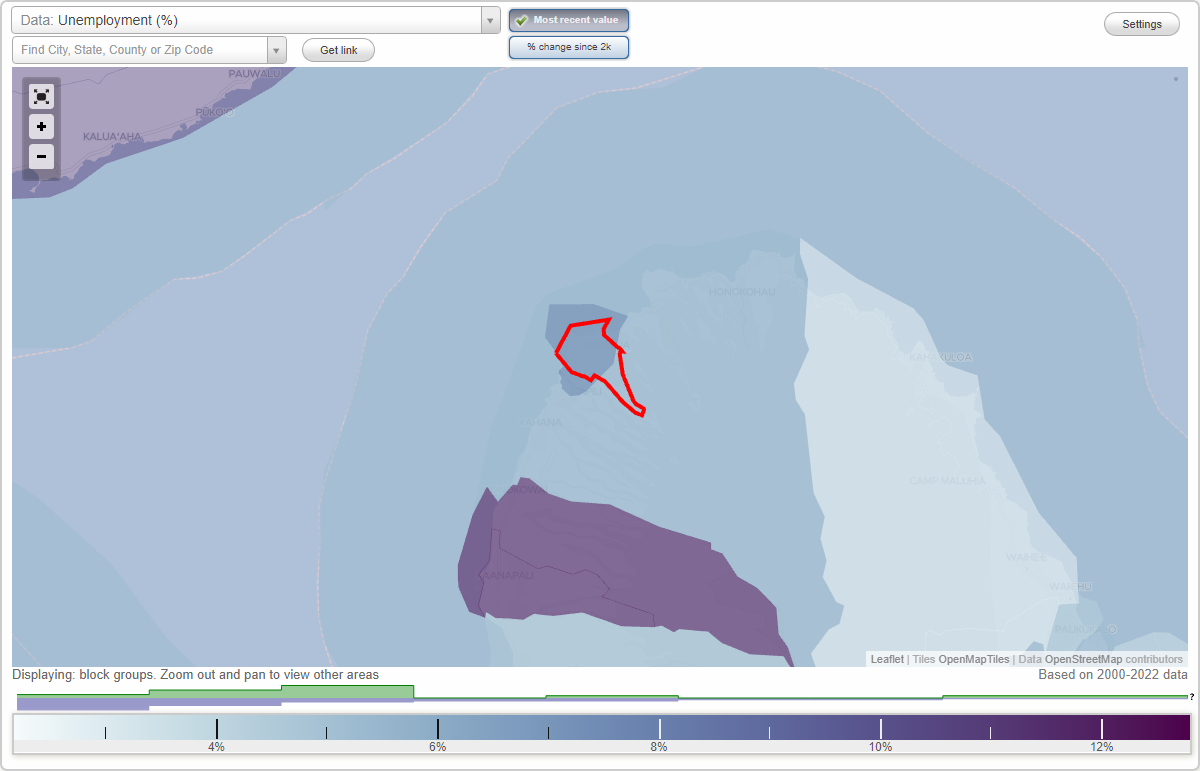
Unemployment (%)
Unemployment (% change since 2000)
Unemployment (%) - White
Unemployment (% change since 2000) - White
Unemployment (%) - Black or African American
Unemployment (% change since 2000) - Black or African American
Unemployment (%) - Asian
Unemployment (% change since 2000) - Asian
Unemployment (%) - Hispanic or Latino
Unemployment (% change since 2000) - Hispanic or Latino
Unemployment (%) - American Indian and Alaska Native
Unemployment (% change since 2000) - American Indian and Alaska Native
Unemployment (%) - Multirace
Unemployment (% change since 2000) - Multirace
Unemployment (%) - Other Race
Unemployment (% change since 2000) - Other Race
Industry diversity
Most Common Industries - Agriculture, forestry, fishing and hunting, and mining (%)
Most Common Industries - Agriculture, forestry, fishing and hunting (%)
Most Common Industries - Mining, quarrying, and oil and gas extraction (%)
Most Common Industries - Construction (%)
Most Common Industries - Manufacturing (%)
Most Common Industries - Wholesale trade (%)
Most Common Industries - Retail trade (%)
Most Common Industries - Transportation and warehousing, and utilities (%)
Most Common Industries - Transportation and warehousing (%)
Most Common Industries - Utilities (%)
Most Common Industries - Information (%)
Most Common Industries - Finance and insurance, and real estate and rental and leasing (%)
Most Common Industries - Finance and insurance (%)
Most Common Industries - Real estate and rental and leasing (%)
Most Common Industries - Professional, scientific, and management, and administrative and waste management services (%)
Most Common Industries - Professional, scientific, and technical services (%)
Most Common Industries - Management of companies and enterprises (%)
Most Common Industries - Administrative and support and waste management services (%)
Most Common Industries - Educational services, and health care and social assistance (%)
Most Common Industries - Educational services (%)
Most Common Industries - Health care and social assistance (%)
Most Common Industries - Arts, entertainment, and recreation, and accommodation and food services (%)
Most Common Industries - Arts, entertainment, and recreation (%)
Most Common Industries - Accommodation and food services (%)
Most Common Industries - Other services, except public administration (%)
Most Common Industries - Public administration (%)
Occupation diversity
Most Common Occupations - Management, business, science, and arts occupations (%)
Most Common Occupations - Management, business, and financial occupations (%)
Most Common Occupations - Management occupations (%)
Most Common Occupations - Business and financial operations occupations (%)
Most Common Occupations - Computer, engineering, and science occupations (%)
Most Common Occupations - Computer and mathematical occupations (%)
Most Common Occupations - Architecture and engineering occupations (%)
Most Common Occupations - Life, physical, and social science occupations (%)
Most Common Occupations - Education, legal, community service, arts, and media occupations (%)
Most Common Occupations - Community and social service occupations (%)
Most Common Occupations - Legal occupations (%)
Most Common Occupations - Education, training, and library occupations (%)
Most Common Occupations - Arts, design, entertainment, sports, and media occupations (%)
Most Common Occupations - Healthcare practitioners and technical occupations (%)
Most Common Occupations - Health diagnosing and treating practitioners and other technical occupations (%)
Most Common Occupations - Health technologists and technicians (%)
Most Common Occupations - Service occupations (%)
Most Common Occupations - Healthcare support occupations (%)
Most Common Occupations - Protective service occupations (%)
Most Common Occupations - Fire fighting and prevention, and other protective service workers including supervisors (%)
Most Common Occupations - Law enforcement workers including supervisors (%)
Most Common Occupations - Food preparation and serving related occupations (%)
Most Common Occupations - Building and grounds cleaning and maintenance occupations (%)
Most Common Occupations - Personal care and service occupations (%)
Most Common Occupations - Sales and office occupations (%)
Most Common Occupations - Sales and related occupations (%)
Most Common Occupations - Office and administrative support occupations (%)
Most Common Occupations - Natural resources, construction, and maintenance occupations (%)
Most Common Occupations - Farming, fishing, and forestry occupations (%)
Most Common Occupations - Construction and extraction occupations (%)
Most Common Occupations - Installation, maintenance, and repair occupations (%)
Most Common Occupations - Production, transportation, and material moving occupations (%)
Most Common Occupations - Production occupations (%)
Most Common Occupations - Transportation occupations (%)
Most Common Occupations - Material moving occupations (%)
Private vehicle occupancy - Drove alone (% change since 2000)
Private vehicle occupancy - Carpooled (%)
Private vehicle occupancy - Carpooled (% change since 2000)
Private vehicle occupancy - In 2-person carpool (%)
Private vehicle occupancy - In 2-person carpool (% change since 2000)
Private vehicle occupancy - In 3-person carpool (%)
Private vehicle occupancy - In 3-person carpool (% change since 2000)
Private vehicle occupancy - In 4-person carpool (%)
Private vehicle occupancy - In 4-person carpool (% change since 2000)
Private vehicle occupancy - In 5- or 6-person carpool (%)
Private vehicle occupancy - In 5- or 6-person carpool (% change since 2000)
Private vehicle occupancy - In 7-or-more-person carpool (%)
Private vehicle occupancy - In 7-or-more-person carpool (% change since 2000)
Time Leaving Home To Go To Work - 12:00 a.m. to 4:59 a.m. (%)
Time Leaving Home To Go To Work - 12:00 a.m. to 4:59 a.m. (% change since 2000)
Time Leaving Home To Go To Work - 5:00 a.m. to 5:59 a.m. (%)
Time Leaving Home To Go To Work - 5:00 a.m. to 5:59 a.m. (% change since 2000)
Time Leaving Home To Go To Work - 6:00 a.m. to 6:59 a.m. (%)
Time Leaving Home To Go To Work - 6:00 a.m. to 6:59 a.m. (% change since 2000)
Time Leaving Home To Go To Work - 7:00 a.m. to 7:59 a.m. (%)
Time Leaving Home To Go To Work - 7:00 a.m. to 7:59 a.m. (% change since 2000)
Time Leaving Home To Go To Work - 8:00 a.m. to 8:59 a.m. (%)
Time Leaving Home To Go To Work - 8:00 a.m. to 8:59 a.m. (% change since 2000)
Time Leaving Home To Go To Work - 9:00 a.m. to 9:59 a.m. (%)
Time Leaving Home To Go To Work - 9:00 a.m. to 9:59 a.m. (% change since 2000)
Time Leaving Home To Go To Work - 10:00 a.m. to 10:59 a.m. (%)
Time Leaving Home To Go To Work - 10:00 a.m. to 10:59 a.m. (% change since 2000)
Time Leaving Home To Go To Work - 11:00 a.m. to 11:59 a.m. (%)
Time Leaving Home To Go To Work - 11:00 a.m. to 11:59 a.m. (% change since 2000)
Time Leaving Home To Go To Work - 12:00 p.m. to 3:59 p.m. (%)
Time Leaving Home To Go To Work - 12:00 p.m. to 3:59 p.m. (% change since 2000)
Time Leaving Home To Go To Work - 4:00 p.m. to 11:59 p.m. (%)
Time Leaving Home To Go To Work - 4:00 p.m. to 11:59 p.m. (% change since 2000)
Class of Workers - Employee of private company (%)
Class of Workers - Employee of private company (% change since 2000)
Class of Workers - Self-employed in own incorporated business (%)
Class of Workers - Self-employed in own incorporated business (% change since 2000)
Class of Workers - Private not-for-profit wage and salary workers (%)
Class of Workers - Private not-for-profit wage and salary workers (% change since 2000)
Class of Workers - Local government workers (%)
Class of Workers - Local government workers (% change since 2000)
Class of Workers - State government workers (%)
Class of Workers - State government workers (% change since 2000)
Class of Workers - Federal government workers (%)
Class of Workers - Federal government workers (% change since 2000)
Class of Workers - Self-employed workers in own not incorporated business and Unpaid family workers (%)
Class of Workers - Self-employed workers in own not incorporated business and Unpaid family workers (% change since 2000)
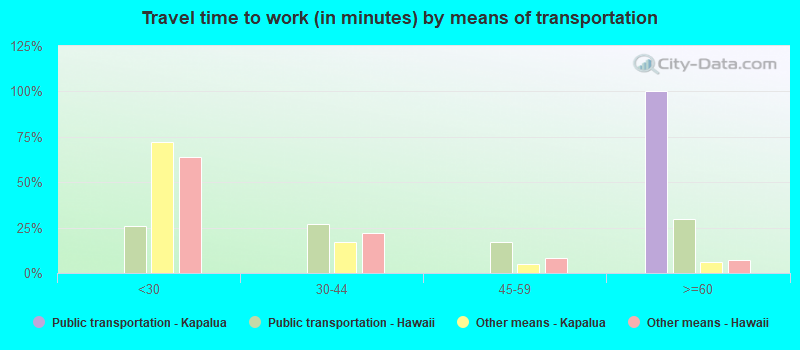
Means of transportation to work - Drove car alone (%)
Means of transportation to work - Drove car alone (% change since 2000)
Means of transportation to work - Carpooled (%)
Means of transportation to work - Carpooled (% change since 2000)
Means of transportation to work - Public transportation (%)
Means of transportation to work - Public transportation (% change since 2000)
Means of transportation to work - Bus or trolley bus (%)
Means of transportation to work - Bus or trolley bus (% change since 2000)
Means of transportation to work - Streetcar or trolley car (%)
Means of transportation to work - Streetcar or trolley car (% change since 2000)
Means of transportation to work - Subway or elevated (%)
Means of transportation to work - Subway or elevated (% change since 2000)
Means of transportation to work - Railroad (%)
Means of transportation to work - Railroad (% change since 2000)
Means of transportation to work - Ferryboat (%)
Means of transportation to work - Ferryboat (% change since 2000)
Means of transportation to work - Taxicab (%)
Means of transportation to work - Taxicab (% change since 2000)
Means of transportation to work - Motorcycle (%)
Means of transportation to work - Motorcycle (% change since 2000)
Means of transportation to work - Bicycle (%)
Means of transportation to work - Bicycle (% change since 2000)
Means of transportation to work - Walked (%)
Means of transportation to work - Walked (% change since 2000)
Means of transportation to work - Other means (%)
Means of transportation to work - Other means (% change since 2000)
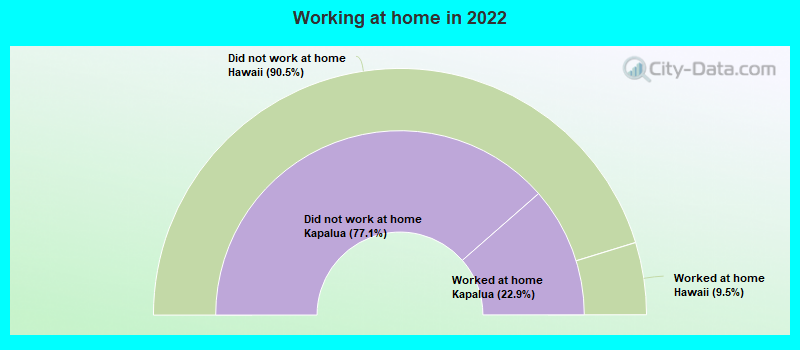
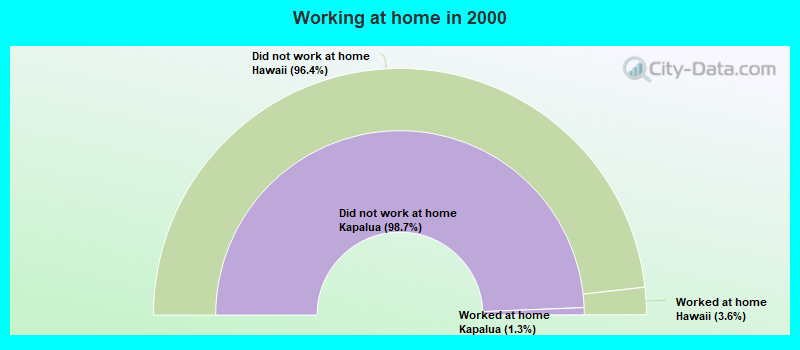
Working at home (%)
Working at home (% change since 2000)
Travel time to work - Less than 5 minutes (%)
Travel time to work - Less than 5 minutes (% change since 2000)
Travel time to work - 5 to 9 minutes (%)
Travel time to work - 5 to 9 minutes (% change since 2000)
Travel time to work - 10 to 19 minutes (%)
Travel time to work - 10 to 19 minutes (% change since 2000)
Travel time to work - 20 to 29 minutes (%)
Travel time to work - 20 to 29 minutes (% change since 2000)
Travel time to work - 30 to 39 minutes (%)
Travel time to work - 30 to 39 minutes (% change since 2000)
Travel time to work - 40 to 59 minutes (%)
Travel time to work - 40 to 59 minutes (% change since 2000)
Travel time to work - 60 to 89 minutes (%)
Travel time to work - 60 to 89 minutes (% change since 2000)
Travel time to work - 90 or more minutes (%)
Travel time to work - 90 or more minutes (% change since 2000)
Latest news about work in Kapalua, HI collected exclusively by city-data.com from local newspapers, TV, and radio stations
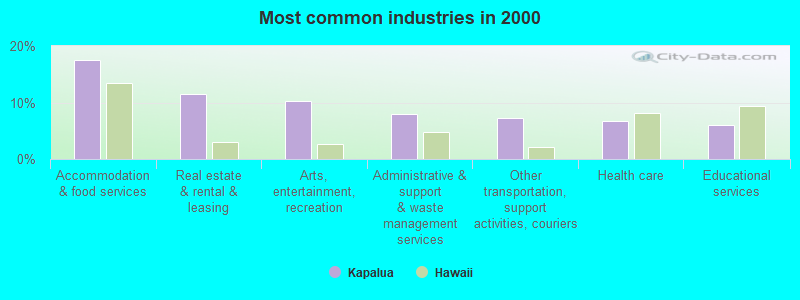
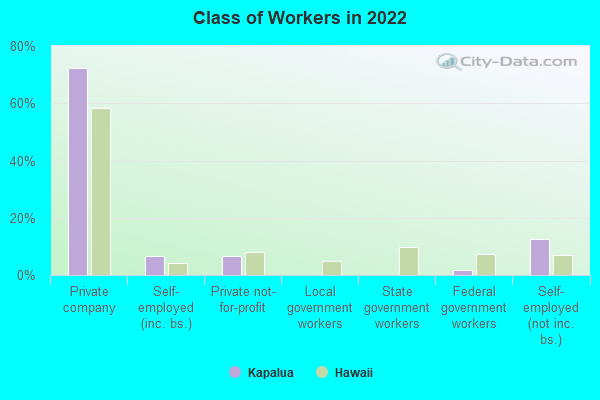
The most common industries in Kapalua are: Accommodation & food services (17.6% of civilian employees), Real estate & rental & leasing (11.5% of civilian employees), Arts, entertainment, recreation (10.3% of civilian employees). 100.0% of workers work in Maui County and 17.8% of all workers work at home. 72.4% of workers are employees of private companies, which is 19.4% greater than the rate of 58.3% across the entire state of Hawaii.
Whole page based on the data from 2000 / 2022 when the population of Kapalua, Hawaii was 467 / 391
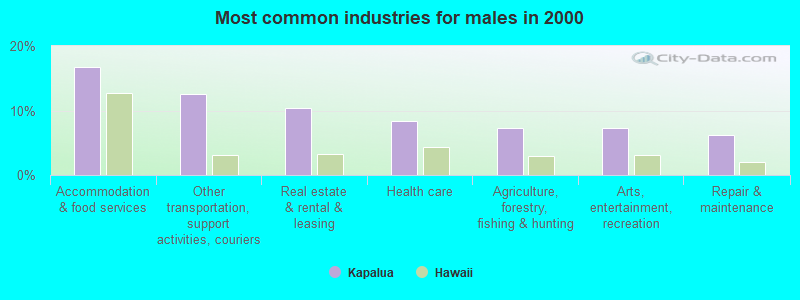
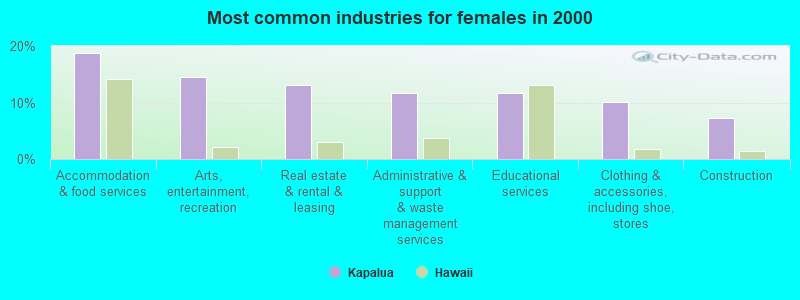
Most common industries
Most common industries Industry All Males Females
Accommodation and food services 17.6% 16.7% 18.8% Real estate and rental and leasing 11.5% 10.4% 13.0% Arts, entertainment, and recreation 10.3% 7.3% 14.5% Administrative and support and waste management services 7.9% 5.2% 11.6% Other transportation, and support activities, and couriers 7.3% 12.5% 0.0% Health care 6.7% 8.3% 4.3% Educational services 6.1% 2.1% 11.6% Agriculture, forestry, fishing and hunting 4.2% 7.3% 0.0% Clothing and accessories, including shoe, stores 4.2% 0.0% 10.1% Repair and maintenance 3.6% 6.2% 0.0% Construction 3.0% 0.0% 7.2% Finance and insurance 3.0% 5.2% 0.0% Food and beverage stores 3.0% 5.2% 0.0% Miscellaneous nondurable goods merchant wholesalers 2.4% 4.2% 0.0% Public administration 1.8% 3.1% 0.0% Used merchandise, gift, novelty, and souvenir, and other miscellaneous stores 1.8% 0.0% 4.3% Management of companies and enterprises 1.8% 3.1% 0.0% Social assistance 1.8% 0.0% 4.3% Petroleum and coal products 1.8% 3.1% 0.0%
Unemployment in Kapalua Unemployment by race in 2022
Unemployment rate for White non-Hispanic residents 7.2% FemalesUnemployment rate for two or more race residents 64.6% MalesUnemployment by race in 2000
Unemployment rate for White non-Hispanic residents 10.6% MalesUnemployment rate for two or more race residents 23.8% Females
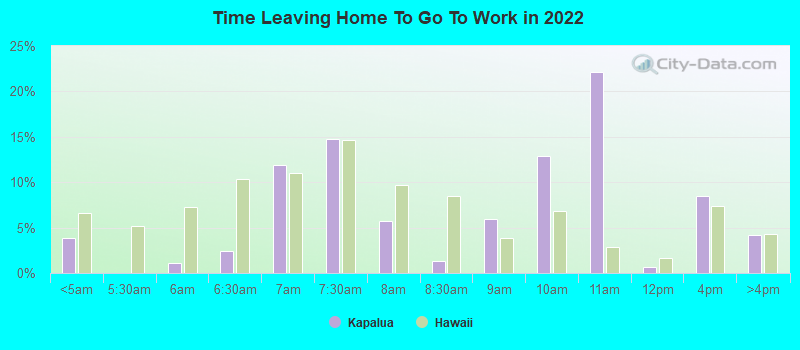
Time leaving home to go to work 12:00 a.m. to 4:59 a.m.: Kapalua:
3.9% (5)Hawaii:
6.6% (41,595)
5:30 a.m. to 5:59 a.m.: Kapalua:
1.1% (1)Hawaii:
7.2% (45,843)
6:00 a.m. to 6:29 a.m.: Kapalua:
2.4% (3)Hawaii:
10.3% (65,165)
6:30 a.m. to 6:59 a.m.: Kapalua:
11.9% (16)Hawaii:
11.0% (69,479)
7:00 a.m. to 7:29 a.m.: Kapalua:
14.8% (20)Hawaii:
14.7% (92,882)
7:30 a.m. to 7:59 a.m.: Kapalua:
5.7% (8)Hawaii:
9.6% (60,988)
8:00 a.m. to 8:29 a.m.: Kapalua:
1.3% (2)Hawaii:
8.5% (53,658)
8:30 a.m. to 8:59 a.m.: Kapalua:
5.9% (8)Hawaii:
3.9% (24,492)
9:00 a.m. to 9:59 a.m.: Kapalua:
12.9% (17)Hawaii:
6.9% (43,369)
10:00 a.m. to 10:59 a.m.: Kapalua:
22.1% (29)Hawaii:
2.9% (18,091)
11:00 a.m. to 11:59 a.m.: Kapalua:
0.7% (1)Hawaii:
1.6% (10,243)
12:00 p.m. to 3:59 p.m.: Kapalua:
8.4% (11)Hawaii:
7.4% (47,004)
4:00 p.m. to 11:59 p.m.: Kapalua:
4.2% (6)Hawaii:
4.2% (26,872)
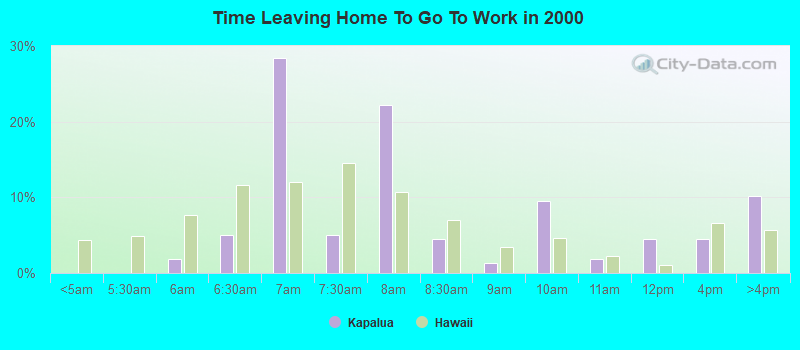
6am: Kapalua:
1.9% (3)Hawaii:
7.7% (43,322)
6:30am: Kapalua:
5.1% (8)Hawaii:
11.6% (65,360)
7am: Kapalua:
28.5% (45)Hawaii:
12.0% (67,419)
7:30am: Kapalua:
5.1% (8)Hawaii:
14.5% (81,910)
8am: Kapalua:
22.2% (35)Hawaii:
10.7% (60,043)
8:30am: Kapalua:
4.4% (7)Hawaii:
6.9% (39,062)
9am: Kapalua:
1.3% (2)Hawaii:
3.4% (19,353)
10am: Kapalua:
9.5% (15)Hawaii:
4.6% (26,106)
11am: Kapalua:
1.9% (3)Hawaii:
2.2% (12,599)
12pm: Kapalua:
4.4% (7)Hawaii:
1.1% (6,027)
4pm: Kapalua:
4.4% (7)Hawaii:
6.7% (37,483)
>4pm: Kapalua:
10.1% (16)Hawaii:
5.7% (32,314)
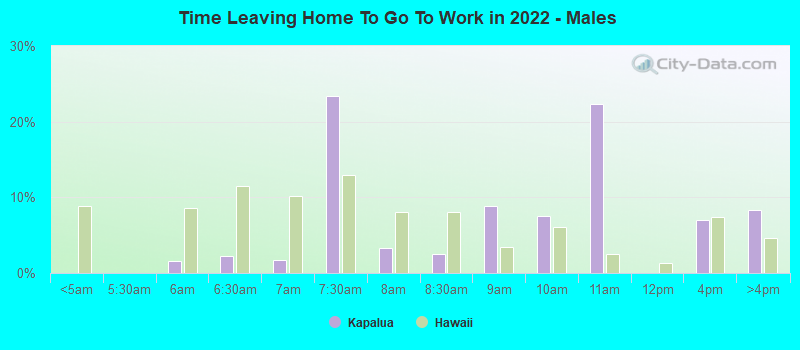
5:30 a.m. to 5:59 a.m. - Males: Kapalua:
1.7% (1)Hawaii:
8.6% (29,702)
6:00 a.m. to 6:29 a.m. - Males: Kapalua:
2.2% (2)Hawaii:
11.5% (39,830)
6:30 a.m. to 6:59 a.m. - Males: Kapalua:
1.7% (1)Hawaii:
10.2% (35,321)
7:00 a.m. to 7:29 a.m. - Males: Kapalua:
23.3% (19)Hawaii:
12.9% (44,668)
7:30 a.m. to 7:59 a.m. - Males: Kapalua:
3.3% (3)Hawaii:
8.0% (27,809)
8:00 a.m. to 8:29 a.m. - Males: Kapalua:
2.6% (2)Hawaii:
8.0% (27,715)
8:30 a.m. to 8:59 a.m. - Males: Kapalua:
8.9% (7)Hawaii:
3.4% (11,750)
9:00 a.m. to 9:59 a.m. - Males: Kapalua:
7.5% (6)Hawaii:
6.0% (20,924)
10:00 a.m. to 10:59 a.m. - Males: Kapalua:
22.3% (18)Hawaii:
2.5% (8,536)
12:00 p.m. to 3:59 p.m. - Males: Kapalua:
6.9% (6)Hawaii:
7.4% (25,480)
4:00 p.m. to 11:59 p.m. - Males: Kapalua:
8.3% (7)Hawaii:
4.6% (15,898)
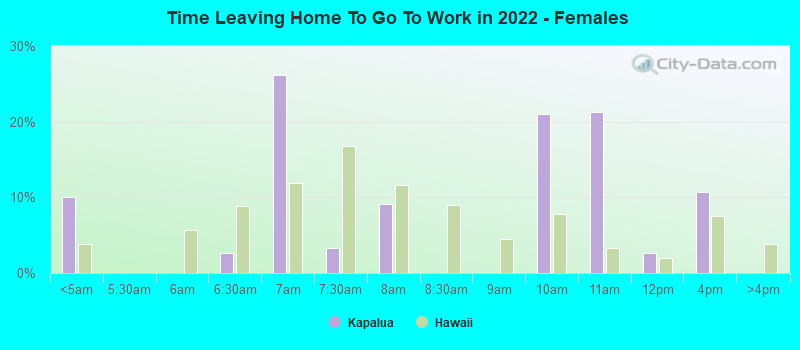
12:00 a.m. to 4:59 a.m. - Females: Kapalua:
10.1% (5)Hawaii:
3.9% (11,053)
6:00 a.m. to 6:29 a.m. - Females: Kapalua:
2.6% (1)Hawaii:
8.8% (25,335)
6:30 a.m. to 6:59 a.m. - Females: Kapalua:
26.2% (14)Hawaii:
11.9% (34,158)
7:00 a.m. to 7:29 a.m. - Females: Kapalua:
3.4% (2)Hawaii:
16.8% (48,214)
7:30 a.m. to 7:59 a.m. - Females: Kapalua:
9.1% (5)Hawaii:
11.6% (33,179)
9:00 a.m. to 9:59 a.m. - Females: Kapalua:
21.0% (11)Hawaii:
7.8% (22,445)
10:00 a.m. to 10:59 a.m. - Females: Kapalua:
21.2% (11)Hawaii:
3.3% (9,555)
11:00 a.m. to 11:59 a.m. - Females: Kapalua:
2.6% (1)Hawaii:
2.0% (5,611)
12:00 p.m. to 3:59 p.m. - Females: Kapalua:
10.7% (6)Hawaii:
7.5% (21,524)
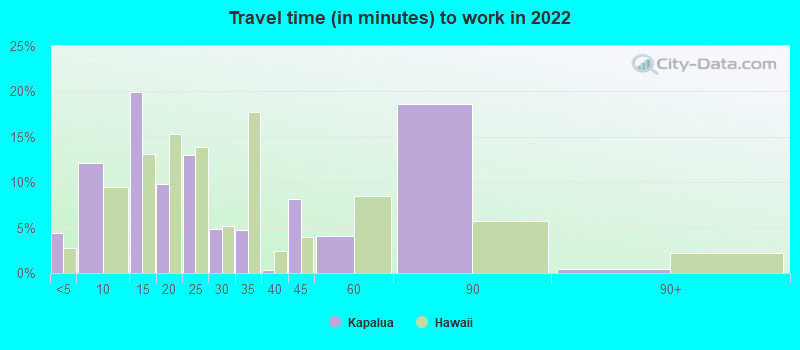
Travel time to work Percentage of workers working in this county: 100.0%Number of people working at home: 29 (17.8% of all workers )
Less than 5 minutes: Kapalua:
4.4% (68)Hawaii:
2.7% (17,084)
5 to 9 minutes: Kapalua:
12.1% (186)Hawaii:
9.4% (59,655)
10 to 14 minutes: Kapalua:
20.0% (306)Hawaii:
13.1% (83,192)
15 to 19 minutes: Kapalua:
9.8% (151)Hawaii:
15.3% (97,052)
20 to 24 minutes: Kapalua:
13.0% (199)Hawaii:
13.8% (87,546)
25 to 29 minutes: Kapalua:
4.9% (75)Hawaii:
5.1% (32,500)
30 to 34 minutes: Kapalua:
4.8% (73)Hawaii:
17.8% (112,398)
35 to 39 minutes: Kapalua:
0.4% (5)Hawaii:
2.4% (15,269)
40 to 44 minutes: Kapalua:
8.1% (124)Hawaii:
4.0% (25,103)
45 to 59 minutes: Kapalua:
4.1% (63)Hawaii:
8.5% (53,527)
60 to 89 minutes: Kapalua:
18.6% (286)Hawaii:
5.7% (36,220)
90 or more minutes: Kapalua:
0.4% (6)Hawaii:
2.1% (13,592)
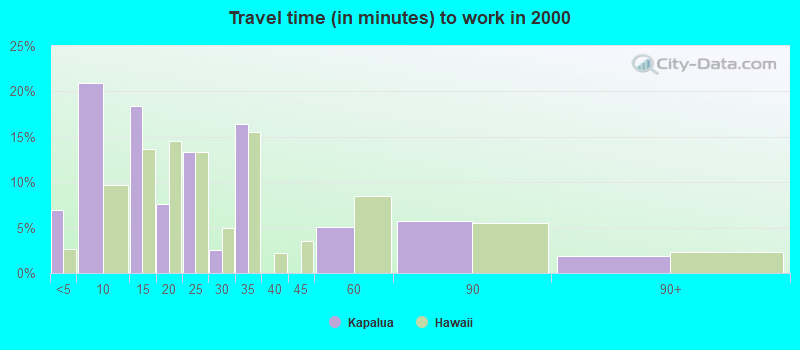
Less than 5 minutes: Kapalua:
7.0% (11)Hawaii:
2.6% (14,748)
5 to 9 minutes: Kapalua:
20.9% (33)Hawaii:
9.6% (54,341)
10 to 14 minutes: Kapalua:
18.4% (29)Hawaii:
13.7% (77,207)
15 to 19 minutes: Kapalua:
7.6% (12)Hawaii:
14.5% (81,891)
20 to 24 minutes: Kapalua:
13.3% (21)Hawaii:
13.4% (75,329)
25 to 29 minutes: Kapalua:
2.5% (4)Hawaii:
5.0% (28,106)
30 to 34 minutes: Kapalua:
16.5% (26)Hawaii:
15.5% (87,508)
45 to 59 minutes: Kapalua:
5.1% (8)Hawaii:
8.5% (48,025)
60 to 89 minutes: Kapalua:
5.7% (9)Hawaii:
5.6% (31,296)
90 or more minutes: Kapalua:
1.9% (3)Hawaii:
2.3% (12,880)
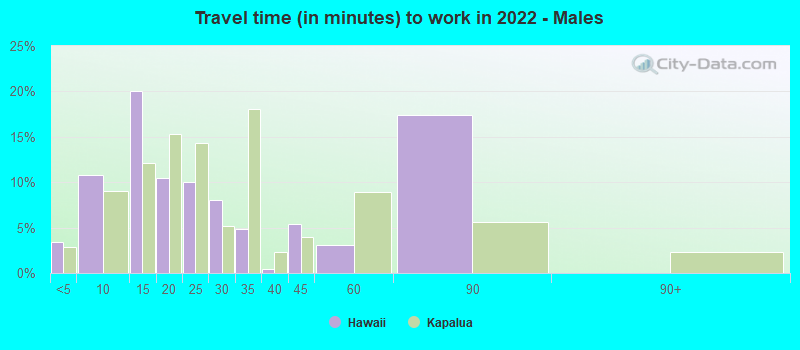
Less than 5 minutes - Males: Kapalua:
3.4% (28)Hawaii:
2.8% (9,835)
5 to 9 minutes - Males: Kapalua:
10.8% (90)Hawaii:
9.0% (31,292)
10 to 14 minutes - Males: Kapalua:
20.1% (167)Hawaii:
12.1% (42,049)
15 to 19 minutes - Males: Kapalua:
10.4% (87)Hawaii:
15.4% (53,144)
20 to 24 minutes - Males: Kapalua:
10.0% (83)Hawaii:
14.3% (49,594)
25 to 29 minutes - Males: Kapalua:
8.1% (67)Hawaii:
5.2% (17,973)
30 to 34 minutes - Males: Kapalua:
4.9% (41)Hawaii:
18.0% (62,421)
35 to 39 minutes - Males: Kapalua:
0.5% (4)Hawaii:
2.3% (8,062)
40 to 44 minutes - Males: Kapalua:
5.5% (45)Hawaii:
4.0% (13,710)
45 to 59 minutes - Males: Kapalua:
3.1% (26)Hawaii:
8.9% (30,747)
60 to 89 minutes - Males: Kapalua:
17.4% (145)Hawaii:
5.6% (19,392)
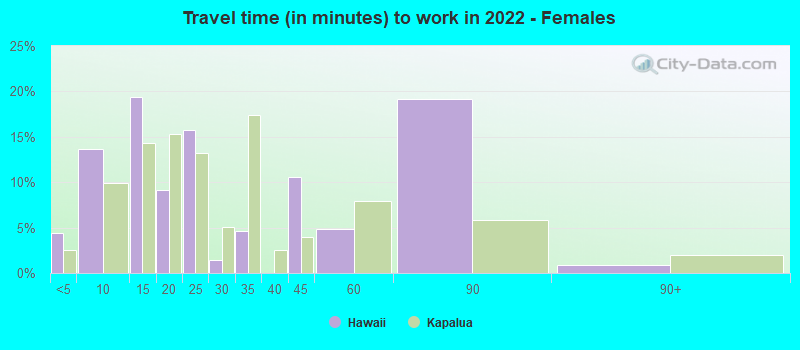
Less than 5 minutes - Females: Kapalua:
4.4% (31)Hawaii:
2.5% (7,249)
5 to 9 minutes - Females: Kapalua:
13.6% (96)Hawaii:
9.9% (28,363)
10 to 14 minutes - Females: Kapalua:
19.4% (136)Hawaii:
14.3% (41,143)
15 to 19 minutes - Females: Kapalua:
9.1% (64)Hawaii:
15.3% (43,908)
20 to 24 minutes - Females: Kapalua:
15.7% (110)Hawaii:
13.2% (37,952)
25 to 29 minutes - Females: Kapalua:
1.5% (10)Hawaii:
5.1% (14,527)
30 to 34 minutes - Females: Kapalua:
4.6% (32)Hawaii:
17.4% (49,977)
40 to 44 minutes - Females: Kapalua:
10.6% (74)Hawaii:
4.0% (11,393)
45 to 59 minutes - Females: Kapalua:
4.9% (34)Hawaii:
7.9% (22,780)
60 to 89 minutes - Females: Kapalua:
19.2% (134)Hawaii:
5.9% (16,828)
90 or more minutes - Females: Kapalua:
0.9% (6)Hawaii:
2.0% (5,603)
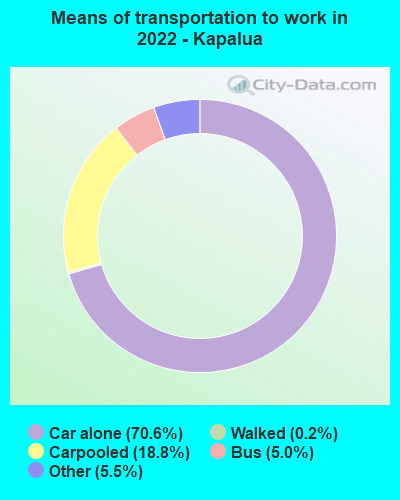
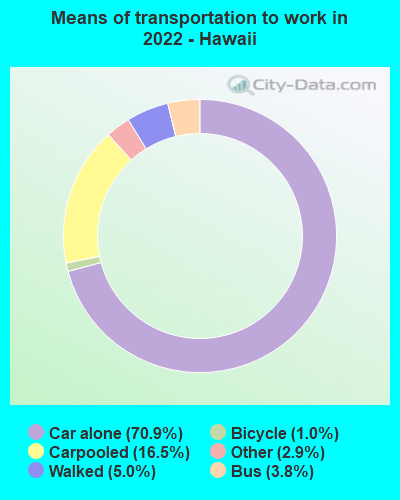
Means of transportation to work Drove car alone: Kapalua:
70.6% (1,110)Hawaii:
70.9% (195,658)
Carpooled: Kapalua:
18.8% (295)Hawaii:
16.5% (55,182)
Bus: Kapalua:
5.0% (79)Hawaii:
3.8% (13,591)
Walked: Kapalua:
0.2% (3)Hawaii:
5.0% (14,587)
Other means: Kapalua:
5.5% (86)Hawaii:
2.9% (6,552)
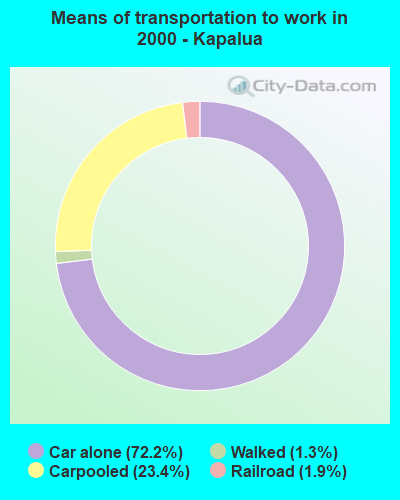
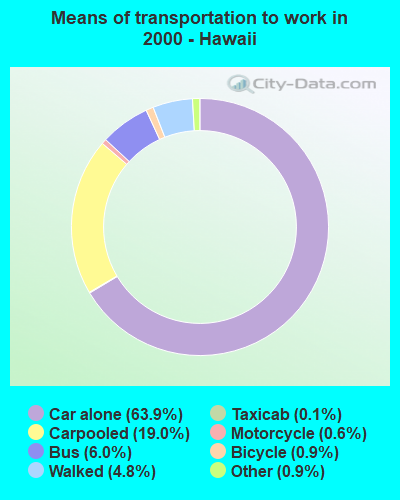
Drove car alone: Kapalua:
72.2% (114)Hawaii:
63.9% (359,916)
Carpooled: Kapalua:
23.4% (37)Hawaii:
19.0% (107,191)
Railroad: Kapalua:
1.9% (3)Hawaii:
0.0% (66)
Walked: Kapalua:
1.3% (2)Hawaii:
4.8% (27,134)
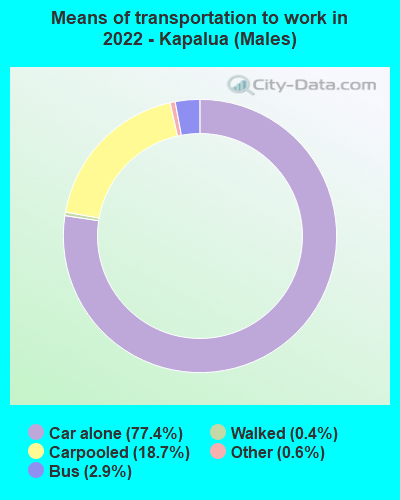
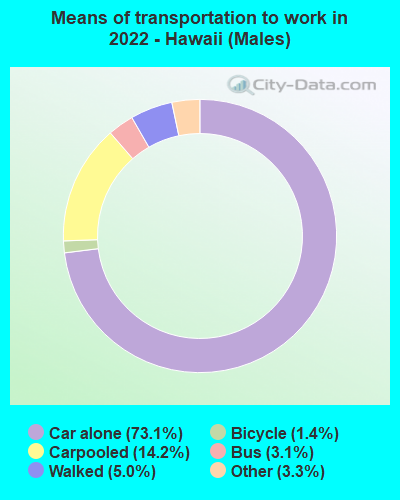
Drove car alone - Males: Kapalua:
77.4% (658)Hawaii:
73.1% (195,658)
Carpooled - Males: Kapalua:
18.7% (159)Hawaii:
14.2% (55,182)
Bus - Males: Kapalua:
2.9% (25)Hawaii:
3.1% (13,591)
Walked - Males: Kapalua:
0.4% (3)Hawaii:
5.0% (14,587)
Other means - Males: Kapalua:
0.6% (5)Hawaii:
3.3% (6,552)
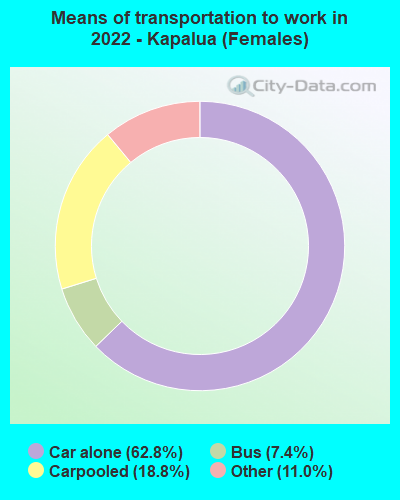
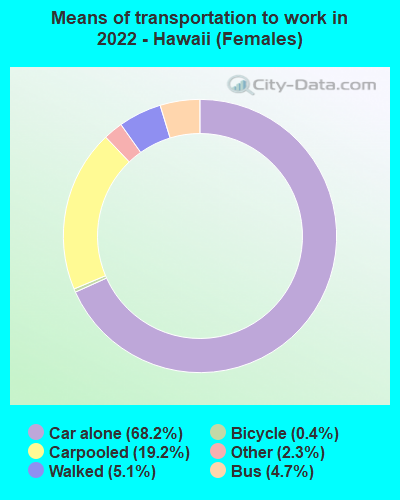
Drove car alone - Females: Kapalua:
62.8% (454)Hawaii:
68.2% (195,658)
Carpooled - Females: Kapalua:
18.8% (136)Hawaii:
19.2% (55,182)
Bus - Females: Kapalua:
7.4% (53)Hawaii:
4.7% (13,591)
Other means - Females: Kapalua:
11.0% (80)Hawaii:
2.3% (6,552)
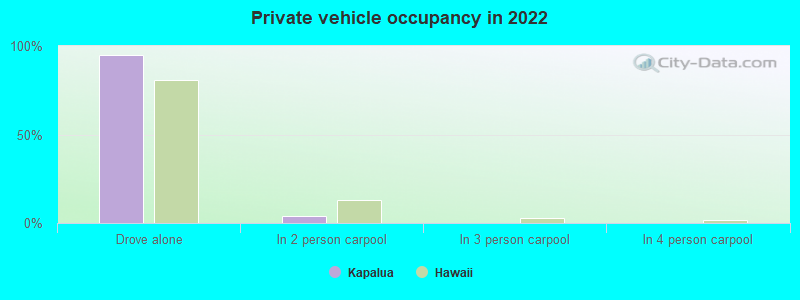
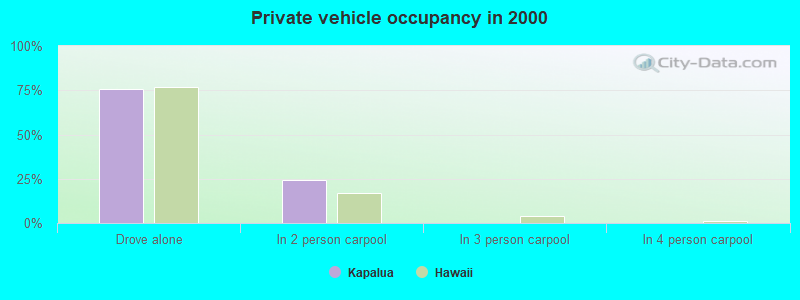
Private vehicle occupancy Drove alone: Kapalua:
95.0% (122)Hawaii:
81.1% (447,862)
In 2 person carpool: Kapalua:
4.2% (5)Hawaii:
13.2% (73,111)
Drove alone: Kapalua:
75.5% (114)Hawaii:
77.1% (359,916)
In 2 person carpool: Kapalua:
24.5% (37)Hawaii:
17.1% (80,034)
Class of workers
Employee of private company: Kapalua:
72.4% (134)Hawaii:
58.3% (393,526)
Self-employed in own incorporated business: Kapalua:
6.6% (12)Hawaii:
4.4% (29,437)
Private not-for-profit wage and salary workers: Kapalua:
6.6% (12)Hawaii:
8.1% (54,424)
Federal government workers: Kapalua:
1.7% (3)Hawaii:
7.3% (48,985)
Self-employed workers in own not incorporated business: Kapalua:
12.7% (24)Hawaii:
7.1% (47,803)
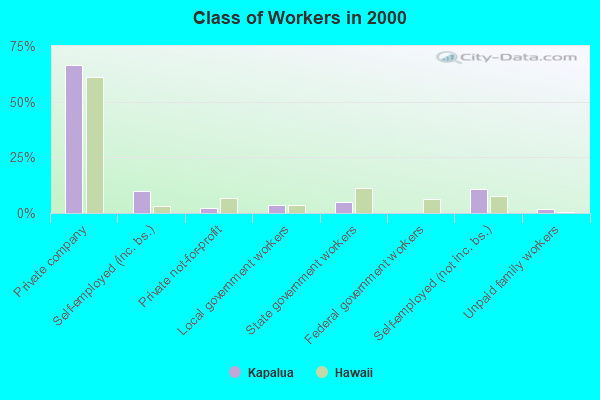
Employee of private company: Kapalua:
66.7% (110)Hawaii:
61.1% (328,465)
Self-employed in own incorporated business: Kapalua:
9.7% (16)Hawaii:
3.2% (17,161)
Private not-for-profit wage and salary workers: Kapalua:
2.4% (4)Hawaii:
6.7% (35,980)
Local government workers: Kapalua:
3.6% (6)Hawaii:
3.5% (18,685)
State government workers: Kapalua:
4.8% (8)Hawaii:
11.2% (60,085)
Self-employed workers in own not incorporated business: Kapalua:
10.9% (18)Hawaii:
7.6% (41,109)
Unpaid family workers: Kapalua:
1.8% (3)Hawaii:
0.4% (2,195)
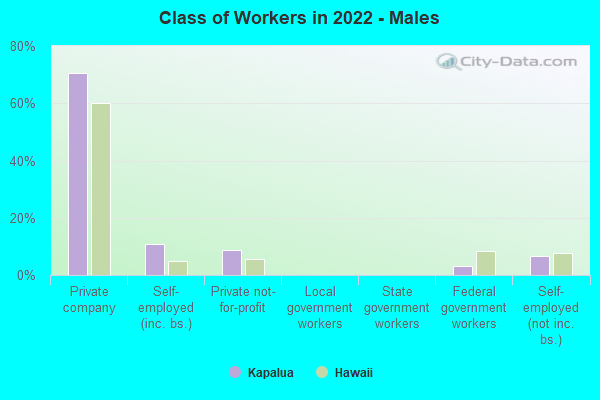
Employee of private company - Males: Kapalua:
70.7% (66)Hawaii:
60.0% (207,078)
Self-employed in own incorporated business - Males: Kapalua:
10.9% (10)Hawaii:
4.9% (17,086)
Private not-for-profit wage and salary workers - Males: Kapalua:
8.7% (8)Hawaii:
5.6% (19,293)
Federal government workers - Males: Kapalua:
3.3% (3)Hawaii:
8.5% (29,278)
Self-employed workers in own not incorporated business - Males: Kapalua:
6.5% (6)Hawaii:
7.6% (26,085)
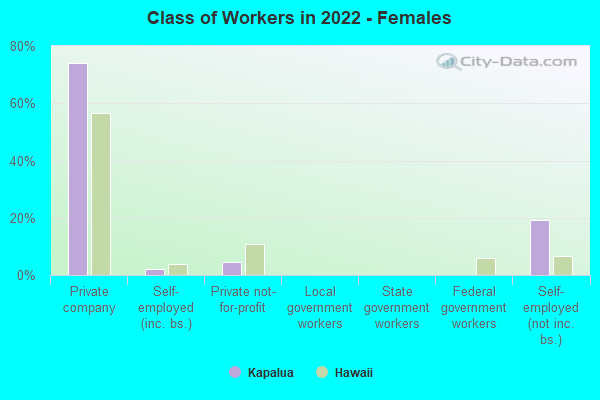
Employee of private company - Females: Kapalua:
74.2% (67)Hawaii:
56.6% (186,448)
Self-employed in own incorporated business - Females: Kapalua:
2.2% (2)Hawaii:
3.8% (12,351)
Private not-for-profit wage and salary workers - Females: Kapalua:
4.5% (4)Hawaii:
10.7% (35,131)
Self-employed workers in own not incorporated business - Females: Kapalua:
19.1% (17)Hawaii:
6.6% (21,718)