Work and Jobs in New Haven, West Virginia (WV) Detailed Stats
Data:
Unemployment (%)
Unemployment (% change since 2000)
Unemployment (%) - White
Unemployment (% change since 2000) - White
Unemployment (%) - Black or African American
Unemployment (% change since 2000) - Black or African American
Unemployment (%) - Asian
Unemployment (% change since 2000) - Asian
Unemployment (%) - Hispanic or Latino
Unemployment (% change since 2000) - Hispanic or Latino
Unemployment (%) - American Indian and Alaska Native
Unemployment (% change since 2000) - American Indian and Alaska Native
Unemployment (%) - Multirace
Unemployment (% change since 2000) - Multirace
Unemployment (%) - Other Race
Unemployment (% change since 2000) - Other Race
Industry diversity
Most Common Industries - Agriculture, forestry, fishing and hunting, and mining (%)
Most Common Industries - Agriculture, forestry, fishing and hunting (%)
Most Common Industries - Mining, quarrying, and oil and gas extraction (%)
Most Common Industries - Construction (%)
Most Common Industries - Manufacturing (%)
Most Common Industries - Wholesale trade (%)
Most Common Industries - Retail trade (%)
Most Common Industries - Transportation and warehousing, and utilities (%)
Most Common Industries - Transportation and warehousing (%)
Most Common Industries - Utilities (%)
Most Common Industries - Information (%)
Most Common Industries - Finance and insurance, and real estate and rental and leasing (%)
Most Common Industries - Finance and insurance (%)
Most Common Industries - Real estate and rental and leasing (%)
Most Common Industries - Professional, scientific, and management, and administrative and waste management services (%)
Most Common Industries - Professional, scientific, and technical services (%)
Most Common Industries - Management of companies and enterprises (%)
Most Common Industries - Administrative and support and waste management services (%)
Most Common Industries - Educational services, and health care and social assistance (%)
Most Common Industries - Educational services (%)
Most Common Industries - Health care and social assistance (%)
Most Common Industries - Arts, entertainment, and recreation, and accommodation and food services (%)
Most Common Industries - Arts, entertainment, and recreation (%)
Most Common Industries - Accommodation and food services (%)
Most Common Industries - Other services, except public administration (%)
Most Common Industries - Public administration (%)
Occupation diversity
Most Common Occupations - Management, business, science, and arts occupations (%)
Most Common Occupations - Management, business, and financial occupations (%)
Most Common Occupations - Management occupations (%)
Most Common Occupations - Business and financial operations occupations (%)
Most Common Occupations - Computer, engineering, and science occupations (%)
Most Common Occupations - Computer and mathematical occupations (%)
Most Common Occupations - Architecture and engineering occupations (%)
Most Common Occupations - Life, physical, and social science occupations (%)
Most Common Occupations - Education, legal, community service, arts, and media occupations (%)
Most Common Occupations - Community and social service occupations (%)
Most Common Occupations - Legal occupations (%)
Most Common Occupations - Education, training, and library occupations (%)
Most Common Occupations - Arts, design, entertainment, sports, and media occupations (%)
Most Common Occupations - Healthcare practitioners and technical occupations (%)
Most Common Occupations - Health diagnosing and treating practitioners and other technical occupations (%)
Most Common Occupations - Health technologists and technicians (%)
Most Common Occupations - Service occupations (%)
Most Common Occupations - Healthcare support occupations (%)
Most Common Occupations - Protective service occupations (%)
Most Common Occupations - Fire fighting and prevention, and other protective service workers including supervisors (%)
Most Common Occupations - Law enforcement workers including supervisors (%)
Most Common Occupations - Food preparation and serving related occupations (%)
Most Common Occupations - Building and grounds cleaning and maintenance occupations (%)
Most Common Occupations - Personal care and service occupations (%)
Most Common Occupations - Sales and office occupations (%)
Most Common Occupations - Sales and related occupations (%)
Most Common Occupations - Office and administrative support occupations (%)
Most Common Occupations - Natural resources, construction, and maintenance occupations (%)
Most Common Occupations - Farming, fishing, and forestry occupations (%)
Most Common Occupations - Construction and extraction occupations (%)
Most Common Occupations - Installation, maintenance, and repair occupations (%)
Most Common Occupations - Production, transportation, and material moving occupations (%)
Most Common Occupations - Production occupations (%)
Most Common Occupations - Transportation occupations (%)
Most Common Occupations - Material moving occupations (%)
Private vehicle occupancy - Drove alone (% change since 2000)
Private vehicle occupancy - Carpooled (%)
Private vehicle occupancy - Carpooled (% change since 2000)
Private vehicle occupancy - In 2-person carpool (%)
Private vehicle occupancy - In 2-person carpool (% change since 2000)
Private vehicle occupancy - In 3-person carpool (%)
Private vehicle occupancy - In 3-person carpool (% change since 2000)
Private vehicle occupancy - In 4-person carpool (%)
Private vehicle occupancy - In 4-person carpool (% change since 2000)
Private vehicle occupancy - In 5- or 6-person carpool (%)
Private vehicle occupancy - In 5- or 6-person carpool (% change since 2000)
Private vehicle occupancy - In 7-or-more-person carpool (%)
Private vehicle occupancy - In 7-or-more-person carpool (% change since 2000)
Time Leaving Home To Go To Work - 12:00 a.m. to 4:59 a.m. (%)
Time Leaving Home To Go To Work - 12:00 a.m. to 4:59 a.m. (% change since 2000)
Time Leaving Home To Go To Work - 5:00 a.m. to 5:59 a.m. (%)
Time Leaving Home To Go To Work - 5:00 a.m. to 5:59 a.m. (% change since 2000)
Time Leaving Home To Go To Work - 6:00 a.m. to 6:59 a.m. (%)
Time Leaving Home To Go To Work - 6:00 a.m. to 6:59 a.m. (% change since 2000)
Time Leaving Home To Go To Work - 7:00 a.m. to 7:59 a.m. (%)
Time Leaving Home To Go To Work - 7:00 a.m. to 7:59 a.m. (% change since 2000)
Time Leaving Home To Go To Work - 8:00 a.m. to 8:59 a.m. (%)
Time Leaving Home To Go To Work - 8:00 a.m. to 8:59 a.m. (% change since 2000)
Time Leaving Home To Go To Work - 9:00 a.m. to 9:59 a.m. (%)
Time Leaving Home To Go To Work - 9:00 a.m. to 9:59 a.m. (% change since 2000)
Time Leaving Home To Go To Work - 10:00 a.m. to 10:59 a.m. (%)
Time Leaving Home To Go To Work - 10:00 a.m. to 10:59 a.m. (% change since 2000)
Time Leaving Home To Go To Work - 11:00 a.m. to 11:59 a.m. (%)
Time Leaving Home To Go To Work - 11:00 a.m. to 11:59 a.m. (% change since 2000)
Time Leaving Home To Go To Work - 12:00 p.m. to 3:59 p.m. (%)
Time Leaving Home To Go To Work - 12:00 p.m. to 3:59 p.m. (% change since 2000)
Time Leaving Home To Go To Work - 4:00 p.m. to 11:59 p.m. (%)
Time Leaving Home To Go To Work - 4:00 p.m. to 11:59 p.m. (% change since 2000)
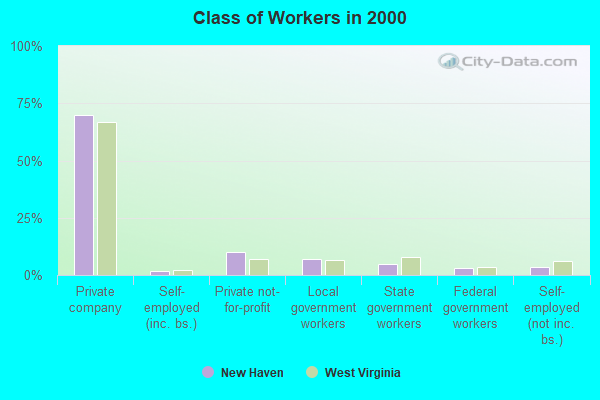
Class of Workers - Employee of private company (%)
Class of Workers - Employee of private company (% change since 2000)
Class of Workers - Self-employed in own incorporated business (%)
Class of Workers - Self-employed in own incorporated business (% change since 2000)
Class of Workers - Private not-for-profit wage and salary workers (%)
Class of Workers - Private not-for-profit wage and salary workers (% change since 2000)
Class of Workers - Local government workers (%)
Class of Workers - Local government workers (% change since 2000)
Class of Workers - State government workers (%)
Class of Workers - State government workers (% change since 2000)
Class of Workers - Federal government workers (%)
Class of Workers - Federal government workers (% change since 2000)
Class of Workers - Self-employed workers in own not incorporated business and Unpaid family workers (%)
Class of Workers - Self-employed workers in own not incorporated business and Unpaid family workers (% change since 2000)
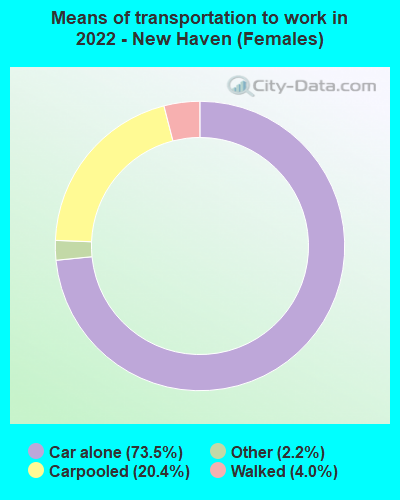
Means of transportation to work - Drove car alone (%)
Means of transportation to work - Drove car alone (% change since 2000)
Means of transportation to work - Carpooled (%)
Means of transportation to work - Carpooled (% change since 2000)
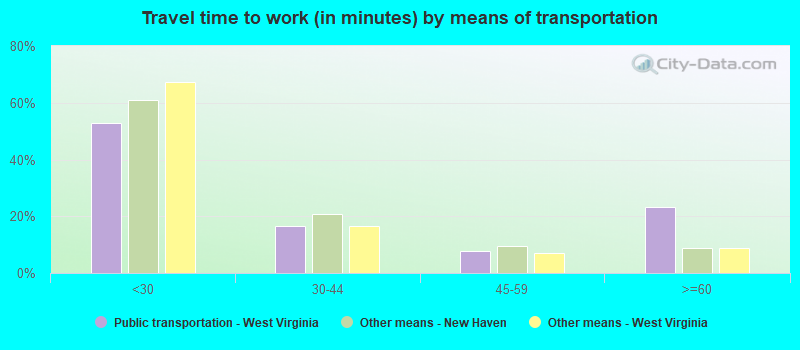
Means of transportation to work - Public transportation (%)
Means of transportation to work - Public transportation (% change since 2000)
Means of transportation to work - Bus or trolley bus (%)
Means of transportation to work - Bus or trolley bus (% change since 2000)
Means of transportation to work - Streetcar or trolley car (%)
Means of transportation to work - Streetcar or trolley car (% change since 2000)
Means of transportation to work - Subway or elevated (%)
Means of transportation to work - Subway or elevated (% change since 2000)
Means of transportation to work - Railroad (%)
Means of transportation to work - Railroad (% change since 2000)
Means of transportation to work - Ferryboat (%)
Means of transportation to work - Ferryboat (% change since 2000)
Means of transportation to work - Taxicab (%)
Means of transportation to work - Taxicab (% change since 2000)
Means of transportation to work - Motorcycle (%)
Means of transportation to work - Motorcycle (% change since 2000)
Means of transportation to work - Bicycle (%)
Means of transportation to work - Bicycle (% change since 2000)
Means of transportation to work - Walked (%)
Means of transportation to work - Walked (% change since 2000)
Means of transportation to work - Other means (%)
Means of transportation to work - Other means (% change since 2000)
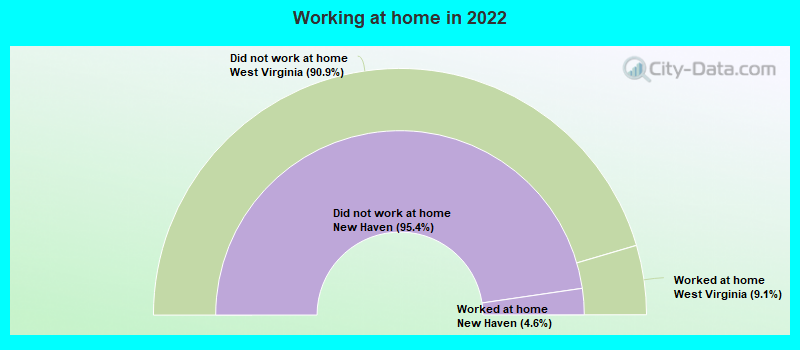
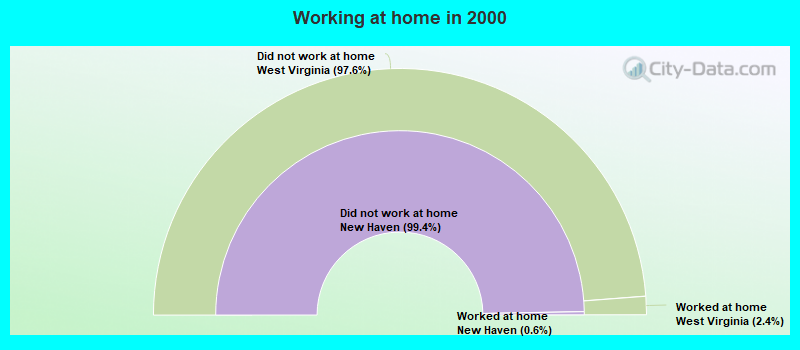
Working at home (%)
Working at home (% change since 2000)
Travel time to work - Less than 5 minutes (%)
Travel time to work - Less than 5 minutes (% change since 2000)
Travel time to work - 5 to 9 minutes (%)
Travel time to work - 5 to 9 minutes (% change since 2000)
Travel time to work - 10 to 19 minutes (%)
Travel time to work - 10 to 19 minutes (% change since 2000)
Travel time to work - 20 to 29 minutes (%)
Travel time to work - 20 to 29 minutes (% change since 2000)
Travel time to work - 30 to 39 minutes (%)
Travel time to work - 30 to 39 minutes (% change since 2000)
Travel time to work - 40 to 59 minutes (%)
Travel time to work - 40 to 59 minutes (% change since 2000)
Travel time to work - 60 to 89 minutes (%)
Travel time to work - 60 to 89 minutes (% change since 2000)
Travel time to work - 90 or more minutes (%)
Travel time to work - 90 or more minutes (% change since 2000)
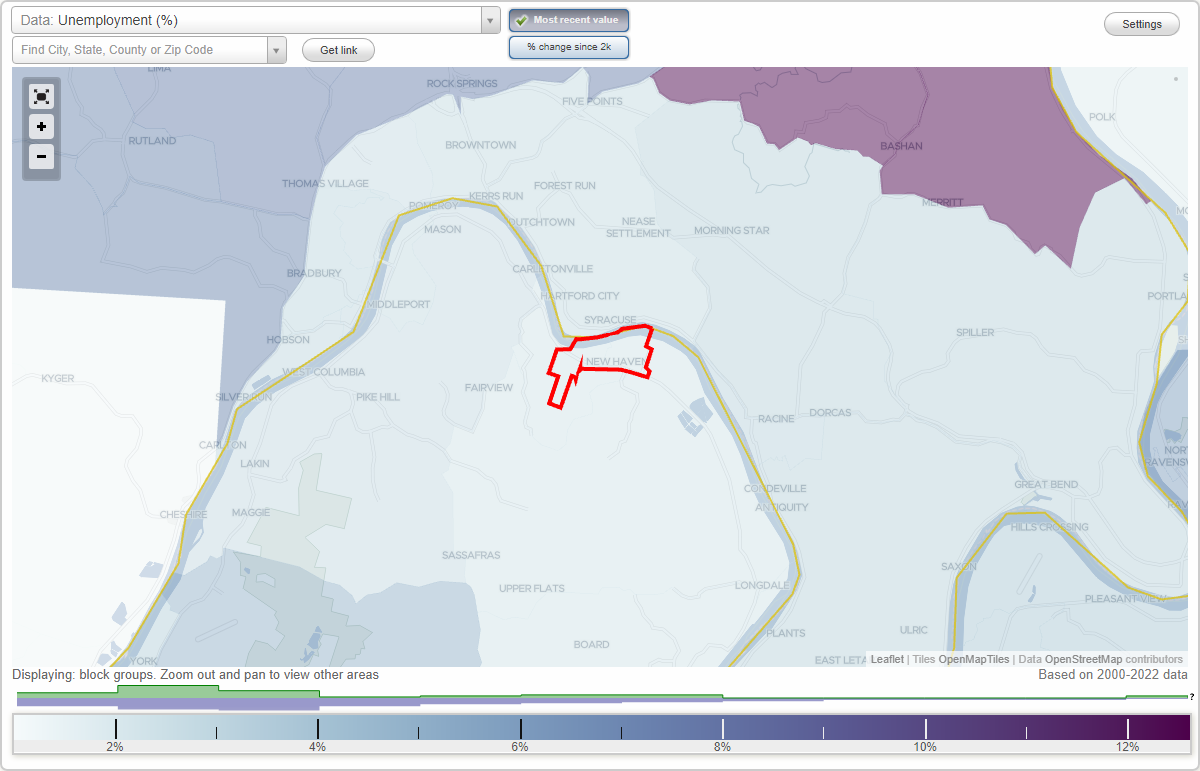
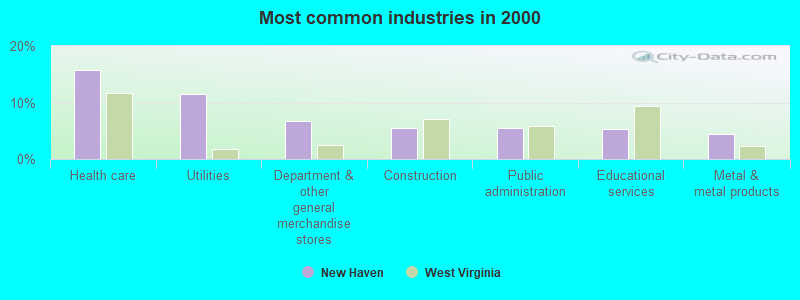
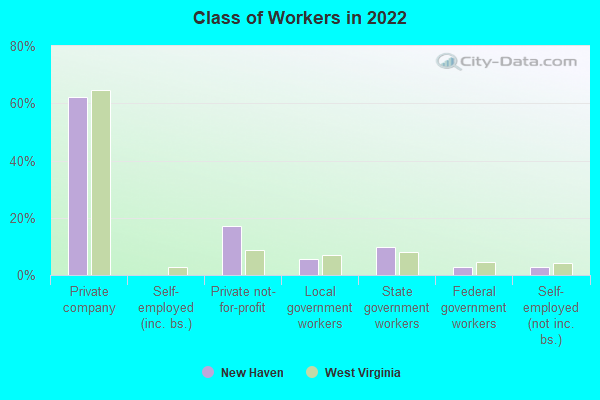
The most common industries in New Haven are: Health care (15.8% of civilian employees), Utilities (11.5% of civilian employees), Department & other general merchandise stores (6.6% of civilian employees). 65.1% of workers work in Mason County and 3.5% of all workers work at home. 62.0% of workers are employees of private companies, which is 4.0% less than the rate of 64.5% across the entire state of West Virginia.
Whole page based on the data from 2000 / 2022 when the population of New Haven, West Virginia was 1,559 / 1,744
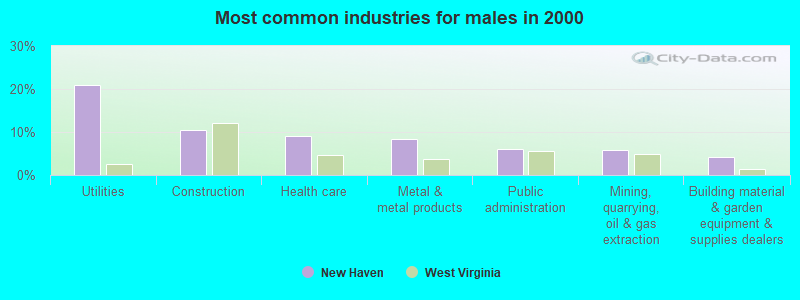
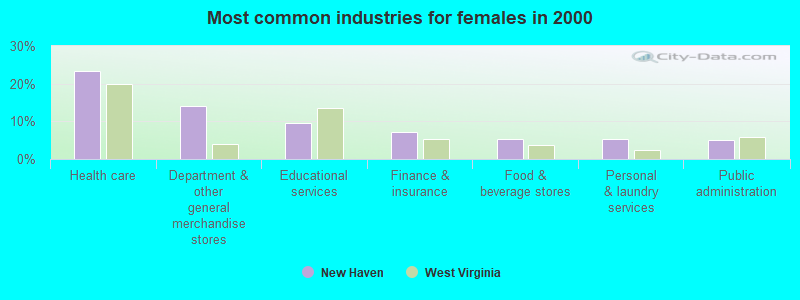
Most common industries
Most common industries Industry All Males Females
Health care 15.8% 9.2% 23.3% Utilities 11.5% 21.0% 0.8% Department and other general merchandise stores 6.6% 0.0% 14.1% Construction 5.6% 10.5% 0.0% Public administration 5.6% 6.1% 5.0% Educational services 5.4% 1.7% 9.5% Metal and metal products 4.5% 8.5% 0.0% Finance and insurance 3.4% 0.0% 7.3% Mining, quarrying, and oil and gas extraction 3.1% 5.8% 0.0% Accommodation and food services 3.1% 1.4% 5.0% Food and beverage stores 2.5% 0.0% 5.3% Religious, grantmaking, civic, professional, and similar organizations 2.5% 0.7% 4.6% Personal and laundry services 2.5% 0.0% 5.3% Building material and garden equipment and supplies dealers 2.3% 4.1% 0.4% Furniture and home furnishings, and household appliance stores 2.2% 2.4% 1.9% Used merchandise, gift, novelty, and souvenir, and other miscellaneous stores 2.0% 2.0% 1.9% Motor vehicle and parts dealers 2.0% 3.1% 0.8% Professional, scientific, and technical services 1.6% 1.0% 2.3% Plastics and rubber products 1.6% 3.1% 0.0% Chemicals 1.4% 2.7% 0.0% Transportation equipment 1.4% 2.7% 0.0% Agriculture, forestry, fishing and hunting 1.3% 1.0% 1.5% Social assistance 1.3% 0.0% 2.7% Administrative and support and waste management services 1.3% 0.0% 2.7% Food 1.1% 2.0% 0.0% Data processing, libraries, and other information services 1.1% 0.0% 2.3% Other transportation, and support activities, and couriers 1.1% 2.0% 0.0% Pharmacies and drug stores 1.1% 1.0% 1.1% Truck transportation 0.9% 1.7% 0.0% U. S. Postal service 0.9% 1.7% 0.0% Miscellaneous nondurable goods merchant wholesalers 0.7% 0.7% 0.8% Broadcasting and telecommunications 0.5% 1.0% 0.0% Repair and maintenance 0.5% 1.0% 0.0% Gasoline stations 0.4% 0.0% 0.8% Electrical equipment, appliances, and components 0.4% 0.7% 0.0% Retail florists 0.4% 0.0% 0.8% Rail transportation 0.4% 0.7% 0.0% Arts, entertainment, and recreation 0.4% 0.7% 0.0%
Unemployment in New Haven Unemployment by race in 2022
Unemployment rate for White non-Hispanic residents 6.5% Males0.6% FemalesUnemployment by race in 2000
Unemployment rate for White non-Hispanic residents 13.5% Males2.6% Females
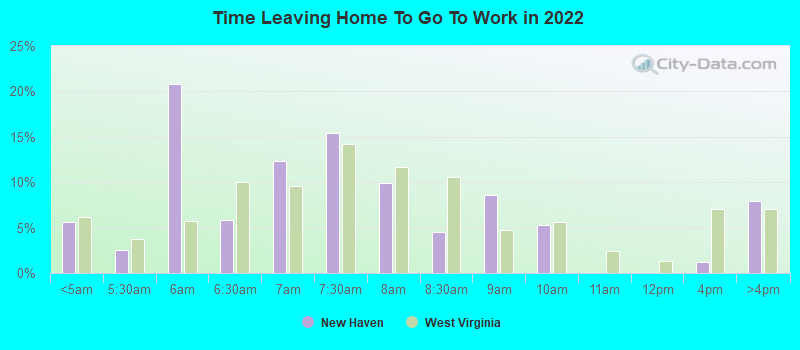
Time leaving home to go to work 12:00 a.m. to 4:59 a.m.: New Haven:
5.6% (43)West Virginia:
6.2% (40,785)
5:00 a.m. to 5:29 a.m.: New Haven:
2.5% (19)West Virginia:
3.7% (24,623)
5:30 a.m. to 5:59 a.m.: New Haven:
20.8% (158)West Virginia:
5.7% (37,599)
6:00 a.m. to 6:29 a.m.: New Haven:
5.8% (44)West Virginia:
10.0% (66,185)
6:30 a.m. to 6:59 a.m.: New Haven:
12.4% (94)West Virginia:
9.6% (63,233)
7:00 a.m. to 7:29 a.m.: New Haven:
15.4% (117)West Virginia:
14.2% (93,622)
7:30 a.m. to 7:59 a.m.: New Haven:
10.0% (76)West Virginia:
11.7% (77,435)
8:00 a.m. to 8:29 a.m.: New Haven:
4.5% (35)West Virginia:
10.6% (69,988)
8:30 a.m. to 8:59 a.m.: New Haven:
8.5% (65)West Virginia:
4.7% (31,179)
9:00 a.m. to 9:59 a.m.: New Haven:
5.3% (41)West Virginia:
5.6% (37,311)
12:00 p.m. to 3:59 p.m.: New Haven:
1.2% (9)West Virginia:
7.0% (46,555)
4:00 p.m. to 11:59 p.m.: New Haven:
7.9% (60)West Virginia:
7.1% (46,937)
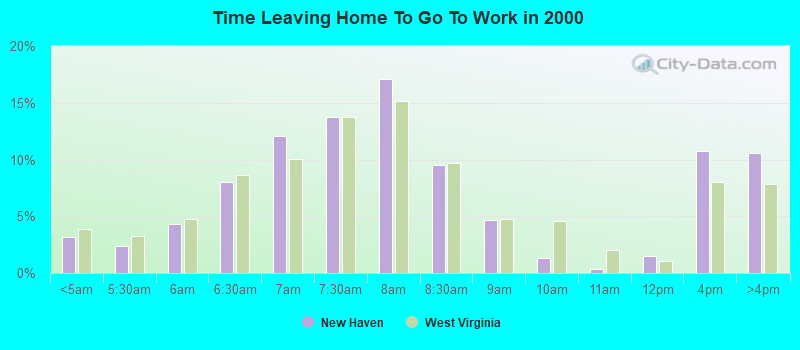
<5am: New Haven:
3.2% (17)West Virginia:
3.9% (28,047)
5:30am: New Haven:
2.4% (13)West Virginia:
3.2% (23,235)
6am: New Haven:
4.3% (23)West Virginia:
4.8% (34,464)
6:30am: New Haven:
8.0% (43)West Virginia:
8.6% (61,784)
7am: New Haven:
12.1% (65)West Virginia:
10.1% (72,395)
7:30am: New Haven:
13.8% (74)West Virginia:
13.8% (98,948)
8am: New Haven:
17.1% (92)West Virginia:
15.2% (108,921)
8:30am: New Haven:
9.5% (51)West Virginia:
9.7% (69,399)
9am: New Haven:
4.6% (25)West Virginia:
4.7% (33,885)
10am: New Haven:
1.3% (7)West Virginia:
4.6% (33,112)
11am: New Haven:
0.4% (2)West Virginia:
2.1% (14,733)
12pm: New Haven:
1.5% (8)West Virginia:
1.1% (7,763)
4pm: New Haven:
10.8% (58)West Virginia:
8.1% (57,871)
>4pm: New Haven:
10.6% (57)West Virginia:
7.8% (56,126)
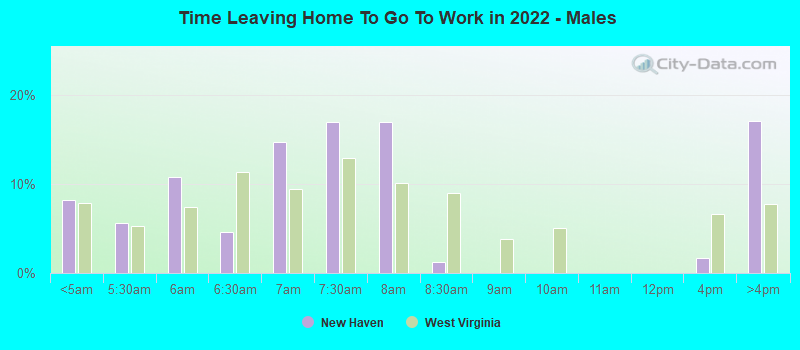
12:00 a.m. to 4:59 a.m. - Males: New Haven:
8.2% (30)West Virginia:
7.8% (27,728)
5:00 a.m. to 5:29 a.m. - Males: New Haven:
5.6% (20)West Virginia:
5.3% (18,680)
5:30 a.m. to 5:59 a.m. - Males: New Haven:
10.8% (39)West Virginia:
7.4% (26,205)
6:00 a.m. to 6:29 a.m. - Males: New Haven:
4.6% (17)West Virginia:
11.4% (40,309)
6:30 a.m. to 6:59 a.m. - Males: New Haven:
14.7% (53)West Virginia:
9.4% (33,409)
7:00 a.m. to 7:29 a.m. - Males: New Haven:
16.9% (61)West Virginia:
12.9% (45,886)
7:30 a.m. to 7:59 a.m. - Males: New Haven:
16.9% (61)West Virginia:
10.1% (35,698)
8:00 a.m. to 8:29 a.m. - Males: New Haven:
1.2% (4)West Virginia:
9.0% (32,021)
12:00 p.m. to 3:59 p.m. - Males: New Haven:
1.7% (6)West Virginia:
6.7% (23,594)
4:00 p.m. to 11:59 p.m. - Males: New Haven:
17.1% (62)West Virginia:
7.7% (27,448)
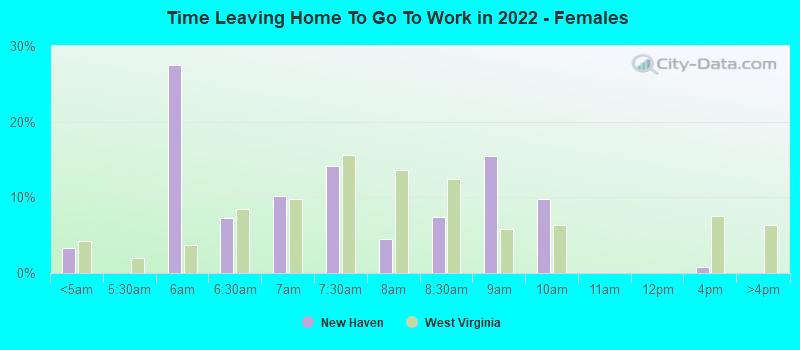
12:00 a.m. to 4:59 a.m. - Females: New Haven:
3.3% (13)West Virginia:
4.3% (13,057)
5:30 a.m. to 5:59 a.m. - Females: New Haven:
27.4% (110)West Virginia:
3.7% (11,394)
6:00 a.m. to 6:29 a.m. - Females: New Haven:
7.2% (29)West Virginia:
8.5% (25,876)
6:30 a.m. to 6:59 a.m. - Females: New Haven:
10.1% (40)West Virginia:
9.7% (29,824)
7:00 a.m. to 7:29 a.m. - Females: New Haven:
14.1% (56)West Virginia:
15.6% (47,736)
7:30 a.m. to 7:59 a.m. - Females: New Haven:
4.5% (18)West Virginia:
13.6% (41,737)
8:00 a.m. to 8:29 a.m. - Females: New Haven:
7.4% (30)West Virginia:
12.4% (37,967)
8:30 a.m. to 8:59 a.m. - Females: New Haven:
15.5% (62)West Virginia:
5.7% (17,593)
9:00 a.m. to 9:59 a.m. - Females: New Haven:
9.8% (39)West Virginia:
6.3% (19,245)
12:00 p.m. to 3:59 p.m. - Females: New Haven:
0.7% (3)West Virginia:
7.5% (22,961)
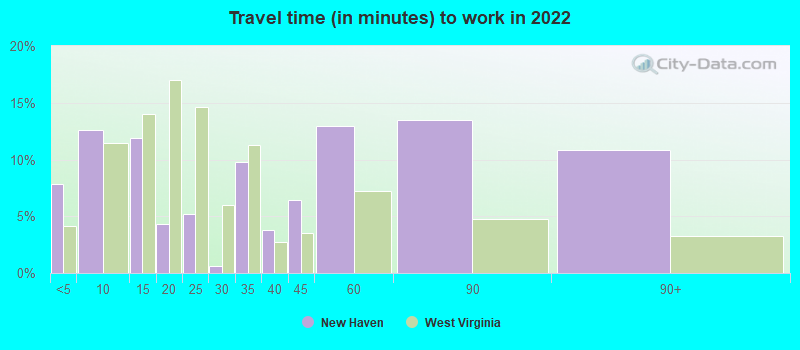
Travel time to work Percentage of workers working in this county: 65.1%Number of people working at home: 28 (3.5% of all workers )
Less than 5 minutes: New Haven:
7.8% (39)West Virginia:
4.1% (26,716)
5 to 9 minutes: New Haven:
12.6% (63)West Virginia:
11.4% (73,739)
10 to 14 minutes: New Haven:
11.9% (60)West Virginia:
14.0% (90,428)
15 to 19 minutes: New Haven:
4.3% (22)West Virginia:
17.0% (109,934)
20 to 24 minutes: New Haven:
5.2% (26)West Virginia:
14.6% (94,280)
25 to 29 minutes: New Haven:
0.6% (3)West Virginia:
6.0% (38,580)
30 to 34 minutes: New Haven:
9.8% (49)West Virginia:
11.3% (72,667)
35 to 39 minutes: New Haven:
3.8% (19)West Virginia:
2.7% (17,637)
40 to 44 minutes: New Haven:
6.4% (32)West Virginia:
3.5% (22,724)
45 to 59 minutes: New Haven:
13.0% (65)West Virginia:
7.2% (46,322)
60 to 89 minutes: New Haven:
13.5% (68)West Virginia:
4.8% (30,663)
90 or more minutes: New Haven:
10.8% (54)West Virginia:
3.3% (21,192)
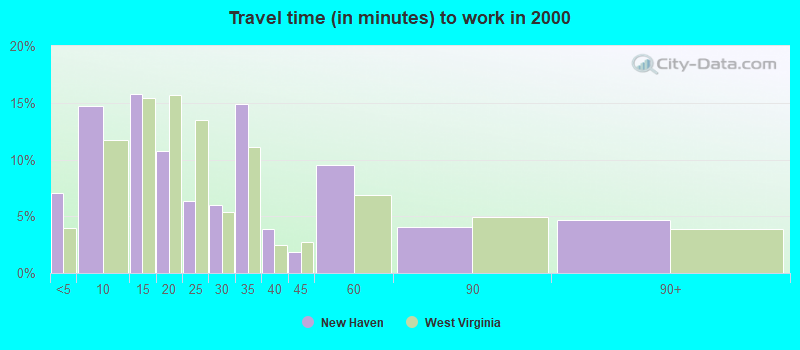
Less than 5 minutes: New Haven:
7.1% (38)West Virginia:
4.0% (28,589)
5 to 9 minutes: New Haven:
14.7% (79)West Virginia:
11.7% (83,929)
10 to 14 minutes: New Haven:
15.8% (85)West Virginia:
15.4% (110,704)
15 to 19 minutes: New Haven:
10.8% (58)West Virginia:
15.7% (112,448)
20 to 24 minutes: New Haven:
6.3% (34)West Virginia:
13.5% (96,666)
25 to 29 minutes: New Haven:
5.9% (32)West Virginia:
5.3% (38,292)
30 to 34 minutes: New Haven:
14.9% (80)West Virginia:
11.1% (79,985)
35 to 39 minutes: New Haven:
3.9% (21)West Virginia:
2.4% (17,466)
40 to 44 minutes: New Haven:
1.9% (10)West Virginia:
2.8% (19,840)
45 to 59 minutes: New Haven:
9.5% (51)West Virginia:
6.9% (49,594)
60 to 89 minutes: New Haven:
4.1% (22)West Virginia:
4.9% (35,242)
90 or more minutes: New Haven:
4.6% (25)West Virginia:
3.9% (27,928)
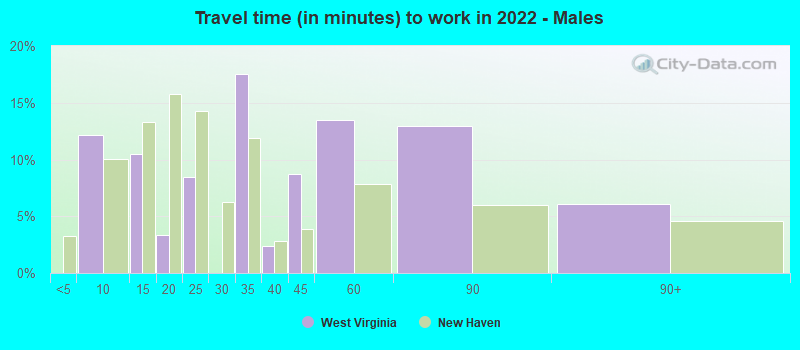
5 to 9 minutes - Males: New Haven:
12.1% (36)West Virginia:
10.1% (34,356)
10 to 14 minutes - Males: New Haven:
10.5% (32)West Virginia:
13.3% (45,514)
15 to 19 minutes - Males: New Haven:
3.3% (10)West Virginia:
15.7% (53,727)
20 to 24 minutes - Males: New Haven:
8.5% (25)West Virginia:
14.3% (48,747)
30 to 34 minutes - Males: New Haven:
17.6% (53)West Virginia:
11.9% (40,631)
35 to 39 minutes - Males: New Haven:
2.4% (7)West Virginia:
2.8% (9,649)
40 to 44 minutes - Males: New Haven:
8.7% (26)West Virginia:
3.9% (13,347)
45 to 59 minutes - Males: New Haven:
13.5% (41)West Virginia:
7.9% (26,932)
60 to 89 minutes - Males: New Haven:
12.9% (39)West Virginia:
6.0% (20,448)
90 or more minutes - Males: New Haven:
6.1% (18)West Virginia:
4.6% (15,558)
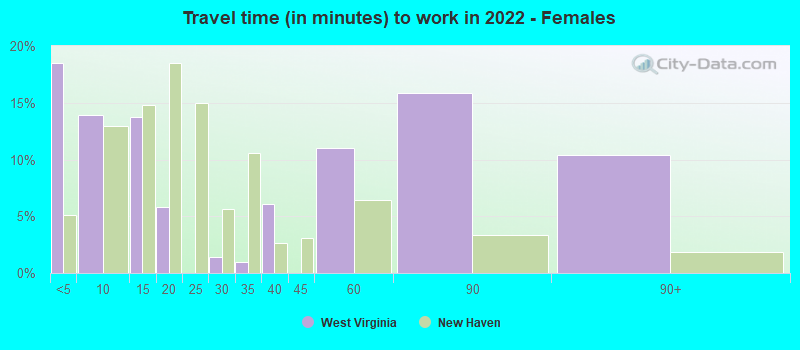
Less than 5 minutes - Females: New Haven:
18.5% (38)West Virginia:
5.1% (15,505)
5 to 9 minutes - Females: New Haven:
13.9% (28)West Virginia:
13.0% (39,383)
10 to 14 minutes - Females: New Haven:
13.7% (28)West Virginia:
14.8% (44,914)
15 to 19 minutes - Females: New Haven:
5.8% (12)West Virginia:
18.5% (56,207)
25 to 29 minutes - Females: New Haven:
1.4% (3)West Virginia:
5.6% (17,121)
30 to 34 minutes - Females: New Haven:
1.0% (2)West Virginia:
10.6% (32,036)
35 to 39 minutes - Females: New Haven:
6.1% (12)West Virginia:
2.6% (7,988)
45 to 59 minutes - Females: New Haven:
11.0% (22)West Virginia:
6.4% (19,390)
60 to 89 minutes - Females: New Haven:
15.9% (32)West Virginia:
3.4% (10,215)
90 or more minutes - Females: New Haven:
10.4% (21)West Virginia:
1.9% (5,634)
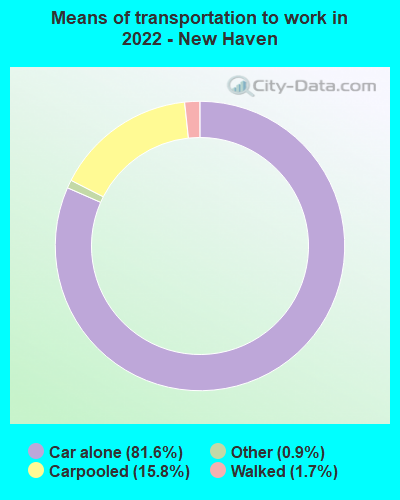
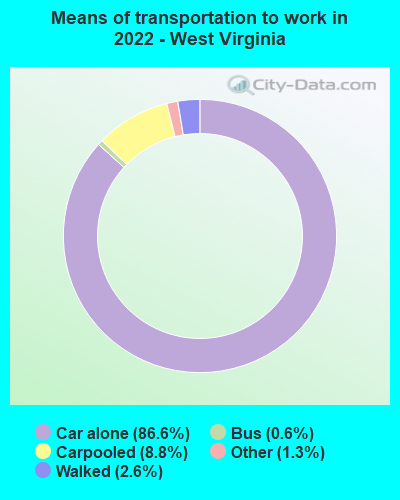
Means of transportation to work Drove car alone: New Haven:
81.6% (431)West Virginia:
86.6% (262,986)
Carpooled: New Haven:
15.8% (83)West Virginia:
8.8% (27,402)
Walked: New Haven:
1.7% (9)West Virginia:
2.6% (8,086)
Other means: New Haven:
0.9% (5)West Virginia:
1.3% (3,008)
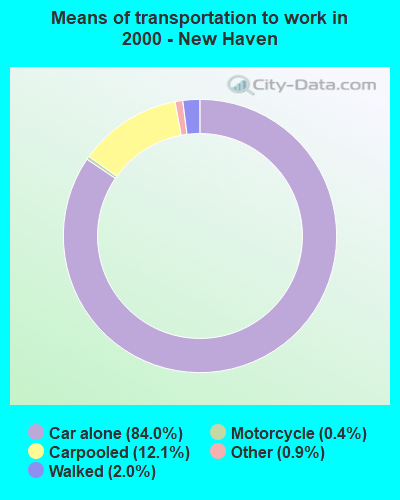
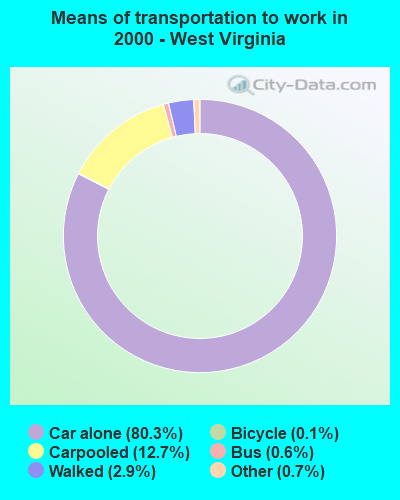
Drove car alone: New Haven:
84.0% (452)West Virginia:
80.3% (576,360)
Carpooled: New Haven:
12.1% (65)West Virginia:
12.7% (91,133)
Motorcycle: New Haven:
0.4% (2)West Virginia:
0.0% (283)
Walked: New Haven:
2.0% (11)West Virginia:
2.9% (21,059)
Other means: New Haven:
0.9% (5)West Virginia:
0.7% (5,379)
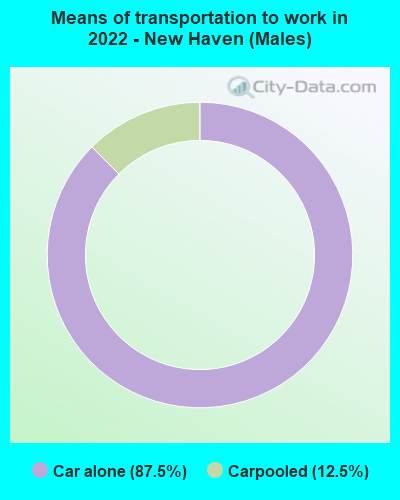
Drove car alone - Males: New Haven:
87.5% (268)West Virginia:
86.4% (262,986)
Carpooled - Males: New Haven:
12.5% (38)West Virginia:
8.6% (27,402)
Drove car alone - Females: New Haven:
73.5% (163)West Virginia:
86.7% (262,986)
Carpooled - Females: New Haven:
20.4% (45)West Virginia:
9.0% (27,402)
Walked - Females: New Haven:
4.0% (9)West Virginia:
2.7% (8,086)
Other means - Females: New Haven:
2.2% (5)West Virginia:
1.0% (3,008)
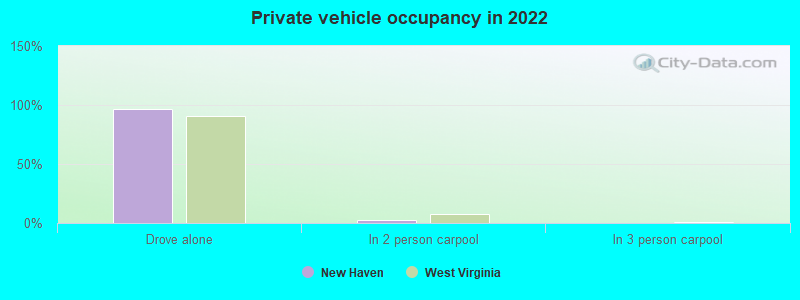
Private vehicle occupancy Drove alone: New Haven:
96.8% (730)West Virginia:
90.4% (569,293)
In 2 person carpool: New Haven:
2.9% (22)West Virginia:
7.7% (48,251)
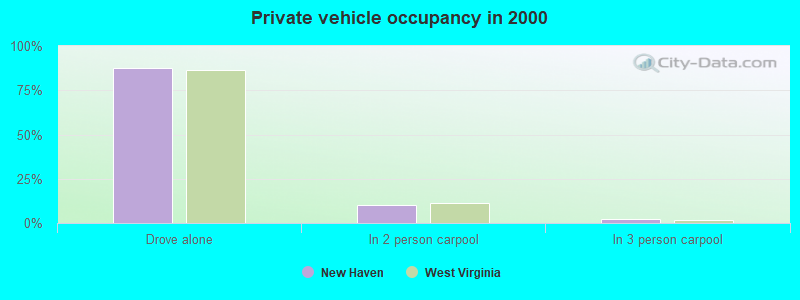
Drove alone: New Haven:
87.4% (452)West Virginia:
86.3% (576,360)
In 2 person carpool: New Haven:
10.1% (52)West Virginia:
11.1% (74,212)
In 3 person carpool: New Haven:
2.5% (13)West Virginia:
1.7% (11,417)
Class of workers
Employee of private company: New Haven:
62.0% (498)West Virginia:
64.5% (474,637)
Private not-for-profit wage and salary workers: New Haven:
17.2% (138)West Virginia:
8.6% (63,372)
Local government workers: New Haven:
5.5% (44)West Virginia:
7.1% (52,269)
State government workers: New Haven:
9.7% (78)West Virginia:
8.1% (59,474)
Federal government workers: New Haven:
2.7% (22)West Virginia:
4.4% (32,429)
Self-employed workers in own not incorporated business: New Haven:
2.9% (23)West Virginia:
4.3% (31,634)
Employee of private company: New Haven:
70.0% (390)West Virginia:
66.7% (488,582)
Self-employed in own incorporated business: New Haven:
1.6% (9)West Virginia:
2.3% (16,512)
Private not-for-profit wage and salary workers: New Haven:
10.1% (56)West Virginia:
6.8% (50,039)
Local government workers: New Haven:
7.0% (39)West Virginia:
6.6% (48,204)
State government workers: New Haven:
4.7% (26)West Virginia:
7.7% (56,389)
Federal government workers: New Haven:
3.2% (18)West Virginia:
3.6% (26,733)
Self-employed workers in own not incorporated business: New Haven:
3.4% (19)West Virginia:
5.9% (43,225)
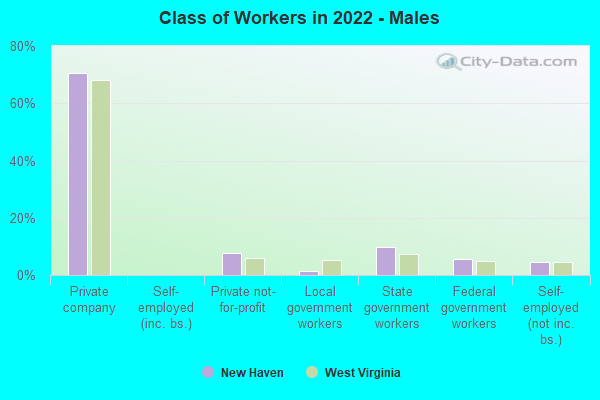
Employee of private company - Males: New Haven:
70.4% (269)West Virginia:
68.2% (262,651)
Private not-for-profit wage and salary workers - Males: New Haven:
7.6% (29)West Virginia:
6.0% (23,049)
Local government workers - Males: New Haven:
1.6% (6)West Virginia:
5.2% (20,188)
State government workers - Males: New Haven:
9.9% (38)West Virginia:
7.3% (28,170)
Federal government workers - Males: New Haven:
5.8% (22)West Virginia:
4.9% (18,697)
Self-employed workers in own not incorporated business - Males: New Haven:
4.7% (18)West Virginia:
4.7% (17,918)
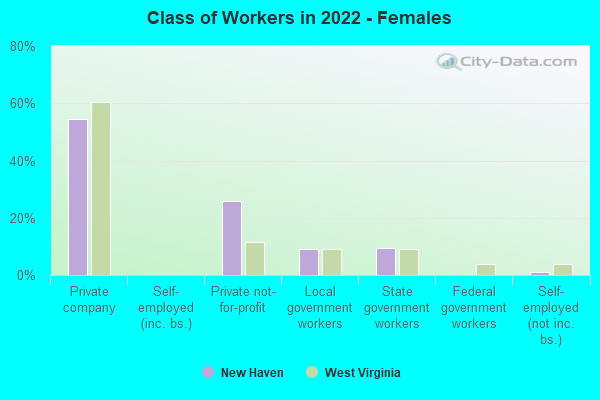
Employee of private company - Females: New Haven:
54.4% (229)West Virginia:
60.4% (211,986)
Private not-for-profit wage and salary workers - Females: New Haven:
25.9% (109)West Virginia:
11.5% (40,323)
Local government workers - Females: New Haven:
9.0% (38)West Virginia:
9.1% (32,081)
State government workers - Females: New Haven:
9.5% (40)West Virginia:
8.9% (31,304)
Self-employed workers in own not incorporated business - Females: New Haven:
1.2% (5)West Virginia:
3.9% (13,716)