Work and Jobs in Paramount, California (CA) Detailed Stats
Occupations, Industries, Unemployment, Workers, Commute
Settings
X


Recent posts about work in Paramount, California on our local forum with over 2,400,000 registered users:
 | Disneyland moving jobs to FL (54 replies) |
| California Business Closures and Job Loss tracking thread (598 replies) |
| What areas of LA should i go to find the most film production jobs? (22 replies) |
| Summer Trip 2024-And Questions (17 replies) |
| Living in Paramount? (4 replies) |
| Recall Newsom? (1244 replies) |
Latest news about work in Paramount, CA collected exclusively by city-data.com from local newspapers, TV, and radio stations
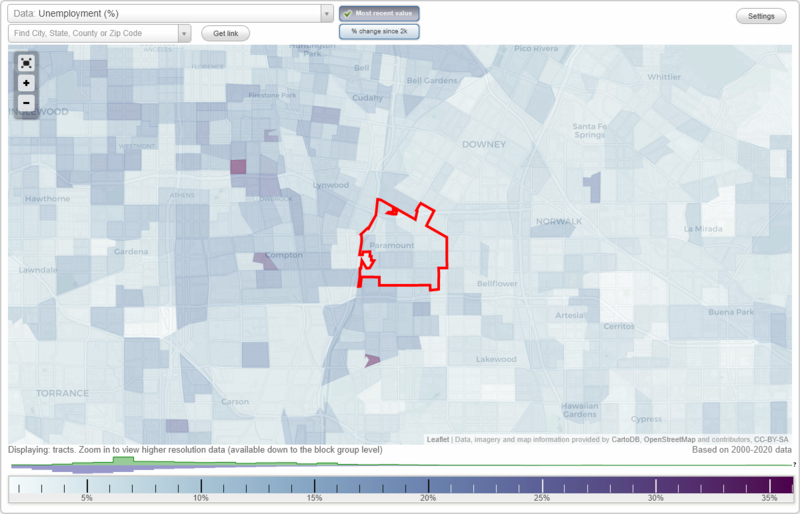
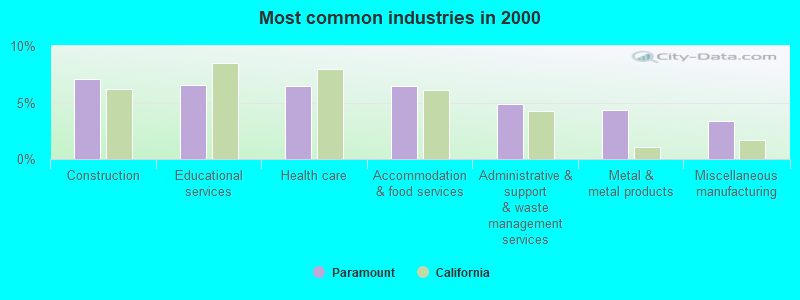
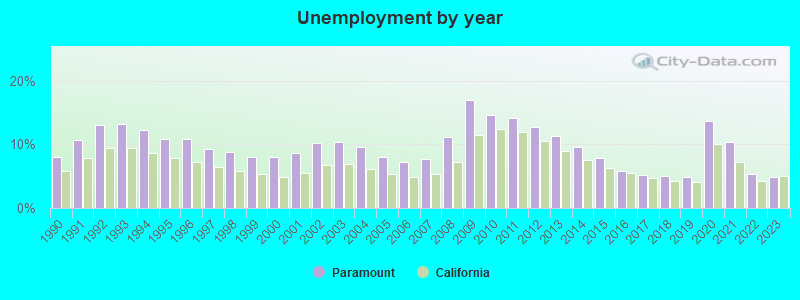
The unemployment rate in 2023 in Paramount, CA was 4.9%, which was 4.1% less than the unemployment rate of 5.1% across the entire state of California. Compared to the unemployment rate of 11.4% in 2013, this represents a decrease of 132.7%. The most common industries in Paramount are: Construction (7.1% of civilian employees), Educational services (6.6% of civilian employees), Health care (6.5% of civilian employees). 89.2% of workers work in Los Angeles County and 5.5% of all workers work at home. 74.8% of workers are employees of private companies, which is 11.1% greater than the rate of 66.5% across the entire state of California.
Whole page based on the data from 2000 / 2022 when the population of Paramount, California was 55,266 / 52,100
Whole page based on the data from 2000 / 2022 when the population of Paramount, California was 55,266 / 52,100
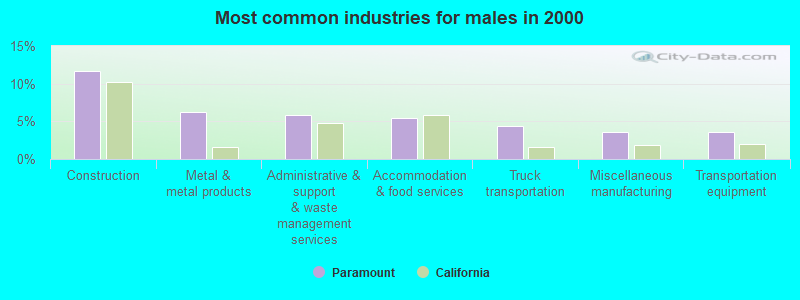
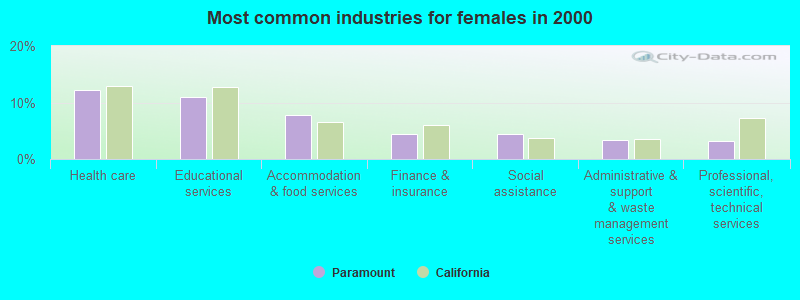
Most common industries
Most common industries | |||
|---|---|---|---|
Industry | All | Males | Females |
| Construction | 7.1% (1,338) | 11.6% (1,241) | 1.2% (97) |
| Educational services | 6.6% (1,237) | 3.2% (341) | 10.9% (896) |
| Health care | 6.5% (1,220) | 2.1% (227) | 12.1% (993) |
| Accommodation and food services | 6.4% (1,212) | 5.4% (579) | 7.7% (633) |
| Administrative and support and waste management services | 4.8% (910) | 5.9% (628) | 3.4% (282) |
| Metal and metal products | 4.3% (815) | 6.3% (670) | 1.8% (145) |
| Miscellaneous manufacturing | 3.3% (628) | 3.5% (378) | 3.1% (250) |
| Transportation equipment | 3.0% (572) | 3.5% (378) | 2.4% (194) |
| Truck transportation | 2.9% (552) | 4.3% (462) | 1.1% (90) |
| Finance and insurance | 2.6% (484) | 1.1% (117) | 4.5% (367) |
| Professional, scientific, and technical services | 2.5% (472) | 2.0% (210) | 3.2% (262) |
| Real estate and rental and leasing | 2.3% (440) | 2.7% (289) | 1.8% (151) |
| Other transportation, and support activities, and couriers | 2.3% (429) | 2.7% (290) | 1.7% (139) |
| Food and beverage stores | 2.2% (413) | 2.2% (240) | 2.1% (173) |
| Social assistance | 2.2% (406) | 0.4% (41) | 4.5% (365) |
| Public administration | 2.0% (385) | 1.4% (147) | 2.9% (238) |
| Repair and maintenance | 1.8% (346) | 3.1% (332) | 0.2% (14) |
| Personal and laundry services | 1.8% (340) | 1.6% (169) | 2.1% (171) |
| Furniture and related product manufacturing | 1.8% (340) | 2.2% (237) | 1.3% (103) |
| Department and other general merchandise stores | 1.7% (330) | 1.0% (104) | 2.8% (226) |
| Apparel | 1.6% (304) | 0.9% (97) | 2.5% (207) |
| Plastics and rubber products | 1.6% (303) | 1.6% (169) | 1.6% (134) |
| Motor vehicle and parts dealers | 1.3% (254) | 2.1% (224) | 0.4% (30) |
| Food | 1.3% (247) | 1.6% (174) | 0.9% (73) |
| Machinery | 1.2% (219) | 1.7% (178) | 0.5% (41) |
| Printing and related support activities | 1.1% (207) | 1.0% (105) | 1.2% (102) |
| Arts, entertainment, and recreation | 1.1% (206) | 1.5% (159) | 0.6% (47) |
| Clothing and accessories, including shoe, stores | 1.1% (200) | 0.6% (65) | 1.6% (135) |
| Publishing, and motion picture and sound recording industries | 1.1% (199) | 1.2% (131) | 0.8% (68) |
| Groceries and related products merchant wholesalers | 1.0% (195) | 1.2% (131) | 0.8% (64) |
| Religious, grantmaking, civic, professional, and similar organizations | 0.9% (178) | 0.7% (80) | 1.2% (98) |
| Used merchandise, gift, novelty, and souvenir, and other miscellaneous stores | 0.9% (173) | 0.7% (71) | 1.2% (102) |
| Computer and electronic products | 0.9% (166) | 1.0% (106) | 0.7% (60) |
| Textile mills and textile products | 0.8% (157) | 0.7% (77) | 1.0% (80) |
| U. S. Postal service | 0.8% (157) | 0.5% (53) | 1.3% (104) |
| Other direct selling establishments | 0.8% (150) | 0.9% (93) | 0.7% (57) |
| Warehousing and storage | 0.8% (148) | 1.0% (107) | 0.5% (41) |
| Broadcasting and telecommunications | 0.7% (137) | 0.3% (34) | 1.3% (103) |
| Motor vehicles, parts and supplies merchant wholesalers | 0.7% (134) | 1.1% (118) | 0.2% (16) |
| Nonmetallic mineral products | 0.7% (124) | 1.1% (116) | 0.1% (8) |
| Chemicals | 0.6% (122) | 0.9% (92) | 0.4% (30) |
| Miscellaneous nondurable goods merchant wholesalers | 0.6% (117) | 0.4% (44) | 0.9% (73) |
| Electrical equipment, appliances, and components | 0.6% (114) | 0.7% (75) | 0.5% (39) |
| Paper | 0.6% (107) | 0.7% (72) | 0.4% (35) |
| Furniture and home furnishings, and household appliance stores | 0.6% (107) | 0.5% (57) | 0.6% (50) |
| Radio, TV, and computer stores | 0.6% (106) | 0.6% (63) | 0.5% (43) |
| Building material and garden equipment and supplies dealers | 0.5% (98) | 0.6% (68) | 0.4% (30) |
| Machinery, equipment, and supplies merchant wholesalers | 0.5% (93) | 0.7% (70) | 0.3% (23) |
| Wood products | 0.5% (90) | 0.8% (81) | 0.1% (9) |
| Private households | 0.5% (86) | 0.0% (5) | 1.0% (81) |
| Data processing, libraries, and other information services | 0.5% (86) | 0.6% (59) | 0.3% (27) |
| Miscellaneous durable goods merchant wholesalers | 0.4% (76) | 0.6% (62) | 0.2% (14) |
| Petroleum and coal products | 0.4% (72) | 0.5% (58) | 0.2% (14) |
| Professional and commercial equipment and supplies merchant wholesalers | 0.3% (64) | 0.3% (28) | 0.4% (36) |
| Health and personal care, except drug, stores | 0.3% (57) | 0.0% (4) | 0.6% (53) |
| Pharmacies and drug stores | 0.3% (51) | 0.1% (10) | 0.5% (41) |
| Electrical and electronic goods merchant wholesalers | 0.3% (51) | 0.3% (29) | 0.3% (22) |
| Apparel, fabrics, and notions merchant wholesalers | 0.2% (47) | 0.2% (24) | 0.3% (23) |
| Recyclable material merchant wholesalers | 0.2% (44) | 0.3% (32) | 0.1% (12) |
| Utilities | 0.2% (43) | 0.4% (43) | 0.0% (0) |
| Sporting goods, camera, and hobby and toy stores | 0.2% (39) | 0.2% (26) | 0.2% (13) |
| Lumber and other construction materials merchant wholesalers | 0.2% (38) | 0.1% (16) | 0.3% (22) |
| Mining, quarrying, and oil and gas extraction | 0.2% (35) | 0.3% (27) | 0.1% (8) |
| Drugs, sundries, and chemical and allied products merchant wholesalers | 0.2% (33) | 0.3% (33) | 0.0% (0) |
| Hardware, plumbing and heating equipment, and supplies merchant wholesalers | 0.2% (32) | 0.3% (32) | 0.0% (0) |
| Paper and paper products merchant wholesalers | 0.2% (31) | 0.1% (15) | 0.2% (16) |
| Office supplies and stationery stores | 0.1% (28) | 0.3% (28) | 0.0% (0) |
| Sewing, needlework, and piece goods stores | 0.1% (26) | 0.1% (10) | 0.2% (16) |
| Music stores | 0.1% (25) | 0.1% (11) | 0.2% (14) |
| Metals and minerals, except petroleum, merchant wholesalers | 0.1% (23) | 0.1% (11) | 0.1% (12) |
| Agriculture, forestry, fishing and hunting | 0.1% (23) | 0.2% (23) | 0.0% (0) |
| Rail transportation | 0.1% (22) | 0.1% (16) | 0.1% (6) |
| Petroleum and petroleum products merchant wholesalers | 0.1% (22) | 0.2% (18) | 0.0% (4) |
| Beverage and tobacco products | 0.1% (22) | 0.2% (22) | 0.0% (0) |
| Air transportation | 0.1% (21) | 0.1% (13) | 0.1% (8) |
| Furniture and home furnishing merchant wholesalers | 0.1% (21) | 0.0% (0) | 0.3% (21) |
Unemployment in Paramount
- Unemployment by race in 2022
- Unemployment rate for White non-Hispanic residents
- 6.1%Females
- Unemployment rate for Black residents
- 4.1%Males
- 11.7%Females
- Unemployment rate for Asian residents
- 19.6%Males
- 1.3%Females
- Unemployment rate for other race residents
- 4.2%Males
- 5.7%Females
- Unemployment rate for two or more race residents
- 2.2%Males
- 1.1%Females
- Unemployment rate for Hispanic or Latino residents
- 3.6%Males
- 4.3%Females
- Unemployment by race in 2000
- Unemployment rate for White non-Hispanic residents
- 6.2%Males
- 7.1%Females
- Unemployment rate for Black residents
- 13.3%Males
- 11.4%Females
- Unemployment rate for American Indian and Alaska Native residents
- 12.2%Males
- Unemployment rate for Asian residents
- 5.0%Males
- 9.3%Females
- Unemployment rate for other race residents
- 8.5%Males
- 14.4%Females
- Unemployment rate for two or more race residents
- 7.5%Males
- 15.4%Females
- Unemployment rate for Hispanic or Latino residents
- 10.7%Males
- 15.1%Females
Unemployment in 2023:
| Paramount: | 4.9% |
| California: | 5.1% |
Unemployment in 2022:
| Paramount: | 5.3% |
| California: | 4.2% |
Unemployment in 2021:
| Paramount: | 10.4% |
| California: | 7.3% |
Unemployment in 2020:
| Paramount: | 13.7% |
| California: | 10.1% |
Unemployment in 2019:
| Paramount: | 4.9% |
| California: | 4.1% |
Unemployment in 2018:
| Paramount: | 5.1% |
| California: | 4.2% |
Unemployment in 2017:
| Paramount: | 5.2% |
| California: | 4.8% |
Unemployment in 2016:
| Paramount: | 5.9% |
| California: | 5.5% |
Unemployment in 2015:
| Paramount: | 7.8% |
| California: | 6.3% |
Unemployment in 2014:
| Paramount: | 9.6% |
| California: | 7.6% |
Unemployment in 2013:
| Paramount: | 11.4% |
| California: | 9.0% |
Unemployment in 2012:
| Paramount: | 12.8% |
| California: | 10.5% |
Unemployment in 2011:
| Paramount: | 14.2% |
| California: | 11.9% |
Unemployment in 2010:
| Paramount: | 14.6% |
| California: | 12.5% |
Unemployment in 2009:
| Paramount: | 17.0% |
| California: | 11.5% |
Unemployment in 2008:
| Paramount: | 11.2% |
| California: | 7.3% |
Unemployment in 2007:
| Paramount: | 7.7% |
| California: | 5.3% |
Unemployment in 2006:
| Paramount: | 7.2% |
| California: | 4.9% |
Unemployment in 2005:
| Paramount: | 8.0% |
| California: | 5.4% |
Unemployment in 2004:
| Paramount: | 9.6% |
| California: | 6.2% |
Unemployment in 2003:
| Paramount: | 10.4% |
| California: | 6.9% |
Unemployment in 2002:
| Paramount: | 10.2% |
| California: | 6.8% |
Unemployment in 2001:
| Paramount: | 8.6% |
| California: | 5.5% |
Unemployment in 2000:
| Paramount: | 8.1% |
| California: | 4.9% |
Unemployment in 1999:
| Paramount: | 8.0% |
| California: | 5.3% |
Unemployment in 1998:
| Paramount: | 8.8% |
| California: | 5.9% |
Unemployment in 1997:
| Paramount: | 9.3% |
| California: | 6.4% |
Unemployment in 1996:
| Paramount: | 10.9% |
| California: | 7.3% |
Unemployment in 1995:
| Paramount: | 10.9% |
| California: | 7.9% |
Unemployment in 1994:
| Paramount: | 12.3% |
| California: | 8.7% |
Unemployment in 1993:
| Paramount: | 13.3% |
| California: | 9.5% |
Unemployment in 1992:
| Paramount: | 13.1% |
| California: | 9.4% |
Unemployment in 1991:
| Paramount: | 10.7% |
| California: | 7.8% |
Unemployment in 1990:
| Paramount: | 8.0% |
| California: | 5.8% |
Time leaving home to go to work
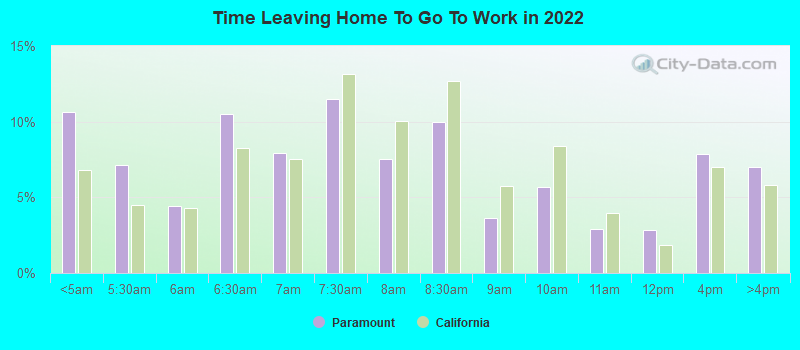
12:00 a.m. to 4:59 a.m.:
| Paramount: | 10.6% (2,348) |
| California: | 6.8% (1,050,902) |
5:00 a.m. to 5:29 a.m.:
| Paramount: | 7.1% (1,580) |
| California: | 4.5% (692,772) |
5:30 a.m. to 5:59 a.m.:
| Paramount: | 4.4% (973) |
| California: | 4.3% (665,475) |
6:00 a.m. to 6:29 a.m.:
| Paramount: | 10.5% (2,321) |
| California: | 8.3% (1,273,588) |
6:30 a.m. to 6:59 a.m.:
| Paramount: | 7.9% (1,754) |
| California: | 7.5% (1,156,338) |
7:00 a.m. to 7:29 a.m.:
| Paramount: | 11.5% (2,539) |
| California: | 13.2% (2,027,702) |
7:30 a.m. to 7:59 a.m.:
| Paramount: | 7.5% (1,668) |
| California: | 10.1% (1,550,402) |
8:00 a.m. to 8:29 a.m.:
| Paramount: | 10.0% (2,213) |
| California: | 12.7% (1,953,986) |
8:30 a.m. to 8:59 a.m.:
| Paramount: | 3.6% (797) |
| California: | 5.8% (890,950) |
9:00 a.m. to 9:59 a.m.:
| Paramount: | 5.7% (1,264) |
| California: | 8.4% (1,288,499) |
10:00 a.m. to 10:59 a.m.:
| Paramount: | 2.9% (641) |
| California: | 4.0% (613,193) |
11:00 a.m. to 11:59 a.m.:
| Paramount: | 2.8% (629) |
| California: | 1.8% (280,975) |
12:00 p.m. to 3:59 p.m.:
| Paramount: | 7.9% (1,745) |
| California: | 7.0% (1,075,505) |
4:00 p.m. to 11:59 p.m.:
| Paramount: | 7.0% (1,554) |
| California: | 5.8% (891,240) |
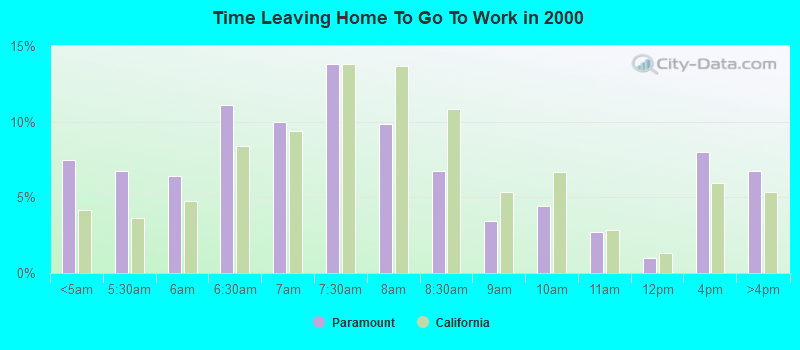
<5am:
| Paramount: | 7.5% (1,369) |
| California: | 4.2% (606,086) |
5:30am:
| Paramount: | 6.7% (1,227) |
| California: | 3.6% (523,209) |
6am:
| Paramount: | 6.4% (1,178) |
| California: | 4.8% (692,256) |
6:30am:
| Paramount: | 11.1% (2,025) |
| California: | 8.4% (1,216,867) |
7am:
| Paramount: | 10.0% (1,826) |
| California: | 9.4% (1,362,830) |
7:30am:
| Paramount: | 13.8% (2,531) |
| California: | 13.8% (2,006,950) |
8am:
| Paramount: | 9.8% (1,799) |
| California: | 13.7% (1,986,831) |
8:30am:
| Paramount: | 6.7% (1,230) |
| California: | 10.9% (1,577,815) |
9am:
| Paramount: | 3.4% (623) |
| California: | 5.4% (778,152) |
10am:
| Paramount: | 4.4% (805) |
| California: | 6.7% (972,355) |
11am:
| Paramount: | 2.7% (501) |
| California: | 2.9% (414,479) |
12pm:
| Paramount: | 1.0% (183) |
| California: | 1.3% (189,005) |
4pm:
| Paramount: | 8.0% (1,458) |
| California: | 6.0% (865,284) |
>4pm:
| Paramount: | 6.7% (1,234) |
| California: | 5.3% (776,167) |
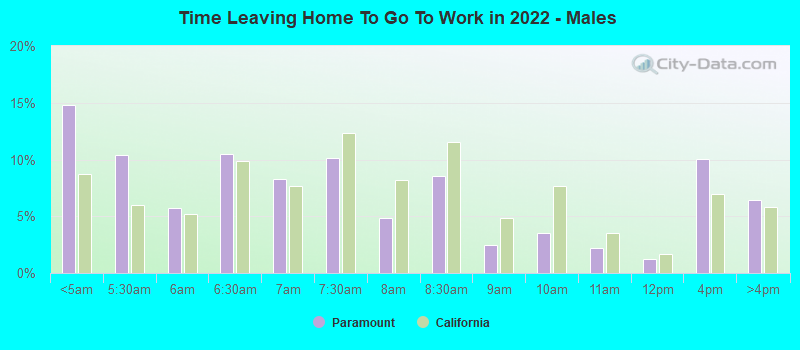
12:00 a.m. to 4:59 a.m. - Males:
| Paramount: | 14.8% (1,883) |
| California: | 8.7% (747,612) |
5:00 a.m. to 5:29 a.m. - Males:
| Paramount: | 10.4% (1,317) |
| California: | 6.0% (509,420) |
5:30 a.m. to 5:59 a.m. - Males:
| Paramount: | 5.7% (723) |
| California: | 5.2% (448,269) |
6:00 a.m. to 6:29 a.m. - Males:
| Paramount: | 10.5% (1,329) |
| California: | 9.8% (842,941) |
6:30 a.m. to 6:59 a.m. - Males:
| Paramount: | 8.3% (1,050) |
| California: | 7.7% (657,557) |
7:00 a.m. to 7:29 a.m. - Males:
| Paramount: | 10.1% (1,283) |
| California: | 12.4% (1,058,532) |
7:30 a.m. to 7:59 a.m. - Males:
| Paramount: | 4.9% (617) |
| California: | 8.2% (702,727) |
8:00 a.m. to 8:29 a.m. - Males:
| Paramount: | 8.5% (1,083) |
| California: | 11.5% (984,538) |
8:30 a.m. to 8:59 a.m. - Males:
| Paramount: | 2.5% (312) |
| California: | 4.8% (414,815) |
9:00 a.m. to 9:59 a.m. - Males:
| Paramount: | 3.5% (448) |
| California: | 7.7% (655,038) |
10:00 a.m. to 10:59 a.m. - Males:
| Paramount: | 2.2% (278) |
| California: | 3.5% (301,425) |
11:00 a.m. to 11:59 a.m. - Males:
| Paramount: | 1.3% (162) |
| California: | 1.7% (141,620) |
12:00 p.m. to 3:59 p.m. - Males:
| Paramount: | 10.1% (1,278) |
| California: | 7.0% (594,847) |
4:00 p.m. to 11:59 p.m. - Males:
| Paramount: | 6.5% (821) |
| California: | 5.8% (499,471) |
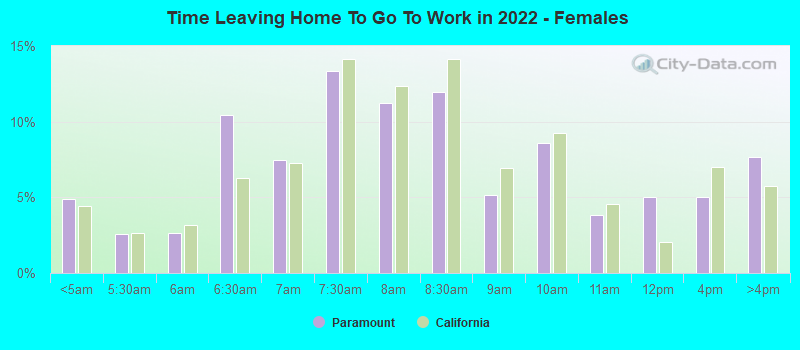
12:00 a.m. to 4:59 a.m. - Females:
| Paramount: | 4.9% (461) |
| California: | 4.4% (303,290) |
5:00 a.m. to 5:29 a.m. - Females:
| Paramount: | 2.5% (240) |
| California: | 2.7% (183,352) |
5:30 a.m. to 5:59 a.m. - Females:
| Paramount: | 2.6% (249) |
| California: | 3.2% (217,206) |
6:00 a.m. to 6:29 a.m. - Females:
| Paramount: | 10.4% (980) |
| California: | 6.3% (430,647) |
6:30 a.m. to 6:59 a.m. - Females:
| Paramount: | 7.5% (705) |
| California: | 7.3% (498,781) |
7:00 a.m. to 7:29 a.m. - Females:
| Paramount: | 13.4% (1,257) |
| California: | 14.1% (969,170) |
7:30 a.m. to 7:59 a.m. - Females:
| Paramount: | 11.2% (1,057) |
| California: | 12.4% (847,675) |
8:00 a.m. to 8:29 a.m. - Females:
| Paramount: | 12.0% (1,128) |
| California: | 14.1% (969,448) |
8:30 a.m. to 8:59 a.m. - Females:
| Paramount: | 5.1% (484) |
| California: | 6.9% (476,135) |
9:00 a.m. to 9:59 a.m. - Females:
| Paramount: | 8.6% (810) |
| California: | 9.2% (633,461) |
10:00 a.m. to 10:59 a.m. - Females:
| Paramount: | 3.8% (360) |
| California: | 4.5% (311,768) |
11:00 a.m. to 11:59 a.m. - Females:
| Paramount: | 5.0% (471) |
| California: | 2.0% (139,355) |
12:00 p.m. to 3:59 p.m. - Females:
| Paramount: | 5.0% (472) |
| California: | 7.0% (480,658) |
4:00 p.m. to 11:59 p.m. - Females:
| Paramount: | 7.7% (723) |
| California: | 5.7% (391,769) |
Travel time to work
Percentage of workers working in this county: 89.2%
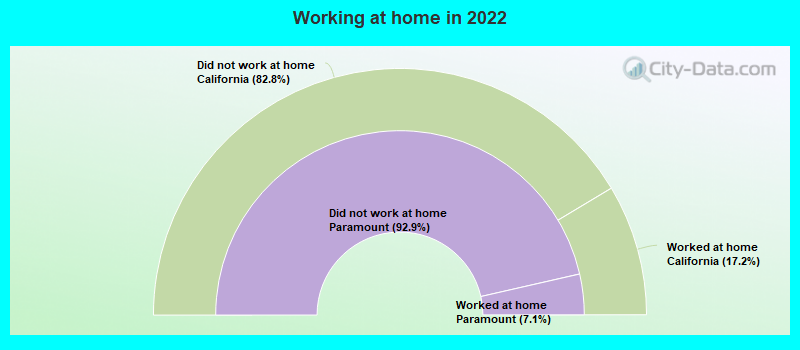
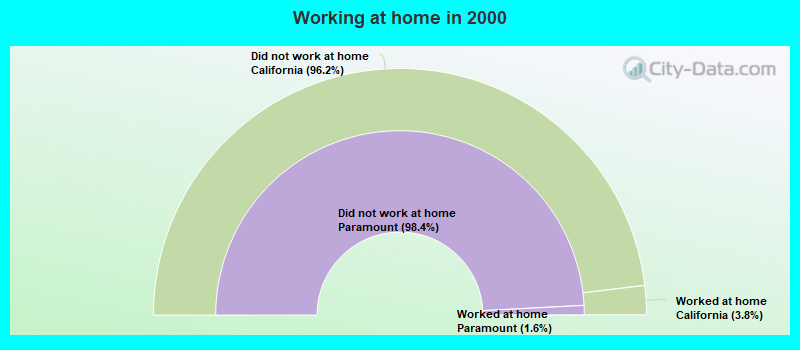
Number of people working at home: 1,355 (5.5% of all workers)
Daytime population change due to commuting: -219 (-0.4%)
Workers who live and work in this city: 2,698 (14.8%)
Number of people working at home: 1,355 (5.5% of all workers)
Daytime population change due to commuting: -219 (-0.4%)
Workers who live and work in this city: 2,698 (14.8%)
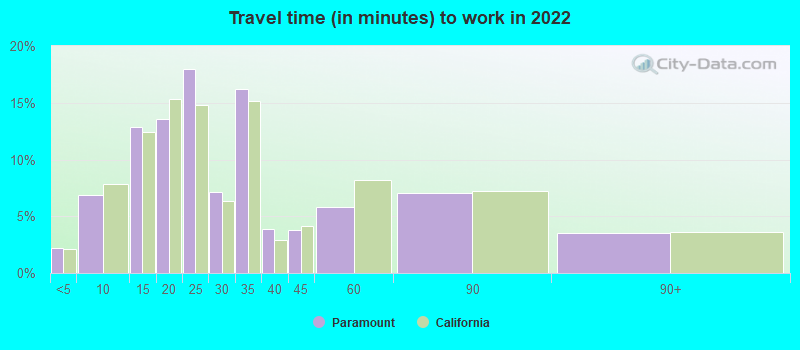
Less than 5 minutes:
| Paramount: | 2.2% (346) |
| California: | 2.1% (323,064) |
5 to 9 minutes:
| Paramount: | 6.9% (1,076) |
| California: | 7.8% (1,208,682) |
10 to 14 minutes:
| Paramount: | 12.9% (2,012) |
| California: | 12.4% (1,917,610) |
15 to 19 minutes:
| Paramount: | 13.6% (2,119) |
| California: | 15.3% (2,367,483) |
20 to 24 minutes:
| Paramount: | 18.0% (2,812) |
| California: | 14.8% (2,279,693) |
25 to 29 minutes:
| Paramount: | 7.1% (1,111) |
| California: | 6.4% (981,997) |
30 to 34 minutes:
| Paramount: | 16.2% (2,536) |
| California: | 15.2% (2,339,223) |
35 to 39 minutes:
| Paramount: | 3.8% (599) |
| California: | 2.9% (453,226) |
40 to 44 minutes:
| Paramount: | 3.8% (587) |
| California: | 4.1% (637,781) |
45 to 59 minutes:
| Paramount: | 5.8% (903) |
| California: | 8.2% (1,259,482) |
60 to 89 minutes:
| Paramount: | 7.1% (1,102) |
| California: | 7.2% (1,111,698) |
90 or more minutes:
| Paramount: | 3.5% (546) |
| California: | 3.6% (552,805) |
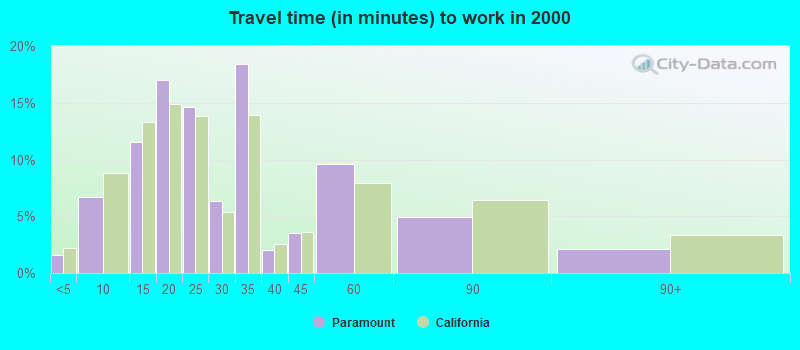
Less than 5 minutes:
| Paramount: | 1.6% (285) |
| California: | 2.2% (324,703) |
5 to 9 minutes:
| Paramount: | 6.7% (1,225) |
| California: | 8.8% (1,280,443) |
10 to 14 minutes:
| Paramount: | 11.5% (2,111) |
| California: | 13.3% (1,930,263) |
15 to 19 minutes:
| Paramount: | 17.0% (3,112) |
| California: | 14.9% (2,157,970) |
20 to 24 minutes:
| Paramount: | 14.7% (2,682) |
| California: | 13.8% (2,004,060) |
25 to 29 minutes:
| Paramount: | 6.3% (1,156) |
| California: | 5.4% (782,241) |
30 to 34 minutes:
| Paramount: | 18.4% (3,366) |
| California: | 13.9% (2,025,657) |
35 to 39 minutes:
| Paramount: | 2.0% (366) |
| California: | 2.5% (366,487) |
40 to 44 minutes:
| Paramount: | 3.5% (637) |
| California: | 3.6% (528,043) |
45 to 59 minutes:
| Paramount: | 9.6% (1,751) |
| California: | 7.9% (1,151,598) |
60 to 89 minutes:
| Paramount: | 5.0% (910) |
| California: | 6.4% (933,123) |
90 or more minutes:
| Paramount: | 2.1% (388) |
| California: | 3.3% (483,698) |
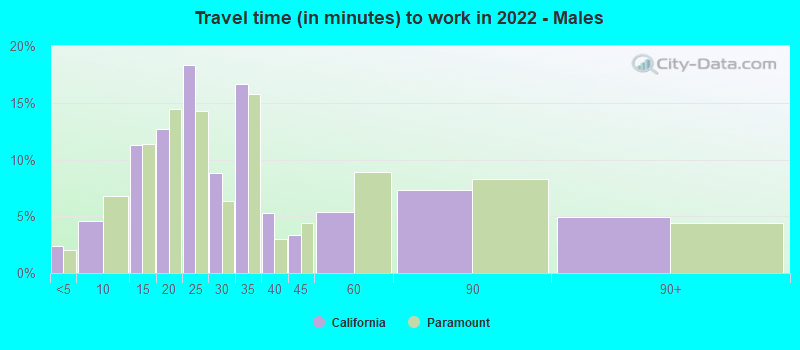
Less than 5 minutes - Males:
| Paramount: | 2.4% (225) |
| California: | 2.0% (173,603) |
5 to 9 minutes - Males:
| Paramount: | 4.6% (442) |
| California: | 6.8% (580,822) |
10 to 14 minutes - Males:
| Paramount: | 11.3% (1,080) |
| California: | 11.4% (974,497) |
15 to 19 minutes - Males:
| Paramount: | 12.7% (1,216) |
| California: | 14.5% (1,239,386) |
20 to 24 minutes - Males:
| Paramount: | 18.3% (1,751) |
| California: | 14.3% (1,223,429) |
25 to 29 minutes - Males:
| Paramount: | 8.8% (839) |
| California: | 6.4% (545,844) |
30 to 34 minutes - Males:
| Paramount: | 16.7% (1,593) |
| California: | 15.8% (1,352,210) |
35 to 39 minutes - Males:
| Paramount: | 5.3% (506) |
| California: | 3.0% (253,732) |
40 to 44 minutes - Males:
| Paramount: | 3.3% (318) |
| California: | 4.4% (376,144) |
45 to 59 minutes - Males:
| Paramount: | 5.4% (515) |
| California: | 8.9% (762,659) |
60 to 89 minutes - Males:
| Paramount: | 7.3% (697) |
| California: | 8.3% (711,394) |
90 or more minutes - Males:
| Paramount: | 4.9% (470) |
| California: | 4.4% (378,954) |
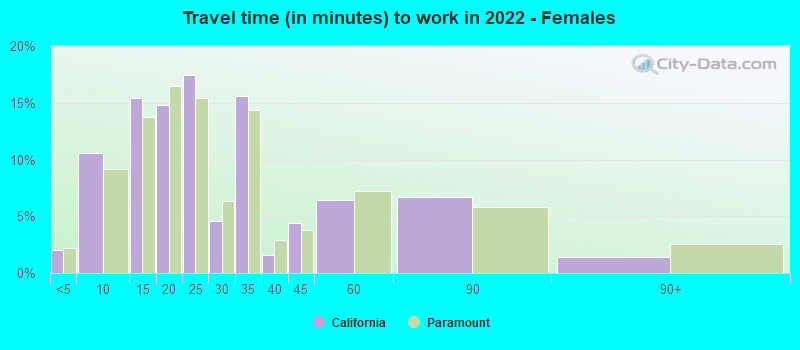
Less than 5 minutes - Females:
| Paramount: | 2.1% (124) |
| California: | 2.2% (149,461) |
5 to 9 minutes - Females:
| Paramount: | 10.6% (641) |
| California: | 9.2% (627,860) |
10 to 14 minutes - Females:
| Paramount: | 15.4% (931) |
| California: | 13.7% (943,113) |
15 to 19 minutes - Females:
| Paramount: | 14.8% (898) |
| California: | 16.4% (1,128,097) |
20 to 24 minutes - Females:
| Paramount: | 17.4% (1,055) |
| California: | 15.4% (1,056,264) |
25 to 29 minutes - Females:
| Paramount: | 4.6% (279) |
| California: | 6.4% (436,153) |
30 to 34 minutes - Females:
| Paramount: | 15.6% (946) |
| California: | 14.4% (987,013) |
35 to 39 minutes - Females:
| Paramount: | 1.6% (94) |
| California: | 2.9% (199,494) |
40 to 44 minutes - Females:
| Paramount: | 4.4% (265) |
| California: | 3.8% (261,637) |
45 to 59 minutes - Females:
| Paramount: | 6.4% (388) |
| California: | 7.2% (496,823) |
60 to 89 minutes - Females:
| Paramount: | 6.7% (406) |
| California: | 5.8% (400,304) |
90 or more minutes - Females:
| Paramount: | 1.4% (86) |
| California: | 2.5% (173,851) |
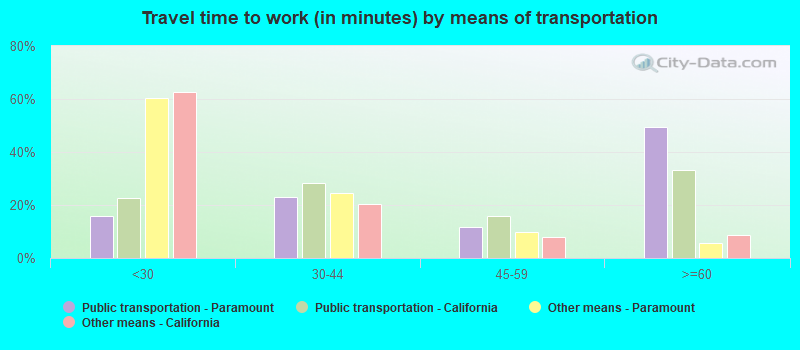
Means of transportation to work
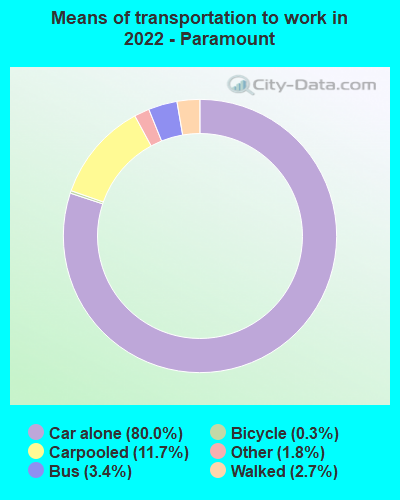

Drove car alone:
| Paramount: | 80.0% (13,058) |
| California: | 79.1% (5,345,368) |
Carpooled:
| Paramount: | 11.7% (1,917) |
| California: | 11.9% (878,699) |
Bus:
| Paramount: | 3.4% (551) |
| California: | 2.2% (170,574) |
Subway or elevated rail:
| Paramount: | 0.1% (14) |
| California: | 0.6% (40,665) |
Bicycle:
| Paramount: | 0.3% (42) |
| California: | 0.9% (39,197) |
Walked:
| Paramount: | 2.7% (444) |
| California: | 2.9% (218,374) |
Other means:
| Paramount: | 1.8% (294) |
| California: | 2.1% (137,489) |
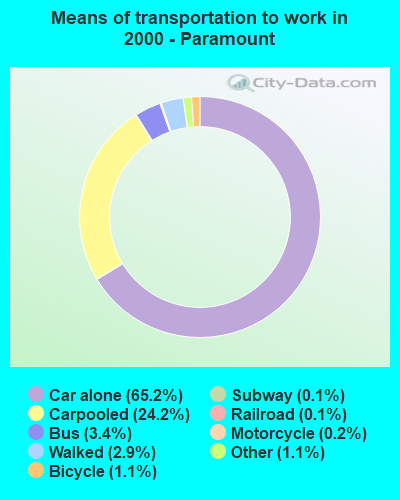

Drove car alone:
| Paramount: | 65.2% (11,918) |
| California: | 71.8% (10,432,462) |
Carpooled:
| Paramount: | 24.2% (4,423) |
| California: | 14.5% (2,113,313) |
Bus or trolley bus:
| Paramount: | 3.4% (624) |
| California: | 3.8% (549,425) |
Streetcar or trolley car:
| Paramount: | 0.0% (7) |
| California: | 0.1% (21,158) |
Subway or elevated:
| Paramount: | 0.1% (25) |
| California: | 0.7% (107,711) |
Railroad:
| Paramount: | 0.1% (25) |
| California: | 0.3% (41,022) |
Taxicab:
| Paramount: | 0.0% (5) |
| California: | 0.1% (9,890) |
Motorcycle:
| Paramount: | 0.2% (37) |
| California: | 0.2% (36,262) |
Bicycle:
| Paramount: | 1.1% (206) |
| California: | 0.8% (120,567) |
Walked:
| Paramount: | 2.9% (525) |
| California: | 2.9% (414,581) |
Other means:
| Paramount: | 1.1% (194) |
| California: | 0.8% (115,064) |
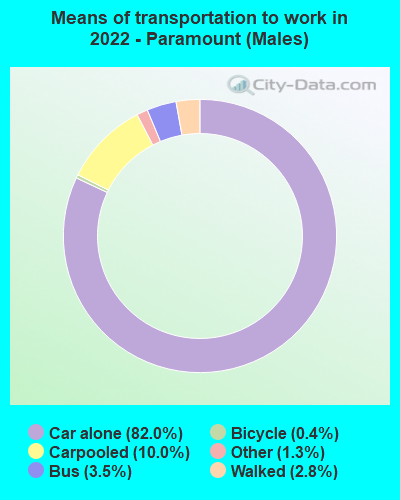

Drove car alone - Males:
| Paramount: | 82.0% (8,160) |
| California: | 80.0% (5,345,368) |
Carpooled - Males:
| Paramount: | 10.0% (995) |
| California: | 11.1% (878,699) |
Bus - Males:
| Paramount: | 3.5% (352) |
| California: | 2.0% (170,574) |
Bicycle - Males:
| Paramount: | 0.4% (42) |
| California: | 1.1% (39,197) |
Walked - Males:
| Paramount: | 2.8% (274) |
| California: | 2.7% (218,374) |
Other means - Males:
| Paramount: | 1.3% (127) |
| California: | 2.1% (137,489) |
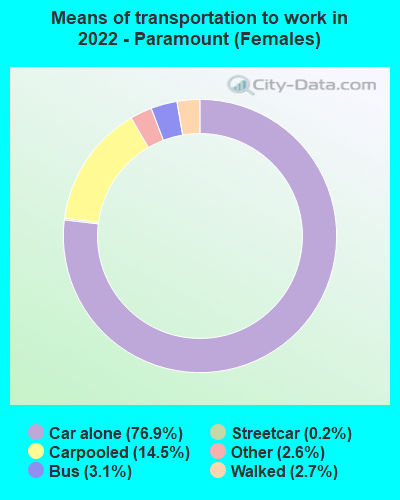

Drove car alone - Females:
| Paramount: | 76.9% (4,890) |
| California: | 77.9% (5,345,368) |
Carpooled - Females:
| Paramount: | 14.5% (922) |
| California: | 12.8% (878,699) |
Bus - Females:
| Paramount: | 3.1% (199) |
| California: | 2.5% (170,574) |
Subway or elevated rail - Females:
| Paramount: | 0.2% (14) |
| California: | 0.6% (40,665) |
Walked - Females:
| Paramount: | 2.7% (170) |
| California: | 3.2% (218,374) |
Other means - Females:
| Paramount: | 2.6% (168) |
| California: | 2.0% (137,489) |
Private vehicle occupancy
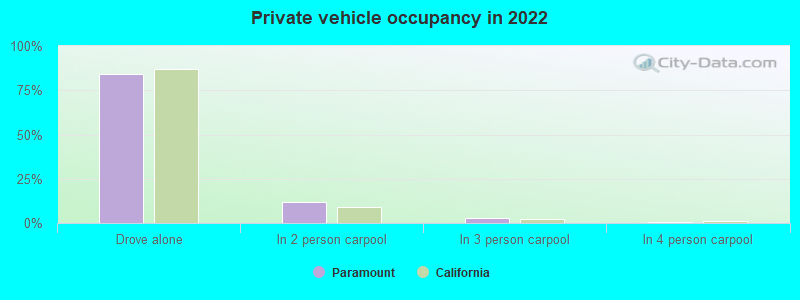
Drove alone:
| Paramount: | 84.3% (17,310) |
| California: | 86.9% (12,187,486) |
In 2 person carpool:
| Paramount: | 11.8% (2,416) |
| California: | 9.2% (1,295,561) |
In 3 person carpool:
| Paramount: | 3.0% (612) |
| California: | 2.2% (309,969) |
In 4 person carpool:
| Paramount: | 0.7% (144) |
| California: | 0.9% (126,987) |
In 5-6 person carpool:
| Paramount: | 0.2% (39) |
| California: | 0.5% (70,825) |
In 7+ person carpool:
| Paramount: | 0.1% (13) |
| California: | 0.2% (28,258) |
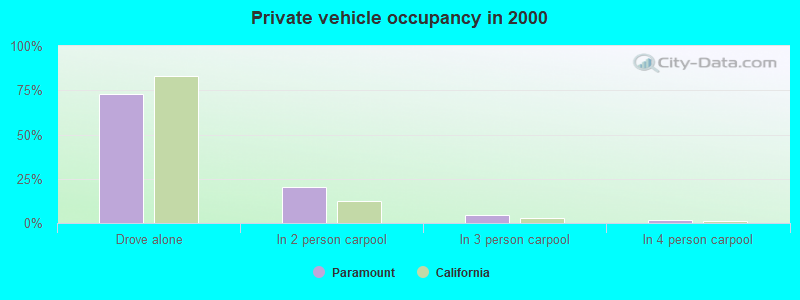
Drove alone:
| Paramount: | 72.9% (11,918) |
| California: | 83.2% (10,432,462) |
In 2 person carpool:
| Paramount: | 20.4% (3,332) |
| California: | 12.5% (1,564,905) |
In 3 person carpool:
| Paramount: | 4.4% (721) |
| California: | 2.6% (330,732) |
In 4 person carpool:
| Paramount: | 1.5% (251) |
| California: | 1.0% (119,364) |
In 5-6 person carpool:
| Paramount: | 0.6% (95) |
| California: | 0.5% (57,036) |
In 7+ person carpool:
| Paramount: | 0.1% (24) |
| California: | 0.3% (41,276) |
Class of workers
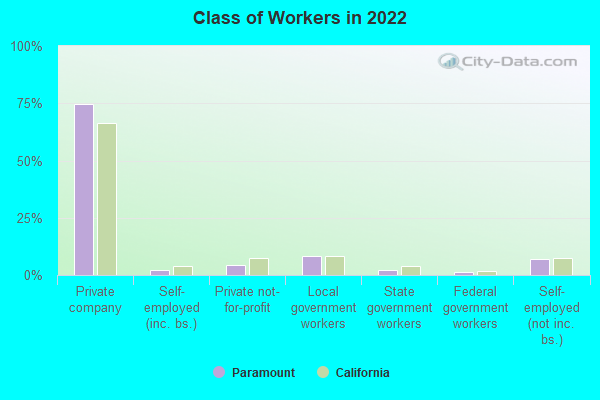
Employee of private company:
| Paramount: | 74.8% (18,969) |
| California: | 66.5% (12,596,030) |
Self-employed in own incorporated business:
| Paramount: | 2.1% (530) |
| California: | 4.1% (784,709) |
Private not-for-profit wage and salary workers:
| Paramount: | 4.2% (1,069) |
| California: | 7.5% (1,417,407) |
Local government workers:
| Paramount: | 8.4% (2,140) |
| California: | 8.2% (1,547,056) |
State government workers:
| Paramount: | 2.1% (533) |
| California: | 4.1% (780,915) |
Federal government workers:
| Paramount: | 1.4% (356) |
| California: | 2.0% (369,858) |
Self-employed workers in own not incorporated business:
| Paramount: | 6.9% (1,741) |
| California: | 7.4% (1,410,735) |
Unpaid family workers:
| Paramount: | 0.1% (29) |
| California: | 0.2% (36,267) |

Employee of private company:
| Paramount: | 78.0% (14,715) |
| California: | 68.0% (10,009,465) |
Self-employed in own incorporated business:
| Paramount: | 1.2% (232) |
| California: | 2.7% (402,392) |
Private not-for-profit wage and salary workers:
| Paramount: | 3.9% (731) |
| California: | 5.7% (845,536) |
Local government workers:
| Paramount: | 7.1% (1,337) |
| California: | 8.3% (1,218,764) |
State government workers:
| Paramount: | 2.1% (393) |
| California: | 4.0% (594,953) |
Federal government workers:
| Paramount: | 1.6% (306) |
| California: | 2.3% (344,354) |
Self-employed workers in own not incorporated business:
| Paramount: | 5.8% (1,102) |
| California: | 8.5% (1,249,530) |
Unpaid family workers:
| Paramount: | 0.2% (42) |
| California: | 0.4% (53,934) |
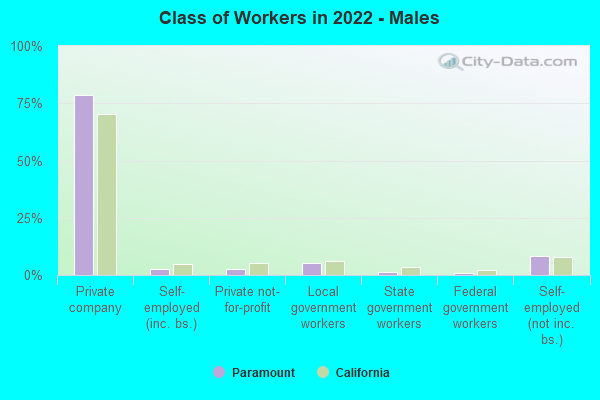
Employee of private company - Males:
| Paramount: | 78.8% (11,118) |
| California: | 70.3% (7,191,252) |
Self-employed in own incorporated business - Males:
| Paramount: | 2.5% (349) |
| California: | 4.9% (504,764) |
Private not-for-profit wage and salary workers - Males:
| Paramount: | 2.5% (346) |
| California: | 5.2% (529,122) |
Local government workers - Males:
| Paramount: | 5.5% (770) |
| California: | 6.0% (610,331) |
State government workers - Males:
| Paramount: | 1.5% (214) |
| California: | 3.4% (343,636) |
Federal government workers - Males:
| Paramount: | 1.0% (135) |
| California: | 2.1% (209,874) |
Self-employed workers in own not incorporated business - Males:
| Paramount: | 8.3% (1,170) |
| California: | 8.1% (824,359) |
Unpaid family workers - Males:
| Paramount: | 0.1% (11) |
| California: | 0.2% (17,922) |
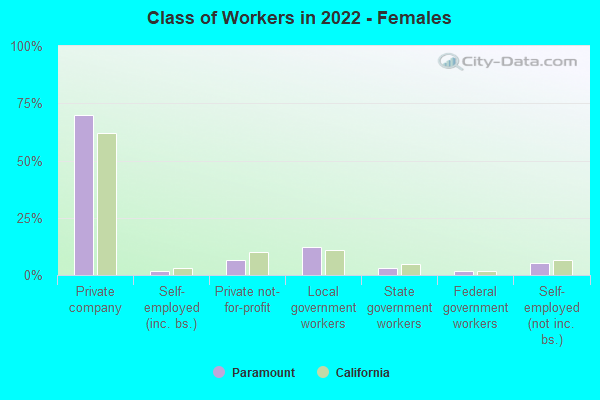
Employee of private company - Females:
| Paramount: | 69.8% (7,851) |
| California: | 62.0% (5,404,778) |
Self-employed in own incorporated business - Females:
| Paramount: | 1.6% (181) |
| California: | 3.2% (279,945) |
Private not-for-profit wage and salary workers - Females:
| Paramount: | 6.4% (722) |
| California: | 10.2% (888,285) |
Local government workers - Females:
| Paramount: | 12.2% (1,371) |
| California: | 10.8% (936,725) |
State government workers - Females:
| Paramount: | 2.8% (319) |
| California: | 5.0% (437,279) |
Federal government workers - Females:
| Paramount: | 2.0% (221) |
| California: | 1.8% (159,984) |
Self-employed workers in own not incorporated business - Females:
| Paramount: | 5.1% (571) |
| California: | 6.7% (586,376) |
Unpaid family workers - Females:
| Paramount: | 0.2% (18) |
| California: | 0.2% (18,345) |