Work and Jobs in Pittsburg, California (CA) Detailed Stats
Occupations, Industries, Unemployment, Workers, Commute
Settings
X


Recent posts about work in Pittsburg, California on our local forum with over 2,400,000 registered users:
 | Pittsburg’s steel mill (2 replies) |
| SF/Bay Area Crime Thread (1410 replies) |
| Your thoughts about Concord (50 replies) |
| CA Cities(Pop 65,000+) by Median Household Income, 2019 (8 replies) |
| Fresno Struggles With $15 Min Wage (290 replies) |
| Where to live with housing voucher (10 replies) |
Latest news about work in Pittsburg, CA collected exclusively by city-data.com from local newspapers, TV, and radio stations
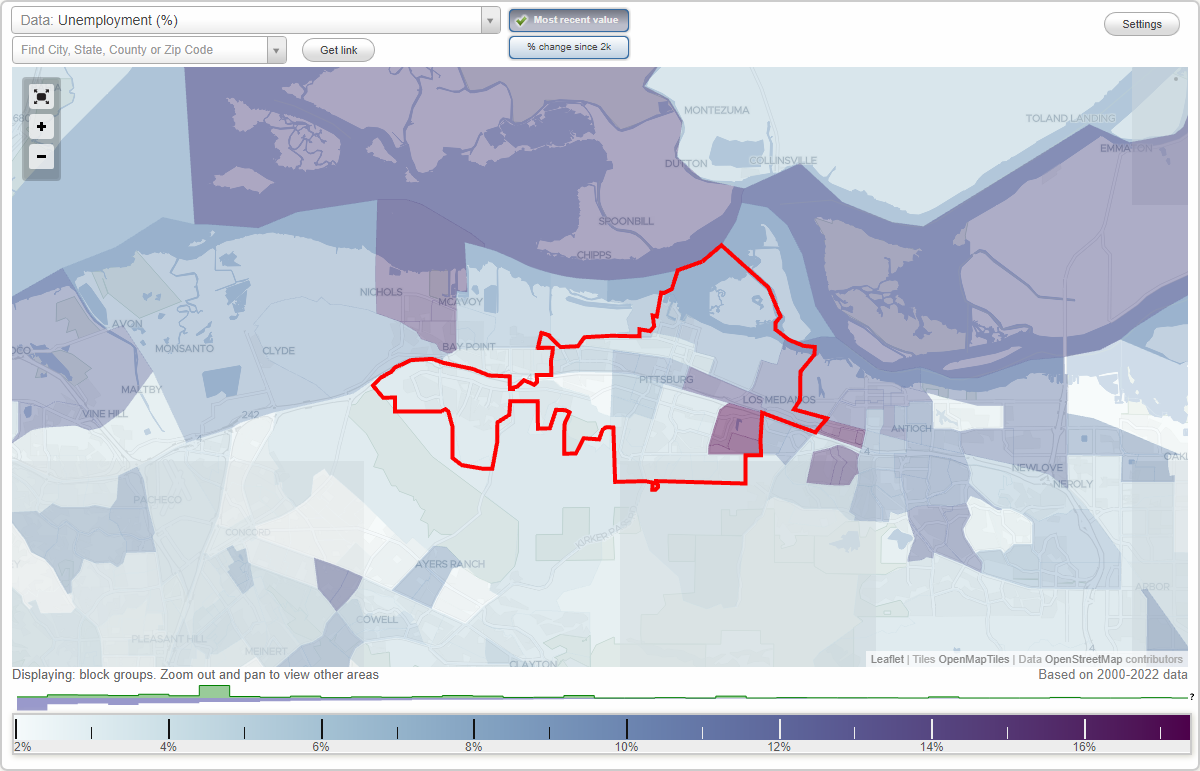
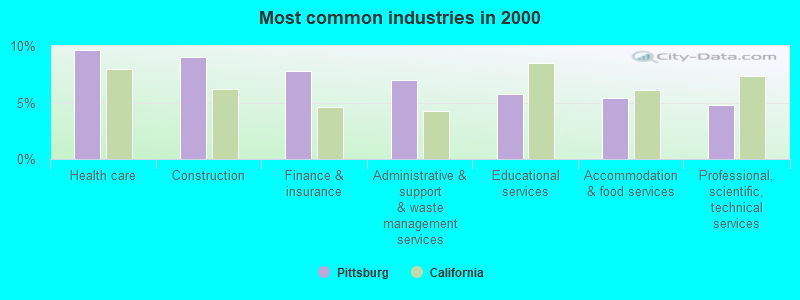
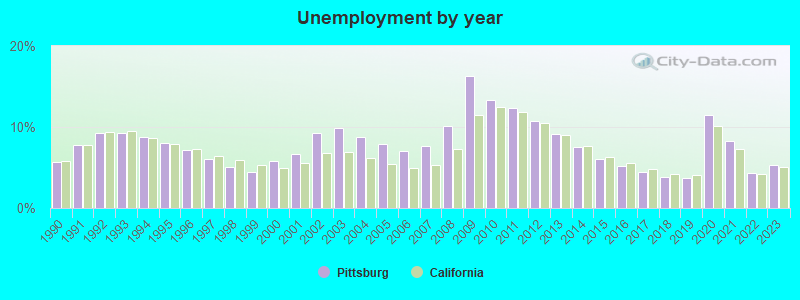
The unemployment rate in 2023 in Pittsburg, CA was 5.3%, which was 3.8% greater than the unemployment rate of 5.1% across the entire state of California. Compared to the unemployment rate of 9.1% in 2013, this represents a decrease of 71.7%. The most common industries in Pittsburg are: Health care (9.6% of civilian employees), Construction (9.0% of civilian employees), Finance & insurance (7.8% of civilian employees). 70.5% of workers work in Contra Costa County and 7.0% of all workers work at home. 67.2% of workers are employees of private companies, which is about the same as the rate of 66.5% across the entire state of California.
Whole page based on the data from 2000 / 2022 when the population of Pittsburg, California was 56,769 / 77,585
Whole page based on the data from 2000 / 2022 when the population of Pittsburg, California was 56,769 / 77,585
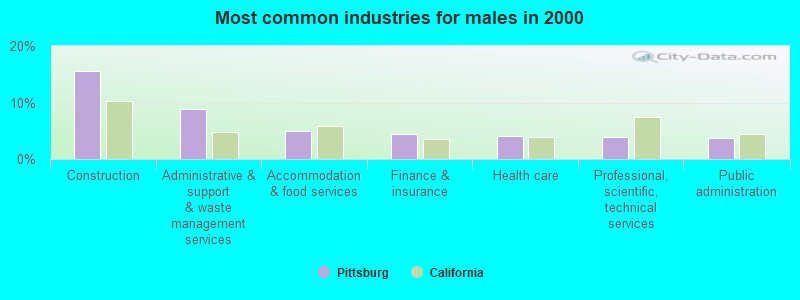
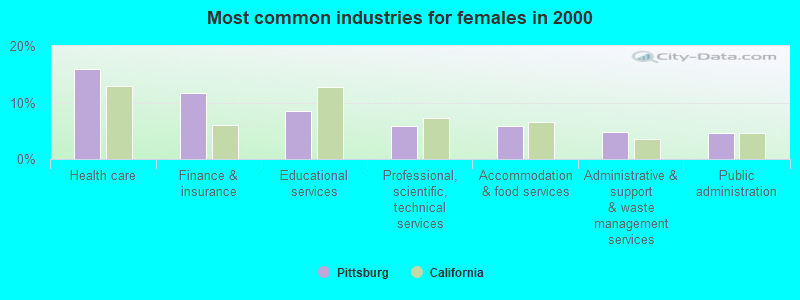
Most common industries
Most common industries | |||
|---|---|---|---|
Industry | All | Males | Females |
| Health care | 9.6% (2,376) | 4.1% (536) | 16.0% (1,840) |
| Construction | 9.0% (2,227) | 15.6% (2,055) | 1.5% (172) |
| Finance and insurance | 7.8% (1,920) | 4.4% (575) | 11.7% (1,345) |
| Administrative and support and waste management services | 7.0% (1,725) | 8.9% (1,175) | 4.8% (550) |
| Educational services | 5.7% (1,409) | 3.3% (435) | 8.5% (974) |
| Accommodation and food services | 5.4% (1,328) | 5.0% (661) | 5.8% (667) |
| Professional, scientific, and technical services | 4.8% (1,179) | 3.8% (503) | 5.9% (676) |
| Public administration | 4.2% (1,029) | 3.8% (500) | 4.6% (529) |
| Other transportation, and support activities, and couriers | 2.8% (691) | 3.7% (491) | 1.7% (200) |
| Department and other general merchandise stores | 2.5% (610) | 1.7% (229) | 3.3% (381) |
| Food and beverage stores | 2.4% (587) | 2.2% (287) | 2.6% (300) |
| Broadcasting and telecommunications | 2.3% (576) | 2.4% (320) | 2.2% (256) |
| Social assistance | 2.2% (541) | 0.6% (81) | 4.0% (460) |
| Repair and maintenance | 2.0% (486) | 3.2% (427) | 0.5% (59) |
| Real estate and rental and leasing | 2.0% (483) | 2.2% (283) | 1.7% (200) |
| Personal and laundry services | 1.6% (402) | 0.9% (112) | 2.5% (290) |
| U. S. Postal service | 1.6% (390) | 2.1% (272) | 1.0% (118) |
| Computer and electronic products | 1.4% (337) | 1.5% (195) | 1.2% (142) |
| Chemicals | 1.4% (336) | 1.6% (205) | 1.1% (131) |
| Motor vehicle and parts dealers | 1.3% (322) | 1.9% (255) | 0.6% (67) |
| Metal and metal products | 1.2% (295) | 1.9% (245) | 0.4% (50) |
| Arts, entertainment, and recreation | 1.2% (292) | 1.6% (204) | 0.8% (88) |
| Truck transportation | 1.2% (289) | 2.1% (278) | 0.1% (11) |
| Miscellaneous manufacturing | 1.1% (280) | 1.2% (161) | 1.0% (119) |
| Religious, grantmaking, civic, professional, and similar organizations | 1.1% (269) | 1.0% (131) | 1.2% (138) |
| Utilities | 1.1% (266) | 1.6% (212) | 0.5% (54) |
| Building material and garden equipment and supplies dealers | 1.0% (243) | 1.2% (155) | 0.8% (88) |
| Publishing, and motion picture and sound recording industries | 0.9% (225) | 1.1% (148) | 0.7% (77) |
| Private households | 0.9% (211) | 0.2% (23) | 1.6% (188) |
| Petroleum and coal products | 0.7% (179) | 0.9% (113) | 0.6% (66) |
| Other direct selling establishments | 0.7% (179) | 0.8% (109) | 0.6% (70) |
| Clothing and accessories, including shoe, stores | 0.7% (170) | 0.5% (71) | 0.9% (99) |
| Groceries and related products merchant wholesalers | 0.7% (166) | 0.7% (95) | 0.6% (71) |
| Radio, TV, and computer stores | 0.6% (148) | 0.5% (64) | 0.7% (84) |
| Food | 0.6% (137) | 0.5% (61) | 0.7% (76) |
| Transportation equipment | 0.6% (136) | 0.9% (123) | 0.1% (13) |
| Used merchandise, gift, novelty, and souvenir, and other miscellaneous stores | 0.5% (133) | 0.3% (44) | 0.8% (89) |
| Furniture and home furnishings, and household appliance stores | 0.5% (129) | 0.8% (108) | 0.2% (21) |
| Pharmacies and drug stores | 0.5% (124) | 0.2% (28) | 0.8% (96) |
| Air transportation | 0.5% (122) | 0.6% (81) | 0.4% (41) |
| Data processing, libraries, and other information services | 0.5% (120) | 0.3% (37) | 0.7% (83) |
| Agriculture, forestry, fishing and hunting | 0.4% (98) | 0.7% (89) | 0.1% (9) |
| Printing and related support activities | 0.4% (91) | 0.6% (80) | 0.1% (11) |
| Electrical and electronic goods merchant wholesalers | 0.4% (91) | 0.5% (67) | 0.2% (24) |
| Gasoline stations | 0.4% (87) | 0.4% (47) | 0.3% (40) |
| Machinery | 0.3% (79) | 0.2% (30) | 0.4% (49) |
| Professional and commercial equipment and supplies merchant wholesalers | 0.3% (77) | 0.4% (57) | 0.2% (20) |
| Metals and minerals, except petroleum, merchant wholesalers | 0.3% (64) | 0.5% (64) | 0.0% (0) |
| Paper | 0.3% (62) | 0.4% (58) | 0.0% (4) |
| Motor vehicles, parts and supplies merchant wholesalers | 0.2% (60) | 0.3% (41) | 0.2% (19) |
| Music stores | 0.2% (57) | 0.2% (32) | 0.2% (25) |
| Machinery, equipment, and supplies merchant wholesalers | 0.2% (56) | 0.2% (20) | 0.3% (36) |
| Sporting goods, camera, and hobby and toy stores | 0.2% (55) | 0.3% (41) | 0.1% (14) |
| Office supplies and stationery stores | 0.2% (55) | 0.2% (29) | 0.2% (26) |
| Miscellaneous nondurable goods merchant wholesalers | 0.2% (53) | 0.2% (31) | 0.2% (22) |
| Furniture and home furnishing merchant wholesalers | 0.2% (51) | 0.3% (40) | 0.1% (11) |
| Jewelry, luggage, and leather goods stores | 0.2% (50) | 0.1% (13) | 0.3% (37) |
| Electronic shopping and mail-order houses | 0.2% (49) | 0.2% (29) | 0.2% (20) |
| Furniture and related product manufacturing | 0.2% (48) | 0.3% (42) | 0.1% (6) |
| Mining, quarrying, and oil and gas extraction | 0.2% (47) | 0.2% (28) | 0.2% (19) |
| Retail florists | 0.2% (39) | 0.1% (13) | 0.2% (26) |
| Nonmetallic mineral products | 0.2% (38) | 0.2% (27) | 0.1% (11) |
| Electrical equipment, appliances, and components | 0.1% (36) | 0.2% (26) | 0.1% (10) |
| Water transportation | 0.1% (30) | 0.2% (25) | 0.0% (5) |
| Drugs, sundries, and chemical and allied products merchant wholesalers | 0.1% (29) | 0.1% (13) | 0.1% (16) |
| Petroleum and petroleum products merchant wholesalers | 0.1% (28) | 0.0% (6) | 0.2% (22) |
| Paper and paper products merchant wholesalers | 0.1% (27) | 0.2% (21) | 0.1% (6) |
| Recyclable material merchant wholesalers | 0.1% (27) | 0.2% (27) | 0.0% (0) |
| Alcoholic beverages merchant wholesalers | 0.1% (18) | 0.1% (18) | 0.0% (0) |
Unemployment in Pittsburg
- Unemployment by race in 2022
- Unemployment rate for White non-Hispanic residents
- 17.9%Males
- 14.9%Females
- Unemployment rate for Black residents
- 11.2%Males
- 13.2%Females
- Unemployment rate for American Indian and Alaska Native residents
- 14.0%Males
- 6.1%Females
- Unemployment rate for Asian residents
- 4.6%Males
- 5.8%Females
- Unemployment rate for other race residents
- 3.9%Males
- 3.7%Females
- Unemployment rate for two or more race residents
- 5.4%Males
- 5.6%Females
- Unemployment rate for Hispanic or Latino residents
- 2.9%Males
- 5.7%Females
- Unemployment by race in 2000
- Unemployment rate for White non-Hispanic residents
- 6.1%Males
- 4.8%Females
- Unemployment rate for Black residents
- 12.2%Males
- 10.9%Females
- Unemployment rate for American Indian and Alaska Native residents
- 9.0%Females
- Unemployment rate for Asian residents
- 7.2%Males
- 4.4%Females
- Unemployment rate for other race residents
- 9.3%Males
- 7.4%Females
- Unemployment rate for two or more race residents
- 7.1%Males
- 3.2%Females
- Unemployment rate for Hispanic or Latino residents
- 8.2%Males
- 7.7%Females
Unemployment in 2023:
| Pittsburg: | 5.3% |
| California: | 5.1% |
Unemployment in 2022:
| Pittsburg: | 4.3% |
| California: | 4.2% |
Unemployment in 2021:
| Pittsburg: | 8.3% |
| California: | 7.3% |
Unemployment in 2020:
| Pittsburg: | 11.5% |
| California: | 10.1% |
Unemployment in 2019:
| Pittsburg: | 3.7% |
| California: | 4.1% |
Unemployment in 2018:
| Pittsburg: | 3.8% |
| California: | 4.2% |
Unemployment in 2017:
| Pittsburg: | 4.5% |
| California: | 4.8% |
Unemployment in 2016:
| Pittsburg: | 5.2% |
| California: | 5.5% |
Unemployment in 2015:
| Pittsburg: | 6.1% |
| California: | 6.3% |
Unemployment in 2014:
| Pittsburg: | 7.5% |
| California: | 7.6% |
Unemployment in 2013:
| Pittsburg: | 9.1% |
| California: | 9.0% |
Unemployment in 2012:
| Pittsburg: | 10.8% |
| California: | 10.5% |
Unemployment in 2011:
| Pittsburg: | 12.4% |
| California: | 11.9% |
Unemployment in 2010:
| Pittsburg: | 13.3% |
| California: | 12.5% |
Unemployment in 2009:
| Pittsburg: | 16.3% |
| California: | 11.5% |
Unemployment in 2008:
| Pittsburg: | 10.1% |
| California: | 7.3% |
Unemployment in 2007:
| Pittsburg: | 7.6% |
| California: | 5.3% |
Unemployment in 2006:
| Pittsburg: | 7.0% |
| California: | 4.9% |
Unemployment in 2005:
| Pittsburg: | 7.9% |
| California: | 5.4% |
Unemployment in 2004:
| Pittsburg: | 8.8% |
| California: | 6.2% |
Unemployment in 2003:
| Pittsburg: | 9.9% |
| California: | 6.9% |
Unemployment in 2002:
| Pittsburg: | 9.3% |
| California: | 6.8% |
Unemployment in 2001:
| Pittsburg: | 6.7% |
| California: | 5.5% |
Unemployment in 2000:
| Pittsburg: | 5.8% |
| California: | 4.9% |
Unemployment in 1999:
| Pittsburg: | 4.4% |
| California: | 5.3% |
Unemployment in 1998:
| Pittsburg: | 5.1% |
| California: | 5.9% |
Unemployment in 1997:
| Pittsburg: | 6.0% |
| California: | 6.4% |
Unemployment in 1996:
| Pittsburg: | 7.1% |
| California: | 7.3% |
Unemployment in 1995:
| Pittsburg: | 8.0% |
| California: | 7.9% |
Unemployment in 1994:
| Pittsburg: | 8.8% |
| California: | 8.7% |
Unemployment in 1993:
| Pittsburg: | 9.3% |
| California: | 9.5% |
Unemployment in 1992:
| Pittsburg: | 9.3% |
| California: | 9.4% |
Unemployment in 1991:
| Pittsburg: | 7.8% |
| California: | 7.8% |
Unemployment in 1990:
| Pittsburg: | 5.7% |
| California: | 5.8% |
Time leaving home to go to work
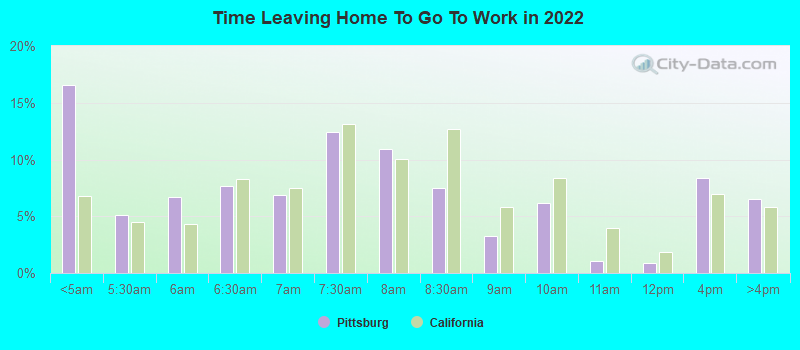
12:00 a.m. to 4:59 a.m.:
| Pittsburg: | 16.6% (5,587) |
| California: | 6.8% (1,050,902) |
5:00 a.m. to 5:29 a.m.:
| Pittsburg: | 5.1% (1,717) |
| California: | 4.5% (692,772) |
5:30 a.m. to 5:59 a.m.:
| Pittsburg: | 6.7% (2,270) |
| California: | 4.3% (665,475) |
6:00 a.m. to 6:29 a.m.:
| Pittsburg: | 7.6% (2,581) |
| California: | 8.3% (1,273,588) |
6:30 a.m. to 6:59 a.m.:
| Pittsburg: | 6.9% (2,330) |
| California: | 7.5% (1,156,338) |
7:00 a.m. to 7:29 a.m.:
| Pittsburg: | 12.5% (4,203) |
| California: | 13.2% (2,027,702) |
7:30 a.m. to 7:59 a.m.:
| Pittsburg: | 10.9% (3,678) |
| California: | 10.1% (1,550,402) |
8:00 a.m. to 8:29 a.m.:
| Pittsburg: | 7.5% (2,529) |
| California: | 12.7% (1,953,986) |
8:30 a.m. to 8:59 a.m.:
| Pittsburg: | 3.2% (1,095) |
| California: | 5.8% (890,950) |
9:00 a.m. to 9:59 a.m.:
| Pittsburg: | 6.2% (2,076) |
| California: | 8.4% (1,288,499) |
10:00 a.m. to 10:59 a.m.:
| Pittsburg: | 1.0% (344) |
| California: | 4.0% (613,193) |
11:00 a.m. to 11:59 a.m.:
| Pittsburg: | 0.9% (309) |
| California: | 1.8% (280,975) |
12:00 p.m. to 3:59 p.m.:
| Pittsburg: | 8.4% (2,824) |
| California: | 7.0% (1,075,505) |
4:00 p.m. to 11:59 p.m.:
| Pittsburg: | 6.5% (2,197) |
| California: | 5.8% (891,240) |
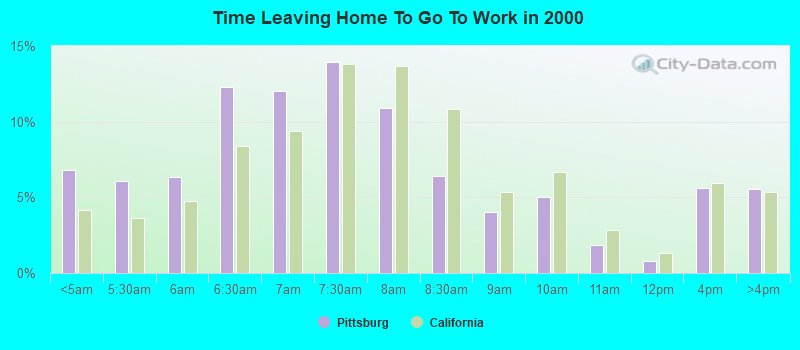
<5am:
| Pittsburg: | 6.8% (1,637) |
| California: | 4.2% (606,086) |
5:30am:
| Pittsburg: | 6.1% (1,453) |
| California: | 3.6% (523,209) |
6am:
| Pittsburg: | 6.4% (1,521) |
| California: | 4.8% (692,256) |
6:30am:
| Pittsburg: | 12.3% (2,937) |
| California: | 8.4% (1,216,867) |
7am:
| Pittsburg: | 12.0% (2,883) |
| California: | 9.4% (1,362,830) |
7:30am:
| Pittsburg: | 13.9% (3,335) |
| California: | 13.8% (2,006,950) |
8am:
| Pittsburg: | 10.9% (2,617) |
| California: | 13.7% (1,986,831) |
8:30am:
| Pittsburg: | 6.4% (1,537) |
| California: | 10.9% (1,577,815) |
9am:
| Pittsburg: | 4.1% (970) |
| California: | 5.4% (778,152) |
10am:
| Pittsburg: | 5.0% (1,209) |
| California: | 6.7% (972,355) |
11am:
| Pittsburg: | 1.9% (446) |
| California: | 2.9% (414,479) |
12pm:
| Pittsburg: | 0.8% (197) |
| California: | 1.3% (189,005) |
4pm:
| Pittsburg: | 5.6% (1,349) |
| California: | 6.0% (865,284) |
>4pm:
| Pittsburg: | 5.5% (1,327) |
| California: | 5.3% (776,167) |
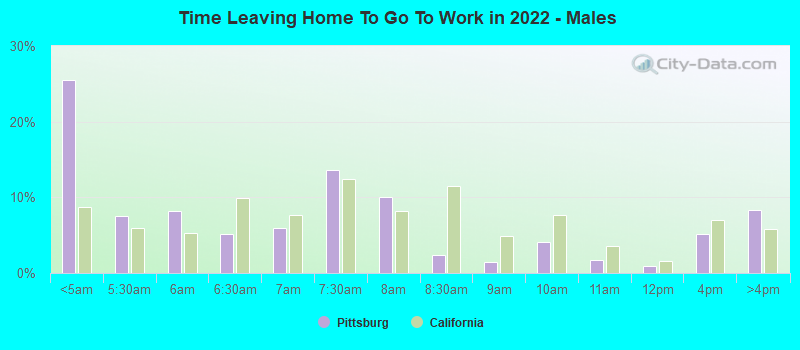
12:00 a.m. to 4:59 a.m. - Males:
| Pittsburg: | 25.5% (4,351) |
| California: | 8.7% (747,612) |
5:00 a.m. to 5:29 a.m. - Males:
| Pittsburg: | 7.5% (1,275) |
| California: | 6.0% (509,420) |
5:30 a.m. to 5:59 a.m. - Males:
| Pittsburg: | 8.2% (1,393) |
| California: | 5.2% (448,269) |
6:00 a.m. to 6:29 a.m. - Males:
| Pittsburg: | 5.1% (873) |
| California: | 9.8% (842,941) |
6:30 a.m. to 6:59 a.m. - Males:
| Pittsburg: | 5.9% (1,008) |
| California: | 7.7% (657,557) |
7:00 a.m. to 7:29 a.m. - Males:
| Pittsburg: | 13.6% (2,326) |
| California: | 12.4% (1,058,532) |
7:30 a.m. to 7:59 a.m. - Males:
| Pittsburg: | 10.0% (1,703) |
| California: | 8.2% (702,727) |
8:00 a.m. to 8:29 a.m. - Males:
| Pittsburg: | 2.4% (403) |
| California: | 11.5% (984,538) |
8:30 a.m. to 8:59 a.m. - Males:
| Pittsburg: | 1.5% (256) |
| California: | 4.8% (414,815) |
9:00 a.m. to 9:59 a.m. - Males:
| Pittsburg: | 4.1% (705) |
| California: | 7.7% (655,038) |
10:00 a.m. to 10:59 a.m. - Males:
| Pittsburg: | 1.7% (294) |
| California: | 3.5% (301,425) |
11:00 a.m. to 11:59 a.m. - Males:
| Pittsburg: | 0.9% (160) |
| California: | 1.7% (141,620) |
12:00 p.m. to 3:59 p.m. - Males:
| Pittsburg: | 5.2% (888) |
| California: | 7.0% (594,847) |
4:00 p.m. to 11:59 p.m. - Males:
| Pittsburg: | 8.3% (1,424) |
| California: | 5.8% (499,471) |
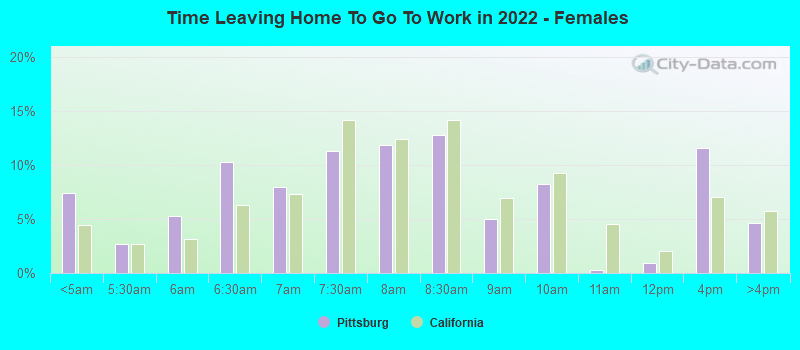
12:00 a.m. to 4:59 a.m. - Females:
| Pittsburg: | 7.4% (1,236) |
| California: | 4.4% (303,290) |
5:00 a.m. to 5:29 a.m. - Females:
| Pittsburg: | 2.6% (442) |
| California: | 2.7% (183,352) |
5:30 a.m. to 5:59 a.m. - Females:
| Pittsburg: | 5.3% (877) |
| California: | 3.2% (217,206) |
6:00 a.m. to 6:29 a.m. - Females:
| Pittsburg: | 10.2% (1,708) |
| California: | 6.3% (430,647) |
6:30 a.m. to 6:59 a.m. - Females:
| Pittsburg: | 7.9% (1,322) |
| California: | 7.3% (498,781) |
7:00 a.m. to 7:29 a.m. - Females:
| Pittsburg: | 11.3% (1,877) |
| California: | 14.1% (969,170) |
7:30 a.m. to 7:59 a.m. - Females:
| Pittsburg: | 11.8% (1,975) |
| California: | 12.4% (847,675) |
8:00 a.m. to 8:29 a.m. - Females:
| Pittsburg: | 12.7% (2,126) |
| California: | 14.1% (969,448) |
8:30 a.m. to 8:59 a.m. - Females:
| Pittsburg: | 5.0% (839) |
| California: | 6.9% (476,135) |
9:00 a.m. to 9:59 a.m. - Females:
| Pittsburg: | 8.2% (1,371) |
| California: | 9.2% (633,461) |
10:00 a.m. to 10:59 a.m. - Females:
| Pittsburg: | 0.3% (50) |
| California: | 4.5% (311,768) |
11:00 a.m. to 11:59 a.m. - Females:
| Pittsburg: | 0.9% (149) |
| California: | 2.0% (139,355) |
12:00 p.m. to 3:59 p.m. - Females:
| Pittsburg: | 11.6% (1,936) |
| California: | 7.0% (480,658) |
4:00 p.m. to 11:59 p.m. - Females:
| Pittsburg: | 4.6% (773) |
| California: | 5.7% (391,769) |
Travel time to work
Percentage of workers working in this county: 70.5%
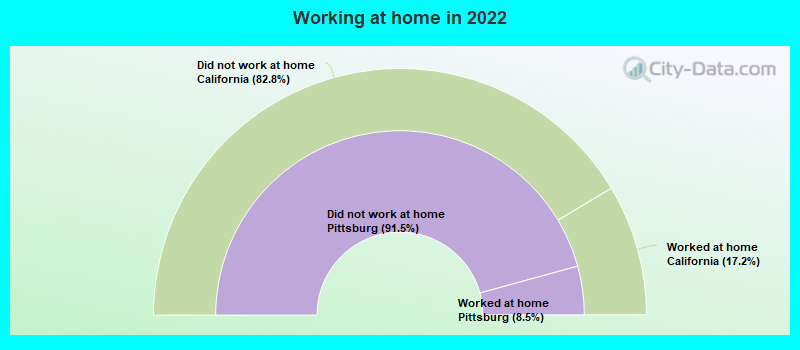
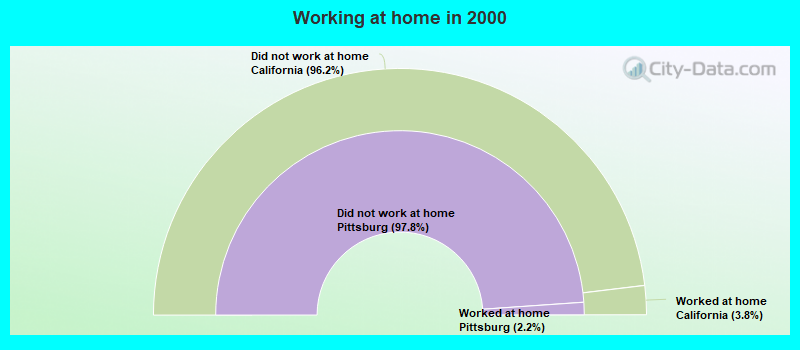
Number of people working at home: 2,476 (7.0% of all workers)
Daytime population change due to commuting: -10,305 (-18.2%)
Workers who live and work in this city: 4,541 (19.0%)
Number of people working at home: 2,476 (7.0% of all workers)
Daytime population change due to commuting: -10,305 (-18.2%)
Workers who live and work in this city: 4,541 (19.0%)
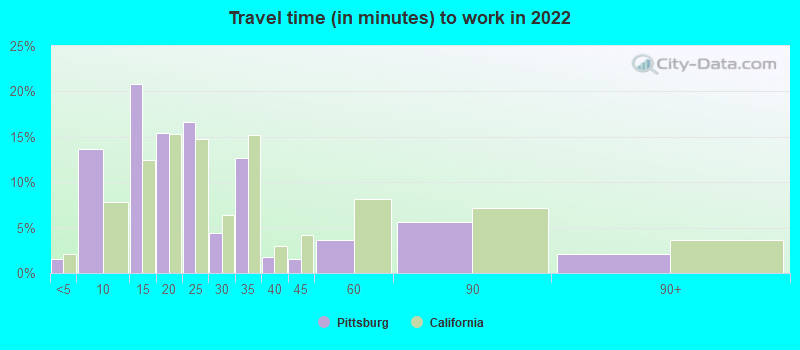
Less than 5 minutes:
| Pittsburg: | 1.5% (243) |
| California: | 2.1% (323,064) |
5 to 9 minutes:
| Pittsburg: | 13.7% (2,145) |
| California: | 7.8% (1,208,682) |
10 to 14 minutes:
| Pittsburg: | 20.9% (3,277) |
| California: | 12.4% (1,917,610) |
15 to 19 minutes:
| Pittsburg: | 15.4% (2,419) |
| California: | 15.3% (2,367,483) |
20 to 24 minutes:
| Pittsburg: | 16.7% (2,619) |
| California: | 14.8% (2,279,693) |
25 to 29 minutes:
| Pittsburg: | 4.5% (701) |
| California: | 6.4% (981,997) |
30 to 34 minutes:
| Pittsburg: | 12.7% (1,992) |
| California: | 15.2% (2,339,223) |
35 to 39 minutes:
| Pittsburg: | 1.8% (277) |
| California: | 2.9% (453,226) |
40 to 44 minutes:
| Pittsburg: | 1.5% (243) |
| California: | 4.1% (637,781) |
45 to 59 minutes:
| Pittsburg: | 3.6% (565) |
| California: | 8.2% (1,259,482) |
60 to 89 minutes:
| Pittsburg: | 5.6% (885) |
| California: | 7.2% (1,111,698) |
90 or more minutes:
| Pittsburg: | 2.1% (335) |
| California: | 3.6% (552,805) |
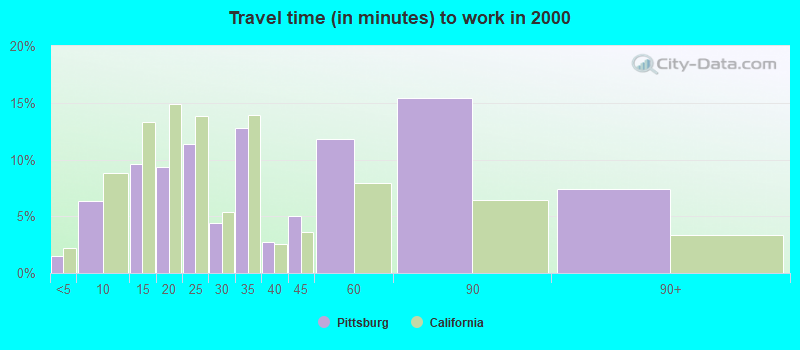
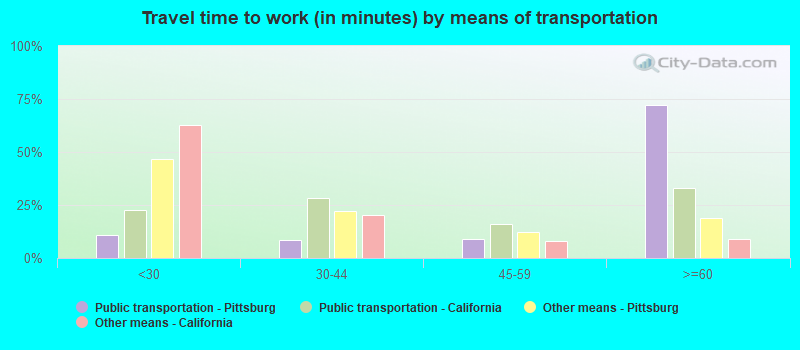
Less than 5 minutes:
| Pittsburg: | 1.5% (352) |
| California: | 2.2% (324,703) |
5 to 9 minutes:
| Pittsburg: | 6.4% (1,524) |
| California: | 8.8% (1,280,443) |
10 to 14 minutes:
| Pittsburg: | 9.6% (2,306) |
| California: | 13.3% (1,930,263) |
15 to 19 minutes:
| Pittsburg: | 9.3% (2,235) |
| California: | 14.9% (2,157,970) |
20 to 24 minutes:
| Pittsburg: | 11.4% (2,730) |
| California: | 13.8% (2,004,060) |
25 to 29 minutes:
| Pittsburg: | 4.4% (1,054) |
| California: | 5.4% (782,241) |
30 to 34 minutes:
| Pittsburg: | 12.8% (3,067) |
| California: | 13.9% (2,025,657) |
35 to 39 minutes:
| Pittsburg: | 2.8% (663) |
| California: | 2.5% (366,487) |
40 to 44 minutes:
| Pittsburg: | 5.0% (1,201) |
| California: | 3.6% (528,043) |
45 to 59 minutes:
| Pittsburg: | 11.8% (2,823) |
| California: | 7.9% (1,151,598) |
60 to 89 minutes:
| Pittsburg: | 15.4% (3,690) |
| California: | 6.4% (933,123) |
90 or more minutes:
| Pittsburg: | 7.4% (1,773) |
| California: | 3.3% (483,698) |
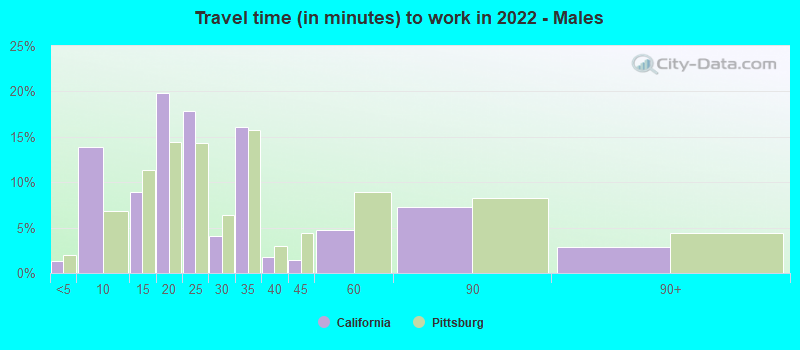
Less than 5 minutes - Males:
| Pittsburg: | 1.4% (123) |
| California: | 2.0% (173,603) |
5 to 9 minutes - Males:
| Pittsburg: | 13.9% (1,246) |
| California: | 6.8% (580,822) |
10 to 14 minutes - Males:
| Pittsburg: | 9.0% (804) |
| California: | 11.4% (974,497) |
15 to 19 minutes - Males:
| Pittsburg: | 19.9% (1,784) |
| California: | 14.5% (1,239,386) |
20 to 24 minutes - Males:
| Pittsburg: | 17.8% (1,601) |
| California: | 14.3% (1,223,429) |
25 to 29 minutes - Males:
| Pittsburg: | 4.1% (366) |
| California: | 6.4% (545,844) |
30 to 34 minutes - Males:
| Pittsburg: | 16.1% (1,445) |
| California: | 15.8% (1,352,210) |
35 to 39 minutes - Males:
| Pittsburg: | 1.7% (157) |
| California: | 3.0% (253,732) |
40 to 44 minutes - Males:
| Pittsburg: | 1.4% (124) |
| California: | 4.4% (376,144) |
45 to 59 minutes - Males:
| Pittsburg: | 4.7% (423) |
| California: | 8.9% (762,659) |
60 to 89 minutes - Males:
| Pittsburg: | 7.3% (655) |
| California: | 8.3% (711,394) |
90 or more minutes - Males:
| Pittsburg: | 2.8% (255) |
| California: | 4.4% (378,954) |
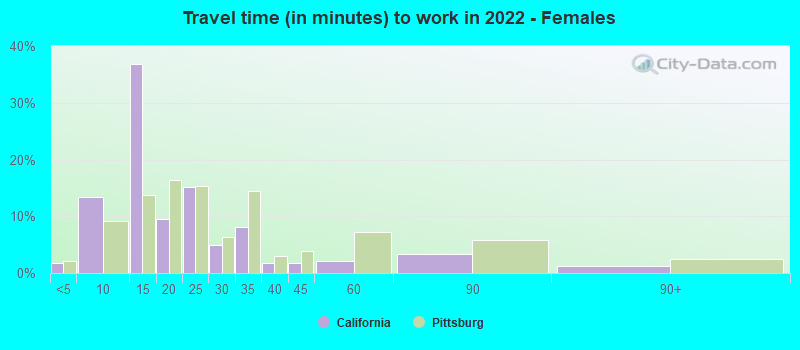
Less than 5 minutes - Females:
| Pittsburg: | 1.8% (120) |
| California: | 2.2% (149,461) |
5 to 9 minutes - Females:
| Pittsburg: | 13.4% (899) |
| California: | 9.2% (627,860) |
10 to 14 minutes - Females:
| Pittsburg: | 36.8% (2,473) |
| California: | 13.7% (943,113) |
15 to 19 minutes - Females:
| Pittsburg: | 9.5% (635) |
| California: | 16.4% (1,128,097) |
20 to 24 minutes - Females:
| Pittsburg: | 15.2% (1,018) |
| California: | 15.4% (1,056,264) |
25 to 29 minutes - Females:
| Pittsburg: | 5.0% (335) |
| California: | 6.4% (436,153) |
30 to 34 minutes - Females:
| Pittsburg: | 8.1% (547) |
| California: | 14.4% (987,013) |
35 to 39 minutes - Females:
| Pittsburg: | 1.8% (120) |
| California: | 2.9% (199,494) |
40 to 44 minutes - Females:
| Pittsburg: | 1.8% (119) |
| California: | 3.8% (261,637) |
45 to 59 minutes - Females:
| Pittsburg: | 2.1% (142) |
| California: | 7.2% (496,823) |
60 to 89 minutes - Females:
| Pittsburg: | 3.4% (230) |
| California: | 5.8% (400,304) |
90 or more minutes - Females:
| Pittsburg: | 1.2% (80) |
| California: | 2.5% (173,851) |
Means of transportation to work
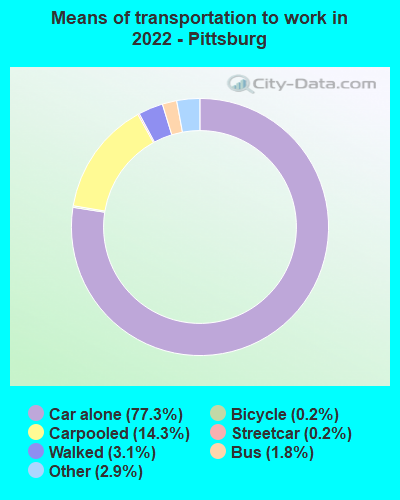

Drove car alone:
| Pittsburg: | 77.3% (10,943) |
| California: | 79.1% (5,345,368) |
Carpooled:
| Pittsburg: | 14.3% (2,027) |
| California: | 11.9% (878,699) |
Bus:
| Pittsburg: | 1.8% (260) |
| California: | 2.2% (170,574) |
Subway or elevated rail:
| Pittsburg: | 0.2% (34) |
| California: | 0.6% (40,665) |
Light rail, streetcar or trolley:
| Pittsburg: | 0.1% (10) |
| California: | 0.1% (8,965) |
Bicycle:
| Pittsburg: | 0.2% (25) |
| California: | 0.9% (39,197) |
Walked:
| Pittsburg: | 3.1% (438) |
| California: | 2.9% (218,374) |
Other means:
| Pittsburg: | 2.9% (417) |
| California: | 2.1% (137,489) |
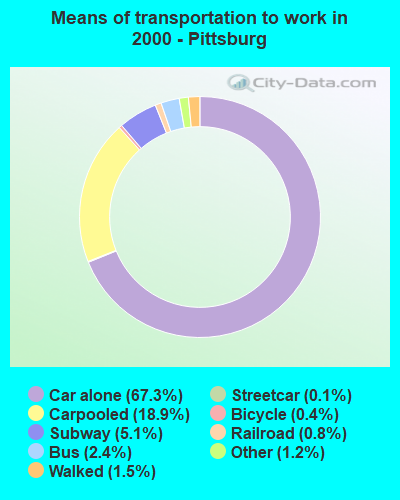

Drove car alone:
| Pittsburg: | 67.3% (16,117) |
| California: | 71.8% (10,432,462) |
Carpooled:
| Pittsburg: | 18.9% (4,517) |
| California: | 14.5% (2,113,313) |
Bus or trolley bus:
| Pittsburg: | 2.4% (586) |
| California: | 3.8% (549,425) |
Streetcar or trolley car:
| Pittsburg: | 0.1% (34) |
| California: | 0.1% (21,158) |
Subway or elevated:
| Pittsburg: | 5.1% (1,213) |
| California: | 0.7% (107,711) |
Railroad:
| Pittsburg: | 0.8% (200) |
| California: | 0.3% (41,022) |
Motorcycle:
| Pittsburg: | 0.0% (10) |
| California: | 0.2% (36,262) |
Bicycle:
| Pittsburg: | 0.4% (84) |
| California: | 0.8% (120,567) |
Walked:
| Pittsburg: | 1.5% (366) |
| California: | 2.9% (414,581) |
Other means:
| Pittsburg: | 1.2% (291) |
| California: | 0.8% (115,064) |
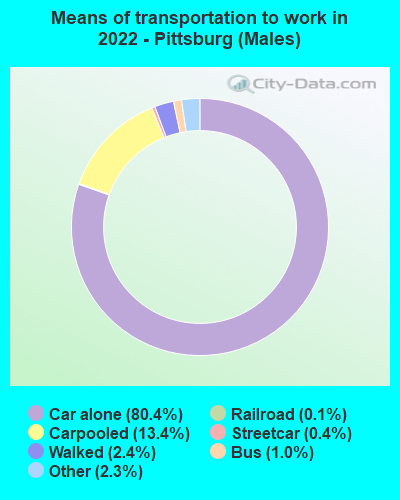

Drove car alone - Males:
| Pittsburg: | 80.4% (6,846) |
| California: | 80.0% (5,345,368) |
Carpooled - Males:
| Pittsburg: | 13.4% (1,144) |
| California: | 11.1% (878,699) |
Bus - Males:
| Pittsburg: | 1.0% (85) |
| California: | 2.0% (170,574) |
Subway or elevated rail - Males:
| Pittsburg: | 0.4% (35) |
| California: | 0.5% (40,665) |
Light rail, streetcar or trolley - Males:
| Pittsburg: | 0.1% (11) |
| California: | 0.1% (8,965) |
Walked - Males:
| Pittsburg: | 2.4% (204) |
| California: | 2.7% (218,374) |
Other means - Males:
| Pittsburg: | 2.3% (194) |
| California: | 2.1% (137,489) |
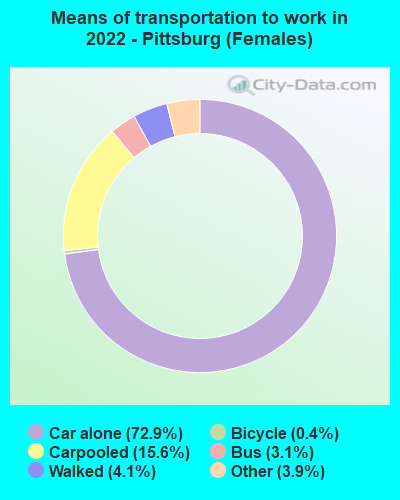

Drove car alone - Females:
| Pittsburg: | 72.9% (4,134) |
| California: | 77.9% (5,345,368) |
Carpooled - Females:
| Pittsburg: | 15.6% (887) |
| California: | 12.8% (878,699) |
Bus - Females:
| Pittsburg: | 3.1% (174) |
| California: | 2.5% (170,574) |
Bicycle - Females:
| Pittsburg: | 0.4% (25) |
| California: | 0.6% (39,197) |
Walked - Females:
| Pittsburg: | 4.1% (233) |
| California: | 3.2% (218,374) |
Other means - Females:
| Pittsburg: | 3.9% (222) |
| California: | 2.0% (137,489) |
Private vehicle occupancy
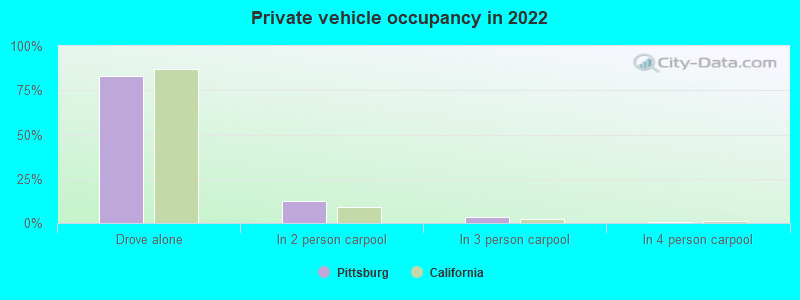
Drove alone:
| Pittsburg: | 82.8% (23,900) |
| California: | 86.9% (12,187,486) |
In 2 person carpool:
| Pittsburg: | 12.6% (3,640) |
| California: | 9.2% (1,295,561) |
In 3 person carpool:
| Pittsburg: | 3.2% (925) |
| California: | 2.2% (309,969) |
In 4 person carpool:
| Pittsburg: | 0.4% (121) |
| California: | 0.9% (126,987) |
In 5-6 person carpool:
| Pittsburg: | 0.2% (54) |
| California: | 0.5% (70,825) |
In 7+ person carpool:
| Pittsburg: | 0.7% (198) |
| California: | 0.2% (28,258) |
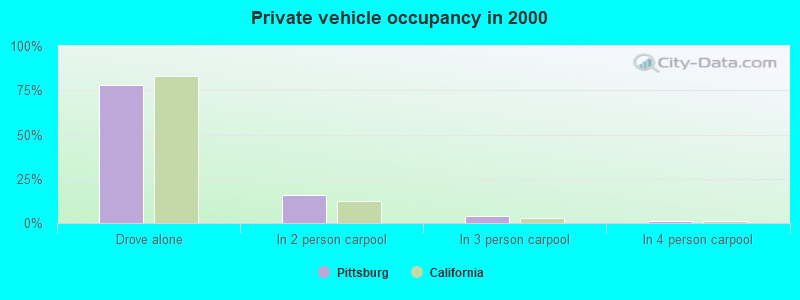
Drove alone:
| Pittsburg: | 78.1% (16,117) |
| California: | 83.2% (10,432,462) |
In 2 person carpool:
| Pittsburg: | 15.7% (3,249) |
| California: | 12.5% (1,564,905) |
In 3 person carpool:
| Pittsburg: | 3.9% (800) |
| California: | 2.6% (330,732) |
In 4 person carpool:
| Pittsburg: | 1.3% (270) |
| California: | 1.0% (119,364) |
In 5-6 person carpool:
| Pittsburg: | 0.7% (153) |
| California: | 0.5% (57,036) |
In 7+ person carpool:
| Pittsburg: | 0.2% (45) |
| California: | 0.3% (41,276) |
Class of workers
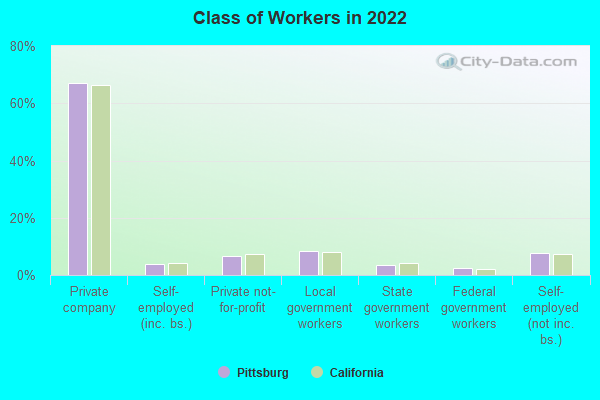
Employee of private company:
| Pittsburg: | 67.2% (24,992) |
| California: | 66.5% (12,596,030) |
Self-employed in own incorporated business:
| Pittsburg: | 3.9% (1,450) |
| California: | 4.1% (784,709) |
Private not-for-profit wage and salary workers:
| Pittsburg: | 6.7% (2,485) |
| California: | 7.5% (1,417,407) |
Local government workers:
| Pittsburg: | 8.4% (3,129) |
| California: | 8.2% (1,547,056) |
State government workers:
| Pittsburg: | 3.5% (1,300) |
| California: | 4.1% (780,915) |
Federal government workers:
| Pittsburg: | 2.5% (912) |
| California: | 2.0% (369,858) |
Self-employed workers in own not incorporated business:
| Pittsburg: | 7.7% (2,861) |
| California: | 7.4% (1,410,735) |
Unpaid family workers:
| Pittsburg: | 0.1% (51) |
| California: | 0.2% (36,267) |
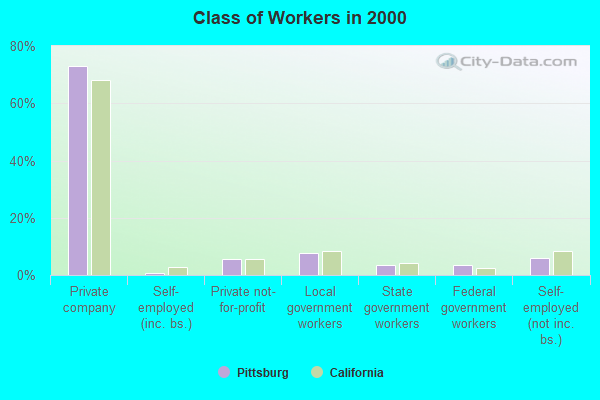
Employee of private company:
| Pittsburg: | 72.8% (17,970) |
| California: | 68.0% (10,009,465) |
Self-employed in own incorporated business:
| Pittsburg: | 0.8% (201) |
| California: | 2.7% (402,392) |
Private not-for-profit wage and salary workers:
| Pittsburg: | 5.4% (1,336) |
| California: | 5.7% (845,536) |
Local government workers:
| Pittsburg: | 7.8% (1,924) |
| California: | 8.3% (1,218,764) |
State government workers:
| Pittsburg: | 3.6% (889) |
| California: | 4.0% (594,953) |
Federal government workers:
| Pittsburg: | 3.4% (851) |
| California: | 2.3% (344,354) |
Self-employed workers in own not incorporated business:
| Pittsburg: | 5.9% (1,463) |
| California: | 8.5% (1,249,530) |
Unpaid family workers:
| Pittsburg: | 0.1% (37) |
| California: | 0.4% (53,934) |
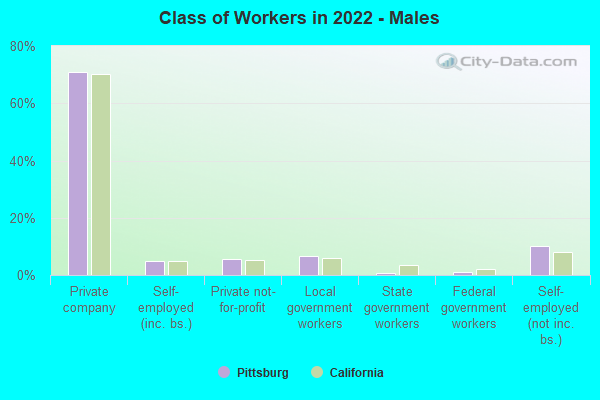
Employee of private company - Males:
| Pittsburg: | 70.9% (13,181) |
| California: | 70.3% (7,191,252) |
Self-employed in own incorporated business - Males:
| Pittsburg: | 4.8% (899) |
| California: | 4.9% (504,764) |
Private not-for-profit wage and salary workers - Males:
| Pittsburg: | 5.6% (1,049) |
| California: | 5.2% (529,122) |
Local government workers - Males:
| Pittsburg: | 6.7% (1,244) |
| California: | 6.0% (610,331) |
State government workers - Males:
| Pittsburg: | 0.8% (148) |
| California: | 3.4% (343,636) |
Federal government workers - Males:
| Pittsburg: | 1.2% (219) |
| California: | 2.1% (209,874) |
Self-employed workers in own not incorporated business - Males:
| Pittsburg: | 10.0% (1,861) |
| California: | 8.1% (824,359) |
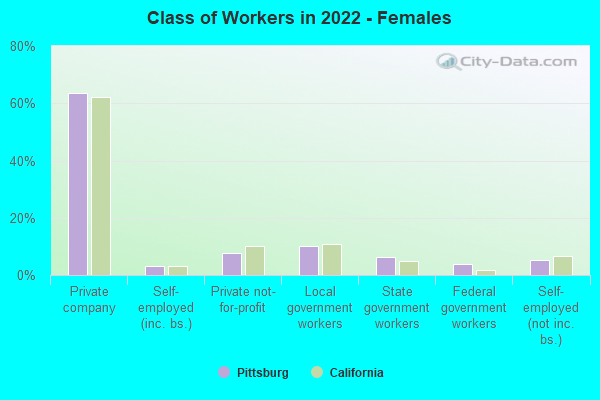
Employee of private company - Females:
| Pittsburg: | 63.6% (11,811) |
| California: | 62.0% (5,404,778) |
Self-employed in own incorporated business - Females:
| Pittsburg: | 3.0% (551) |
| California: | 3.2% (279,945) |
Private not-for-profit wage and salary workers - Females:
| Pittsburg: | 7.7% (1,436) |
| California: | 10.2% (888,285) |
Local government workers - Females:
| Pittsburg: | 10.1% (1,885) |
| California: | 10.8% (936,725) |
State government workers - Females:
| Pittsburg: | 6.2% (1,152) |
| California: | 5.0% (437,279) |
Federal government workers - Females:
| Pittsburg: | 3.7% (693) |
| California: | 1.8% (159,984) |
Self-employed workers in own not incorporated business - Females:
| Pittsburg: | 5.4% (1,000) |
| California: | 6.7% (586,376) |
Unpaid family workers - Females:
| Pittsburg: | 0.3% (51) |
| California: | 0.2% (18,345) |