Work and Jobs in Spring, Texas (TX) Detailed Stats
Occupations, Industries, Unemployment, Workers, Commute
Settings
X


Recent posts about work in Spring, Texas on our local forum with over 2,400,000 registered users:
 | Unemployment Claims by County as of 5/4/20 (14 replies) |
| Fort Worth area or San Antonio area for manufacturing jobs? (16 replies) |
| Relocating from Houston; work is near Galleria (DNT/Spring Valley Rd) (14 replies) |
| Any thoughts on Brittmore Crossing or Spring Brook Village? (3 replies) |
| West Houston Area (Spring Branch, Cinco Ranch) (26 replies) |
| Another Spring vs Katy Post (15 replies) |
Latest news about work in Spring, TX collected exclusively by city-data.com from local newspapers, TV, and radio stations
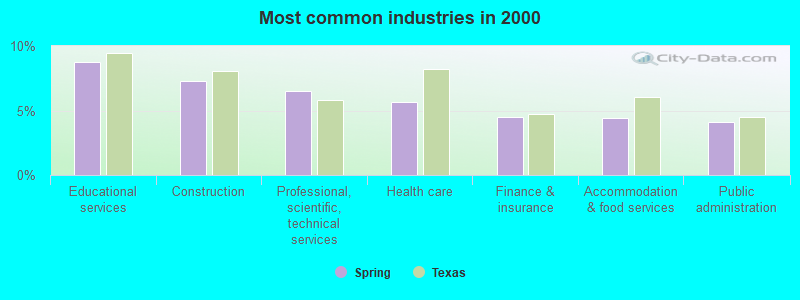
The most common industries in Spring are: Educational services (8.8% of civilian employees), Construction (7.3% of civilian employees), Professional, scientific, technical services (6.5% of civilian employees). 87.2% of workers work in Harris County and 8.6% of all workers work at home. 73.6% of workers are employees of private companies, which is 5.5% greater than the rate of 69.6% across the entire state of Texas.
Whole page based on the data from 2000 / 2022 when the population of Spring, Texas was 36,385 / 73,085
Whole page based on the data from 2000 / 2022 when the population of Spring, Texas was 36,385 / 73,085
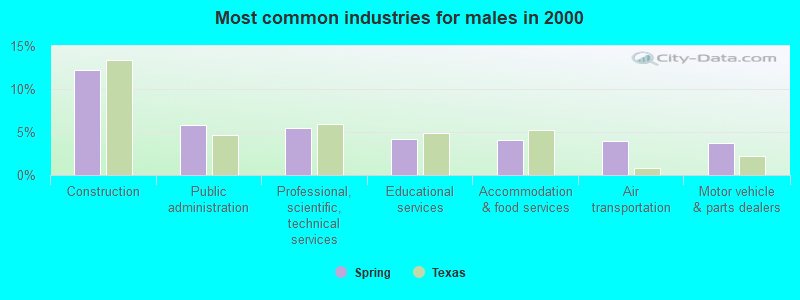
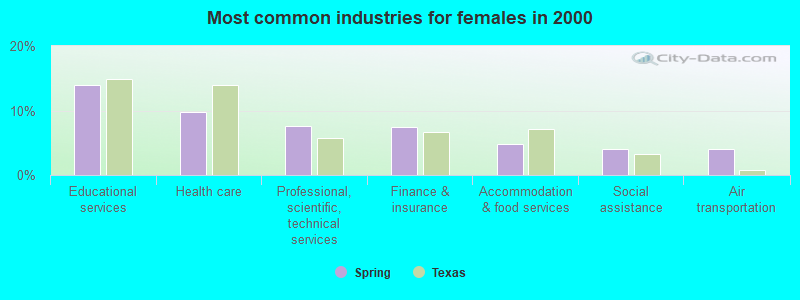
Most common industries
Most common industries | |||
|---|---|---|---|
Industry | All | Males | Females |
| Educational services | 8.8% (1,742) | 4.2% (442) | 13.9% (1,300) |
| Construction | 7.3% (1,448) | 12.2% (1,280) | 1.8% (168) |
| Professional, scientific, and technical services | 6.5% (1,289) | 5.5% (578) | 7.6% (711) |
| Health care | 5.7% (1,130) | 2.1% (219) | 9.8% (911) |
| Finance and insurance | 4.5% (886) | 1.9% (195) | 7.4% (691) |
| Accommodation and food services | 4.4% (874) | 4.1% (427) | 4.8% (447) |
| Public administration | 4.1% (818) | 5.9% (617) | 2.2% (201) |
| Air transportation | 3.9% (782) | 3.9% (412) | 4.0% (370) |
| Other transportation, and support activities, and couriers | 3.2% (636) | 3.5% (370) | 2.9% (266) |
| Administrative and support and waste management services | 2.7% (544) | 3.4% (363) | 1.9% (181) |
| Department and other general merchandise stores | 2.7% (533) | 1.9% (199) | 3.6% (334) |
| Motor vehicle and parts dealers | 2.5% (490) | 3.8% (397) | 1.0% (93) |
| Repair and maintenance | 2.3% (458) | 3.6% (375) | 0.9% (83) |
| Machinery | 2.2% (429) | 3.1% (327) | 1.1% (102) |
| Truck transportation | 2.1% (407) | 3.1% (323) | 0.9% (84) |
| Broadcasting and telecommunications | 2.0% (405) | 2.6% (277) | 1.4% (128) |
| Social assistance | 2.0% (397) | 0.2% (17) | 4.1% (380) |
| Real estate and rental and leasing | 2.0% (390) | 2.0% (209) | 1.9% (181) |
| Food and beverage stores | 1.8% (365) | 1.4% (150) | 2.3% (215) |
| Metal and metal products | 1.8% (362) | 3.0% (316) | 0.5% (46) |
| Religious, grantmaking, civic, professional, and similar organizations | 1.5% (307) | 1.0% (109) | 2.1% (198) |
| Personal and laundry services | 1.4% (286) | 0.4% (42) | 2.6% (244) |
| Mining, quarrying, and oil and gas extraction | 1.4% (270) | 1.5% (155) | 1.2% (115) |
| Arts, entertainment, and recreation | 1.3% (259) | 1.8% (189) | 0.8% (70) |
| Building material and garden equipment and supplies dealers | 1.2% (246) | 2.0% (212) | 0.4% (34) |
| Utilities | 1.2% (242) | 1.6% (169) | 0.8% (73) |
| Machinery, equipment, and supplies merchant wholesalers | 1.2% (235) | 1.1% (121) | 1.2% (114) |
| Computer and electronic products | 1.1% (228) | 1.3% (139) | 1.0% (89) |
| Groceries and related products merchant wholesalers | 1.1% (227) | 1.6% (173) | 0.6% (54) |
| Chemicals | 1.1% (212) | 1.4% (151) | 0.7% (61) |
| Pharmacies and drug stores | 0.9% (182) | 0.6% (61) | 1.3% (121) |
| Miscellaneous manufacturing | 0.9% (177) | 0.9% (97) | 0.9% (80) |
| Radio, TV, and computer stores | 0.8% (159) | 0.9% (90) | 0.7% (69) |
| Printing and related support activities | 0.7% (145) | 0.7% (71) | 0.8% (74) |
| Professional and commercial equipment and supplies merchant wholesalers | 0.7% (142) | 0.6% (62) | 0.9% (80) |
| Other direct selling establishments | 0.7% (139) | 0.7% (72) | 0.7% (67) |
| Used merchandise, gift, novelty, and souvenir, and other miscellaneous stores | 0.7% (137) | 0.3% (27) | 1.2% (110) |
| Sporting goods, camera, and hobby and toy stores | 0.7% (132) | 0.8% (83) | 0.5% (49) |
| Petroleum and petroleum products merchant wholesalers | 0.6% (116) | 0.6% (67) | 0.5% (49) |
| Clothing and accessories, including shoe, stores | 0.5% (97) | 0.3% (35) | 0.7% (62) |
| U. S. Postal service | 0.4% (83) | 0.4% (43) | 0.4% (40) |
| Electrical and electronic goods merchant wholesalers | 0.4% (80) | 0.6% (63) | 0.2% (17) |
| Publishing, and motion picture and sound recording industries | 0.4% (72) | 0.2% (21) | 0.5% (51) |
| Rail transportation | 0.3% (67) | 0.6% (62) | 0.1% (5) |
| Petroleum and coal products | 0.3% (67) | 0.5% (48) | 0.2% (19) |
| Miscellaneous durable goods merchant wholesalers | 0.3% (66) | 0.4% (38) | 0.3% (28) |
| Furniture and home furnishings, and household appliance stores | 0.3% (61) | 0.4% (37) | 0.3% (24) |
| Warehousing and storage | 0.3% (56) | 0.2% (24) | 0.3% (32) |
| Private households | 0.3% (54) | 0.1% (10) | 0.5% (44) |
| Data processing, libraries, and other information services | 0.3% (52) | 0.5% (52) | 0.0% (0) |
| Miscellaneous nondurable goods merchant wholesalers | 0.2% (49) | 0.3% (33) | 0.2% (16) |
| Water transportation | 0.2% (48) | 0.2% (18) | 0.3% (30) |
| Motor vehicles, parts and supplies merchant wholesalers | 0.2% (48) | 0.5% (48) | 0.0% (0) |
| Alcoholic beverages merchant wholesalers | 0.2% (43) | 0.3% (27) | 0.2% (16) |
| Food | 0.2% (42) | 0.3% (29) | 0.1% (13) |
| Hardware, plumbing and heating equipment, and supplies merchant wholesalers | 0.2% (42) | 0.3% (32) | 0.1% (10) |
| Electrical equipment, appliances, and components | 0.2% (42) | 0.4% (37) | 0.1% (5) |
| Drugs, sundries, and chemical and allied products merchant wholesalers | 0.2% (41) | 0.1% (12) | 0.3% (29) |
| Wood products | 0.2% (37) | 0.2% (26) | 0.1% (11) |
| Furniture and related product manufacturing | 0.2% (34) | 0.3% (34) | 0.0% (0) |
| Transportation equipment | 0.2% (33) | 0.2% (26) | 0.1% (7) |
| Plastics and rubber products | 0.2% (33) | 0.2% (18) | 0.2% (15) |
| Management of companies and enterprises | 0.2% (33) | 0.2% (20) | 0.1% (13) |
| Furniture and home furnishing merchant wholesalers | 0.2% (32) | 0.2% (23) | 0.1% (9) |
| Metals and minerals, except petroleum, merchant wholesalers | 0.2% (32) | 0.2% (20) | 0.1% (12) |
| Retail florists | 0.1% (29) | 0.0% (0) | 0.3% (29) |
| Vending machine operators | 0.1% (27) | 0.3% (27) | 0.0% (0) |
| Recyclable material merchant wholesalers | 0.1% (23) | 0.1% (15) | 0.1% (8) |
| Fuel dealers | 0.1% (19) | 0.1% (13) | 0.1% (6) |
| Nonmetallic mineral products | 0.1% (18) | 0.2% (18) | 0.0% (0) |
| Gasoline stations | 0.1% (17) | 0.2% (17) | 0.0% (0) |
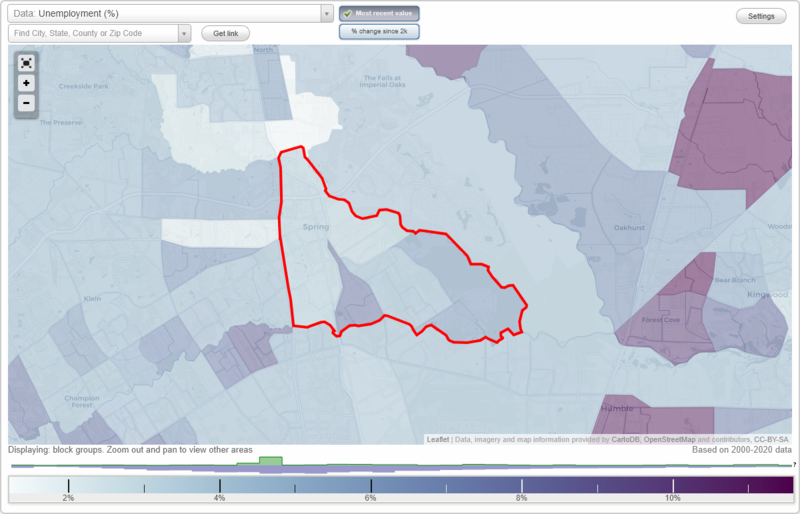
Unemployment in Spring
- Unemployment by race in 2022
- Unemployment rate for White non-Hispanic residents
- 5.9%Females
- Unemployment rate for Black residents
- 6.6%Males
- 3.2%Females
- Unemployment rate for Asian residents
- 4.0%Females
- Unemployment rate for other race residents
- 12.4%Females
- Unemployment rate for two or more race residents
- 3.6%Males
- 1.3%Females
- Unemployment rate for Hispanic or Latino residents
- 2.2%Males
- 5.1%Females
- Unemployment by race in 2000
- Unemployment rate for White non-Hispanic residents
- 2.6%Males
- 3.5%Females
- Unemployment rate for Black residents
- 12.9%Males
- 3.2%Females
- Unemployment rate for other race residents
- 7.3%Females
- Unemployment rate for two or more race residents
- 7.9%Males
- 10.9%Females
- Unemployment rate for Hispanic or Latino residents
- 4.2%Males
- 6.6%Females
Time leaving home to go to work
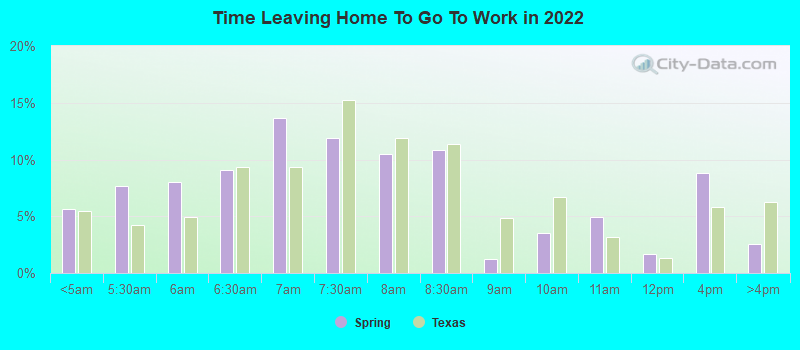
12:00 a.m. to 4:59 a.m.:
| Spring: | 5.7% (1,910) |
| Texas: | 5.5% (678,264) |
5:00 a.m. to 5:29 a.m.:
| Spring: | 7.7% (2,574) |
| Texas: | 4.3% (525,841) |
5:30 a.m. to 5:59 a.m.:
| Spring: | 8.0% (2,704) |
| Texas: | 4.9% (603,953) |
6:00 a.m. to 6:29 a.m.:
| Spring: | 9.0% (3,043) |
| Texas: | 9.4% (1,155,020) |
6:30 a.m. to 6:59 a.m.:
| Spring: | 13.7% (4,593) |
| Texas: | 9.3% (1,152,822) |
7:00 a.m. to 7:29 a.m.:
| Spring: | 11.9% (3,995) |
| Texas: | 15.3% (1,885,477) |
7:30 a.m. to 7:59 a.m.:
| Spring: | 10.5% (3,516) |
| Texas: | 11.9% (1,469,628) |
8:00 a.m. to 8:29 a.m.:
| Spring: | 10.9% (3,649) |
| Texas: | 11.3% (1,400,175) |
8:30 a.m. to 8:59 a.m.:
| Spring: | 1.2% (404) |
| Texas: | 4.9% (599,574) |
9:00 a.m. to 9:59 a.m.:
| Spring: | 3.5% (1,172) |
| Texas: | 6.7% (829,367) |
10:00 a.m. to 10:59 a.m.:
| Spring: | 5.0% (1,665) |
| Texas: | 3.2% (390,354) |
11:00 a.m. to 11:59 a.m.:
| Spring: | 1.7% (568) |
| Texas: | 1.3% (162,330) |
12:00 p.m. to 3:59 p.m.:
| Spring: | 8.8% (2,969) |
| Texas: | 5.8% (720,594) |
4:00 p.m. to 11:59 p.m.:
| Spring: | 2.6% (863) |
| Texas: | 6.3% (777,072) |
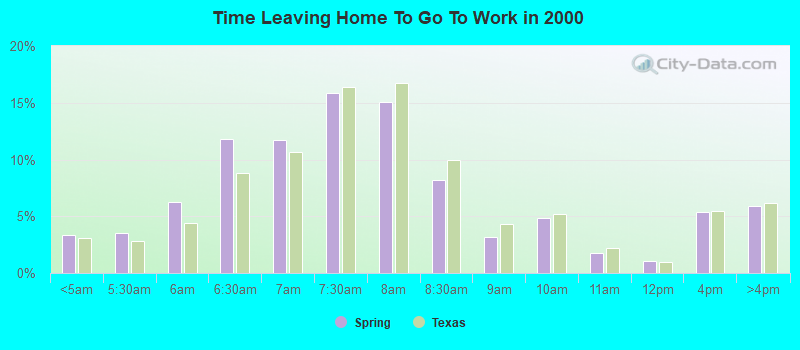
<5am:
| Spring: | 3.3% (650) |
| Texas: | 3.1% (281,361) |
5:30am:
| Spring: | 3.5% (680) |
| Texas: | 2.9% (262,060) |
6am:
| Spring: | 6.3% (1,218) |
| Texas: | 4.4% (403,423) |
6:30am:
| Spring: | 11.8% (2,293) |
| Texas: | 8.8% (808,876) |
7am:
| Spring: | 11.7% (2,276) |
| Texas: | 10.7% (976,557) |
7:30am:
| Spring: | 15.8% (3,081) |
| Texas: | 16.4% (1,500,904) |
8am:
| Spring: | 15.1% (2,929) |
| Texas: | 16.8% (1,536,308) |
8:30am:
| Spring: | 8.2% (1,592) |
| Texas: | 10.0% (913,601) |
9am:
| Spring: | 3.2% (624) |
| Texas: | 4.4% (398,656) |
10am:
| Spring: | 4.8% (942) |
| Texas: | 5.2% (472,592) |
11am:
| Spring: | 1.8% (351) |
| Texas: | 2.2% (197,844) |
12pm:
| Spring: | 1.0% (198) |
| Texas: | 0.9% (86,997) |
4pm:
| Spring: | 5.4% (1,049) |
| Texas: | 5.5% (503,565) |
>4pm:
| Spring: | 5.9% (1,150) |
| Texas: | 6.1% (563,107) |
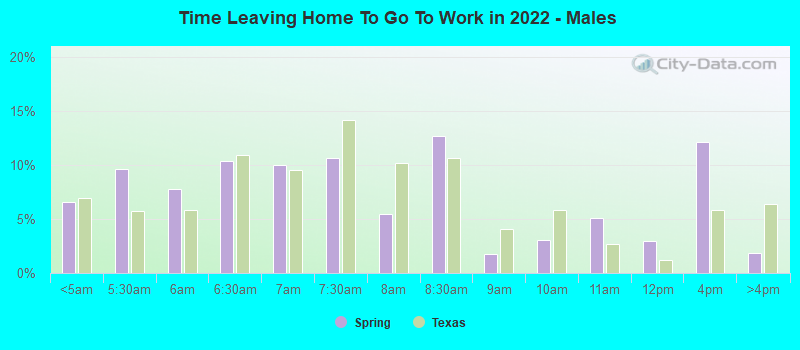
12:00 a.m. to 4:59 a.m. - Males:
| Spring: | 6.6% (1,257) |
| Texas: | 7.0% (477,284) |
5:00 a.m. to 5:29 a.m. - Males:
| Spring: | 9.6% (1,830) |
| Texas: | 5.8% (394,876) |
5:30 a.m. to 5:59 a.m. - Males:
| Spring: | 7.8% (1,484) |
| Texas: | 5.9% (402,788) |
6:00 a.m. to 6:29 a.m. - Males:
| Spring: | 10.4% (1,970) |
| Texas: | 10.9% (751,118) |
6:30 a.m. to 6:59 a.m. - Males:
| Spring: | 10.0% (1,906) |
| Texas: | 9.5% (652,306) |
7:00 a.m. to 7:29 a.m. - Males:
| Spring: | 10.6% (2,016) |
| Texas: | 14.1% (970,598) |
7:30 a.m. to 7:59 a.m. - Males:
| Spring: | 5.4% (1,036) |
| Texas: | 10.2% (696,429) |
8:00 a.m. to 8:29 a.m. - Males:
| Spring: | 12.6% (2,402) |
| Texas: | 10.6% (729,041) |
8:30 a.m. to 8:59 a.m. - Males:
| Spring: | 1.8% (335) |
| Texas: | 4.1% (281,762) |
9:00 a.m. to 9:59 a.m. - Males:
| Spring: | 3.1% (582) |
| Texas: | 5.8% (401,071) |
10:00 a.m. to 10:59 a.m. - Males:
| Spring: | 5.1% (964) |
| Texas: | 2.7% (186,469) |
11:00 a.m. to 11:59 a.m. - Males:
| Spring: | 3.0% (568) |
| Texas: | 1.2% (82,242) |
12:00 p.m. to 3:59 p.m. - Males:
| Spring: | 12.1% (2,309) |
| Texas: | 5.8% (397,795) |
4:00 p.m. to 11:59 p.m. - Males:
| Spring: | 1.9% (352) |
| Texas: | 6.4% (435,950) |
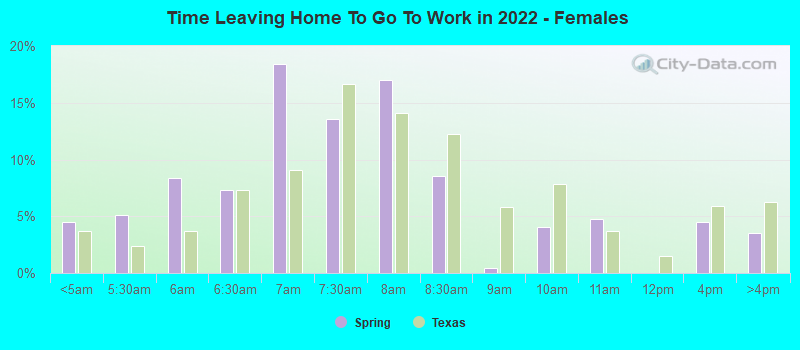
12:00 a.m. to 4:59 a.m. - Females:
| Spring: | 4.5% (653) |
| Texas: | 3.7% (200,980) |
5:00 a.m. to 5:29 a.m. - Females:
| Spring: | 5.1% (744) |
| Texas: | 2.4% (130,965) |
5:30 a.m. to 5:59 a.m. - Females:
| Spring: | 8.3% (1,220) |
| Texas: | 3.7% (201,165) |
6:00 a.m. to 6:29 a.m. - Females:
| Spring: | 7.3% (1,073) |
| Texas: | 7.4% (403,902) |
6:30 a.m. to 6:59 a.m. - Females:
| Spring: | 18.4% (2,687) |
| Texas: | 9.1% (500,516) |
7:00 a.m. to 7:29 a.m. - Females:
| Spring: | 13.5% (1,979) |
| Texas: | 16.7% (914,879) |
7:30 a.m. to 7:59 a.m. - Females:
| Spring: | 17.0% (2,480) |
| Texas: | 14.1% (773,199) |
8:00 a.m. to 8:29 a.m. - Females:
| Spring: | 8.5% (1,247) |
| Texas: | 12.2% (671,134) |
8:30 a.m. to 8:59 a.m. - Females:
| Spring: | 0.5% (69) |
| Texas: | 5.8% (317,812) |
9:00 a.m. to 9:59 a.m. - Females:
| Spring: | 4.0% (590) |
| Texas: | 7.8% (428,296) |
10:00 a.m. to 10:59 a.m. - Females:
| Spring: | 4.8% (701) |
| Texas: | 3.7% (203,885) |
12:00 p.m. to 3:59 p.m. - Females:
| Spring: | 4.5% (660) |
| Texas: | 5.9% (322,799) |
4:00 p.m. to 11:59 p.m. - Females:
| Spring: | 3.5% (511) |
| Texas: | 6.2% (341,122) |
Travel time to work
Percentage of workers working in this county: 87.2%
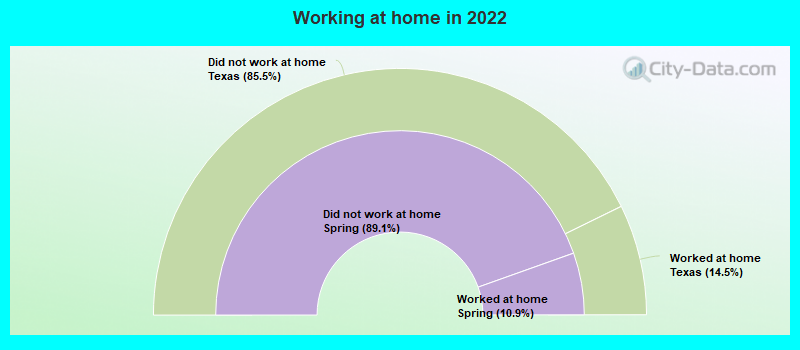
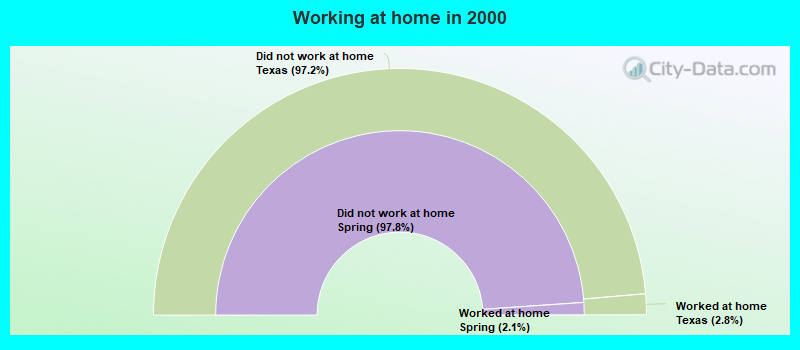
Number of people working at home: 2,853 (8.6% of all workers)
Daytime population change due to commuting: -11,969 (-32.9%)
Workers who live and work in this place: 2,200 (11.3%)
Number of people working at home: 2,853 (8.6% of all workers)
Daytime population change due to commuting: -11,969 (-32.9%)
Workers who live and work in this place: 2,200 (11.3%)
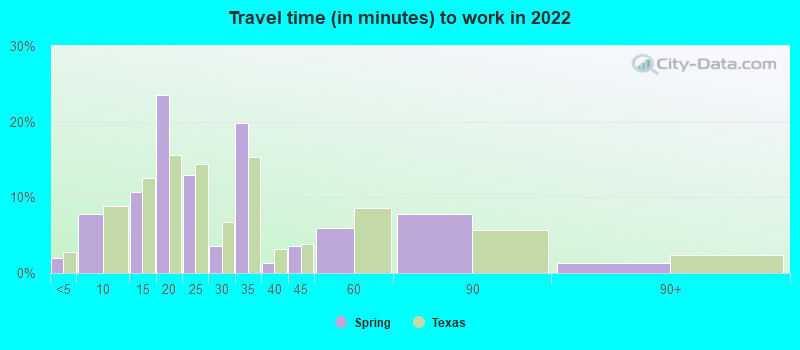
Less than 5 minutes:
| Spring: | 2.0% (341) |
| Texas: | 2.8% (350,462) |
5 to 9 minutes:
| Spring: | 7.7% (1,323) |
| Texas: | 8.8% (1,087,762) |
10 to 14 minutes:
| Spring: | 10.7% (1,823) |
| Texas: | 12.6% (1,550,271) |
15 to 19 minutes:
| Spring: | 23.6% (4,035) |
| Texas: | 15.6% (1,918,353) |
20 to 24 minutes:
| Spring: | 12.9% (2,206) |
| Texas: | 14.4% (1,772,079) |
25 to 29 minutes:
| Spring: | 3.6% (611) |
| Texas: | 6.7% (827,833) |
30 to 34 minutes:
| Spring: | 19.8% (3,387) |
| Texas: | 15.3% (1,887,878) |
35 to 39 minutes:
| Spring: | 1.3% (220) |
| Texas: | 3.2% (394,170) |
40 to 44 minutes:
| Spring: | 3.5% (605) |
| Texas: | 3.9% (476,118) |
45 to 59 minutes:
| Spring: | 5.9% (1,010) |
| Texas: | 8.6% (1,058,376) |
60 to 89 minutes:
| Spring: | 7.7% (1,325) |
| Texas: | 5.7% (706,002) |
90 or more minutes:
| Spring: | 1.3% (218) |
| Texas: | 2.4% (299,884) |
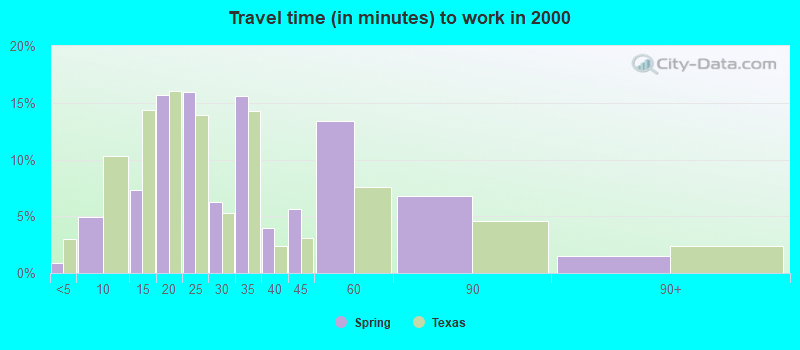
Less than 5 minutes:
| Spring: | 0.9% (169) |
| Texas: | 3.0% (277,642) |
5 to 9 minutes:
| Spring: | 5.0% (963) |
| Texas: | 10.3% (942,891) |
10 to 14 minutes:
| Spring: | 7.3% (1,424) |
| Texas: | 14.4% (1,317,555) |
15 to 19 minutes:
| Spring: | 15.7% (3,048) |
| Texas: | 16.0% (1,467,945) |
20 to 24 minutes:
| Spring: | 16.0% (3,103) |
| Texas: | 13.9% (1,276,781) |
25 to 29 minutes:
| Spring: | 6.3% (1,218) |
| Texas: | 5.3% (482,838) |
30 to 34 minutes:
| Spring: | 15.6% (3,029) |
| Texas: | 14.3% (1,309,699) |
35 to 39 minutes:
| Spring: | 3.9% (767) |
| Texas: | 2.4% (219,873) |
40 to 44 minutes:
| Spring: | 5.6% (1,092) |
| Texas: | 3.1% (280,916) |
45 to 59 minutes:
| Spring: | 13.4% (2,602) |
| Texas: | 7.6% (692,006) |
60 to 89 minutes:
| Spring: | 6.8% (1,328) |
| Texas: | 4.6% (418,905) |
90 or more minutes:
| Spring: | 1.5% (290) |
| Texas: | 2.4% (218,800) |
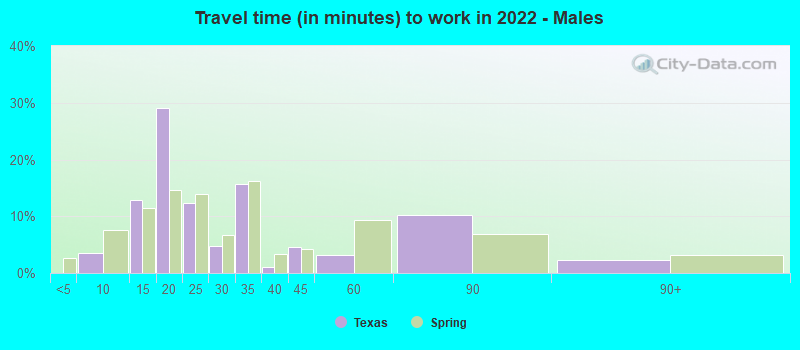
5 to 9 minutes - Males:
| Spring: | 3.6% (350) |
| Texas: | 7.6% (522,166) |
10 to 14 minutes - Males:
| Spring: | 12.9% (1,255) |
| Texas: | 11.5% (785,572) |
15 to 19 minutes - Males:
| Spring: | 29.1% (2,827) |
| Texas: | 14.6% (1,001,179) |
20 to 24 minutes - Males:
| Spring: | 12.4% (1,203) |
| Texas: | 13.9% (950,043) |
25 to 29 minutes - Males:
| Spring: | 4.8% (470) |
| Texas: | 6.7% (457,259) |
30 to 34 minutes - Males:
| Spring: | 15.7% (1,524) |
| Texas: | 16.2% (1,110,357) |
35 to 39 minutes - Males:
| Spring: | 1.1% (107) |
| Texas: | 3.3% (223,512) |
40 to 44 minutes - Males:
| Spring: | 4.6% (451) |
| Texas: | 4.2% (289,434) |
45 to 59 minutes - Males:
| Spring: | 3.2% (306) |
| Texas: | 9.3% (639,122) |
60 to 89 minutes - Males:
| Spring: | 10.3% (999) |
| Texas: | 6.8% (467,154) |
90 or more minutes - Males:
| Spring: | 2.2% (218) |
| Texas: | 3.1% (211,313) |
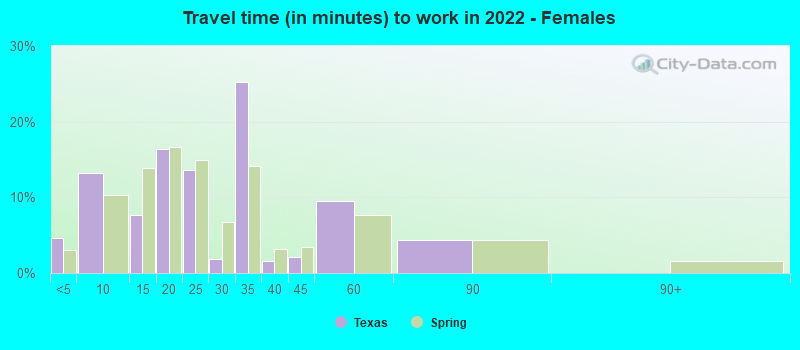
Less than 5 minutes - Females:
| Spring: | 4.6% (341) |
| Texas: | 3.1% (168,525) |
5 to 9 minutes - Females:
| Spring: | 13.2% (973) |
| Texas: | 10.3% (565,596) |
10 to 14 minutes - Females:
| Spring: | 7.7% (568) |
| Texas: | 13.9% (764,699) |
15 to 19 minutes - Females:
| Spring: | 16.3% (1,208) |
| Texas: | 16.7% (917,174) |
20 to 24 minutes - Females:
| Spring: | 13.6% (1,003) |
| Texas: | 15.0% (822,036) |
25 to 29 minutes - Females:
| Spring: | 1.9% (141) |
| Texas: | 6.7% (370,574) |
30 to 34 minutes - Females:
| Spring: | 25.2% (1,863) |
| Texas: | 14.2% (777,521) |
35 to 39 minutes - Females:
| Spring: | 1.5% (113) |
| Texas: | 3.1% (170,658) |
40 to 44 minutes - Females:
| Spring: | 2.1% (154) |
| Texas: | 3.4% (186,684) |
45 to 59 minutes - Females:
| Spring: | 9.5% (704) |
| Texas: | 7.6% (419,254) |
60 to 89 minutes - Females:
| Spring: | 4.4% (326) |
| Texas: | 4.4% (238,848) |
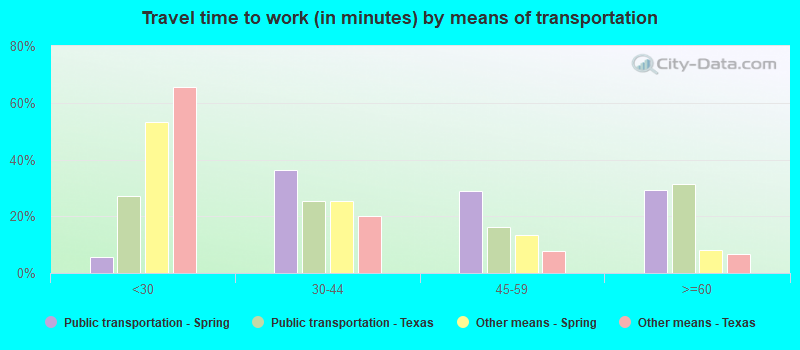
Means of transportation to work
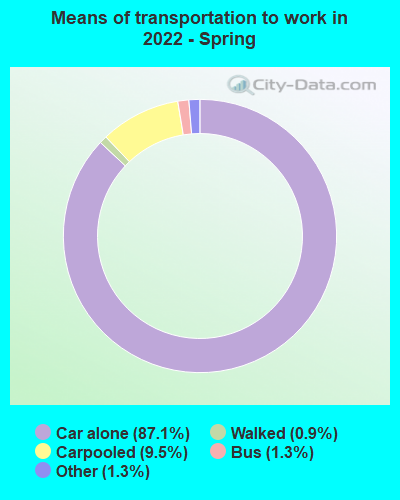

Drove car alone:
| Spring: | 87.1% (17,098) |
| Texas: | 83.3% (4,557,023) |
Carpooled:
| Spring: | 9.5% (1,858) |
| Texas: | 11.7% (674,818) |
Bus:
| Spring: | 1.3% (246) |
| Texas: | 0.9% (50,435) |
Walked:
| Spring: | 0.9% (174) |
| Texas: | 1.7% (99,911) |
Other means:
| Spring: | 1.3% (257) |
| Texas: | 2.0% (95,481) |


Drove car alone:
| Spring: | 84.2% (16,387) |
| Texas: | 77.7% (7,115,590) |
Carpooled:
| Spring: | 10.3% (2,006) |
| Texas: | 14.5% (1,326,012) |
Bus or trolley bus:
| Spring: | 2.5% (480) |
| Texas: | 1.7% (157,014) |
Motorcycle:
| Spring: | 0.1% (10) |
| Texas: | 0.1% (12,068) |
Walked:
| Spring: | 0.3% (61) |
| Texas: | 1.9% (173,670) |
Other means:
| Spring: | 0.5% (89) |
| Texas: | 0.9% (86,692) |
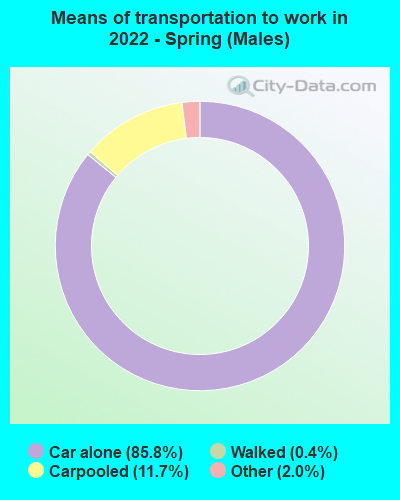

Drove car alone - Males:
| Spring: | 85.8% (8,709) |
| Texas: | 83.6% (4,557,023) |
Carpooled - Males:
| Spring: | 11.7% (1,192) |
| Texas: | 11.2% (674,818) |
Walked - Males:
| Spring: | 0.4% (42) |
| Texas: | 1.7% (99,911) |
Other means - Males:
| Spring: | 2.0% (207) |
| Texas: | 2.2% (95,481) |
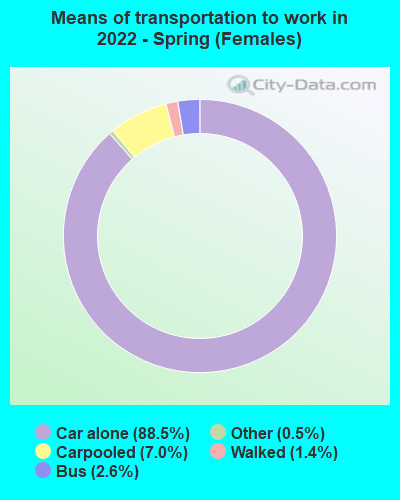

Drove car alone - Females:
| Spring: | 88.5% (8,397) |
| Texas: | 83.0% (4,557,023) |
Carpooled - Females:
| Spring: | 7.0% (665) |
| Texas: | 12.3% (674,818) |
Bus - Females:
| Spring: | 2.6% (248) |
| Texas: | 0.9% (50,435) |
Walked - Females:
| Spring: | 1.4% (132) |
| Texas: | 1.8% (99,911) |
Other means - Females:
| Spring: | 0.5% (49) |
| Texas: | 1.7% (95,481) |
Private vehicle occupancy
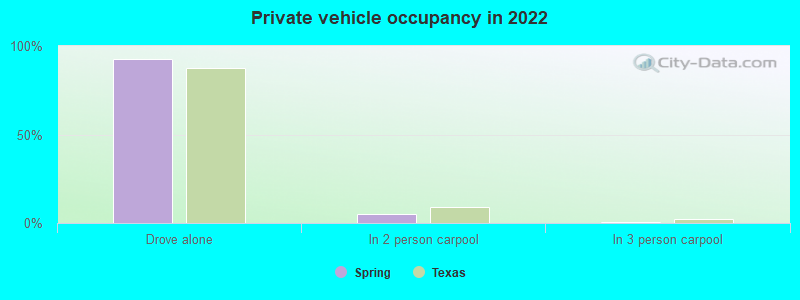
Drove alone:
| Spring: | 92.5% (26,200) |
| Texas: | 87.6% (10,283,021) |
In 2 person carpool:
| Spring: | 5.3% (1,500) |
| Texas: | 9.0% (1,052,595) |
In 3 person carpool:
| Spring: | 0.8% (226) |
| Texas: | 2.1% (244,139) |
In 4 person carpool:
| Spring: | 0.4% (107) |
| Texas: | 0.8% (92,732) |
In 5-6 person carpool:
| Spring: | 0.0% (12) |
| Texas: | 0.4% (44,947) |
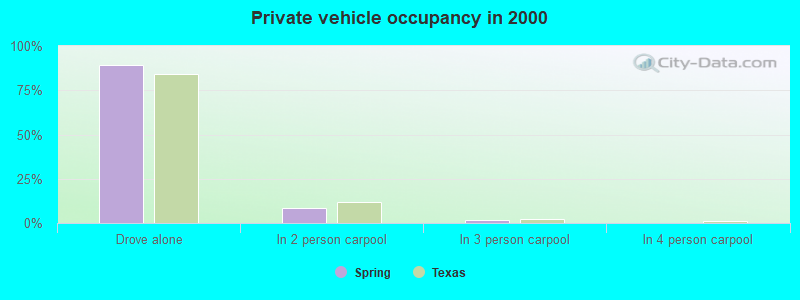
Drove alone:
| Spring: | 89.1% (16,387) |
| Texas: | 84.3% (7,115,590) |
In 2 person carpool:
| Spring: | 8.7% (1,592) |
| Texas: | 11.6% (982,994) |
In 3 person carpool:
| Spring: | 1.5% (278) |
| Texas: | 2.4% (201,602) |
In 4 person carpool:
| Spring: | 0.2% (37) |
| Texas: | 1.0% (83,518) |
In 5-6 person carpool:
| Spring: | 0.4% (71) |
| Texas: | 0.5% (40,662) |
In 7+ person carpool:
| Spring: | 0.2% (28) |
| Texas: | 0.2% (17,236) |
Class of workers
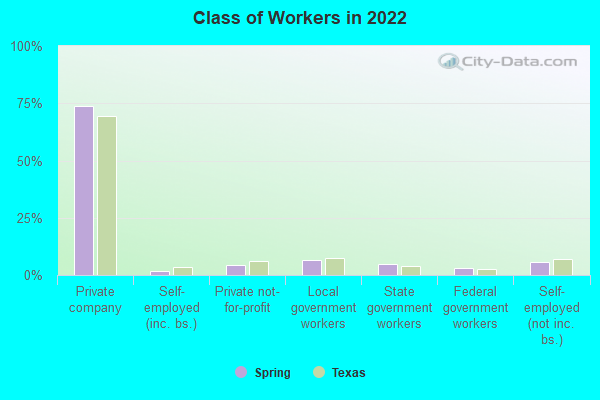
Employee of private company:
| Spring: | 73.6% (27,923) |
| Texas: | 69.6% (10,139,666) |
Self-employed in own incorporated business:
| Spring: | 1.9% (704) |
| Texas: | 3.5% (516,446) |
Private not-for-profit wage and salary workers:
| Spring: | 4.6% (1,727) |
| Texas: | 6.0% (870,454) |
Local government workers:
| Spring: | 6.6% (2,493) |
| Texas: | 7.6% (1,109,799) |
State government workers:
| Spring: | 5.0% (1,890) |
| Texas: | 3.8% (558,618) |
Federal government workers:
| Spring: | 3.0% (1,128) |
| Texas: | 2.5% (357,298) |
Self-employed workers in own not incorporated business:
| Spring: | 5.5% (2,076) |
| Texas: | 6.8% (998,270) |

Employee of private company:
| Spring: | 76.4% (15,157) |
| Texas: | 69.6% (6,425,274) |
Self-employed in own incorporated business:
| Spring: | 1.5% (297) |
| Texas: | 2.7% (250,864) |
Private not-for-profit wage and salary workers:
| Spring: | 4.4% (873) |
| Texas: | 5.7% (526,631) |
Local government workers:
| Spring: | 7.4% (1,464) |
| Texas: | 6.6% (608,479) |
State government workers:
| Spring: | 3.7% (730) |
| Texas: | 5.4% (501,082) |
Federal government workers:
| Spring: | 1.7% (346) |
| Texas: | 2.6% (237,177) |
Self-employed workers in own not incorporated business:
| Spring: | 4.8% (950) |
| Texas: | 7.1% (653,527) |
Unpaid family workers:
| Spring: | 0.2% (31) |
| Texas: | 0.3% (31,338) |
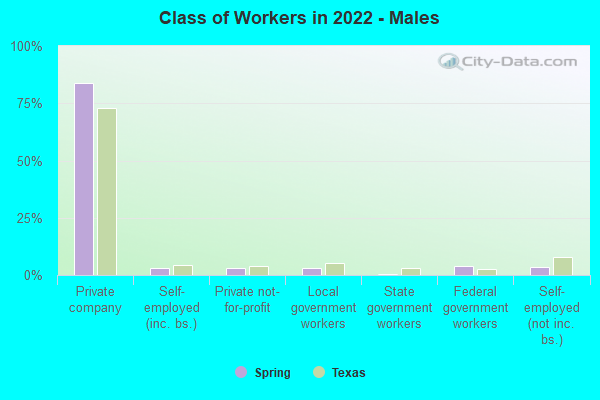
Employee of private company - Males:
| Spring: | 83.7% (17,657) |
| Texas: | 73.1% (5,788,450) |
Self-employed in own incorporated business - Males:
| Spring: | 2.9% (613) |
| Texas: | 4.2% (332,655) |
Private not-for-profit wage and salary workers - Males:
| Spring: | 2.9% (613) |
| Texas: | 4.1% (323,476) |
Local government workers - Males:
| Spring: | 3.0% (636) |
| Texas: | 5.1% (405,467) |
State government workers - Males:
| Spring: | 0.2% (47) |
| Texas: | 3.0% (236,706) |
Federal government workers - Males:
| Spring: | 4.0% (837) |
| Texas: | 2.7% (211,629) |
Self-employed workers in own not incorporated business - Males:
| Spring: | 3.3% (705) |
| Texas: | 7.7% (609,246) |
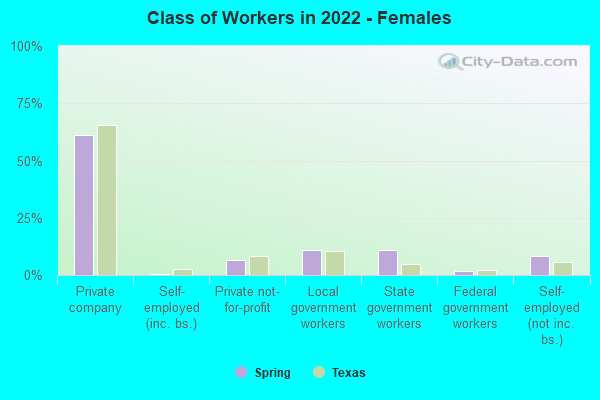
Employee of private company - Females:
| Spring: | 61.0% (10,266) |
| Texas: | 65.4% (4,351,216) |
Self-employed in own incorporated business - Females:
| Spring: | 0.5% (91) |
| Texas: | 2.8% (183,791) |
Private not-for-profit wage and salary workers - Females:
| Spring: | 6.6% (1,114) |
| Texas: | 8.2% (546,978) |
Local government workers - Females:
| Spring: | 11.0% (1,857) |
| Texas: | 10.6% (704,332) |
State government workers - Females:
| Spring: | 10.9% (1,843) |
| Texas: | 4.8% (321,912) |
Federal government workers - Females:
| Spring: | 1.7% (291) |
| Texas: | 2.2% (145,669) |
Self-employed workers in own not incorporated business - Females:
| Spring: | 8.1% (1,371) |
| Texas: | 5.8% (389,024) |