Latest news about work in Stonewall, TX collected exclusively by city-data.com from local newspapers, TV, and radio stations
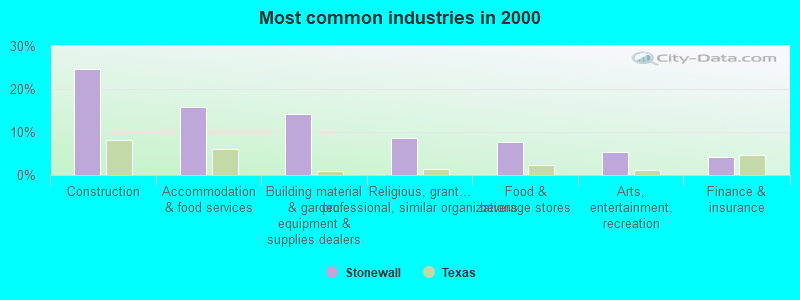
The most common industries in Stonewall are: Construction (24.8% of civilian employees), Accommodation & food services (15.7% of civilian employees), Building material & garden equipment & supplies dealers (14.3% of civilian employees). 80.4% of workers work in Gillespie County and 8.0% of all workers work at home. 50.5% of workers are employees of private companies, which is 37.7% less than the rate of 69.6% across the entire state of Texas.
Whole page based on the data from 2000 / 2022 when the population of Stonewall, Texas was 469 / 574
Most common industries
Most common industries
Industry
All
Males
Females
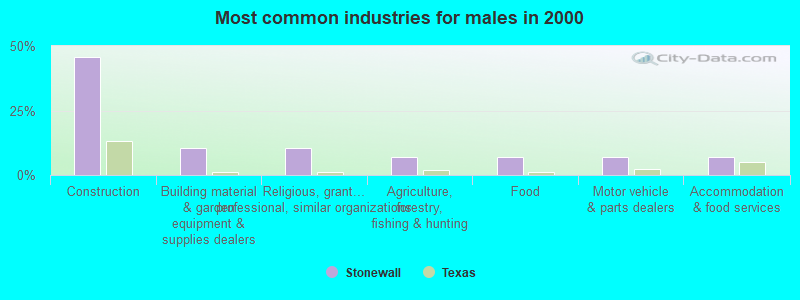
Construction
24.8% (52)
45.6% (52)
0.0% (0)
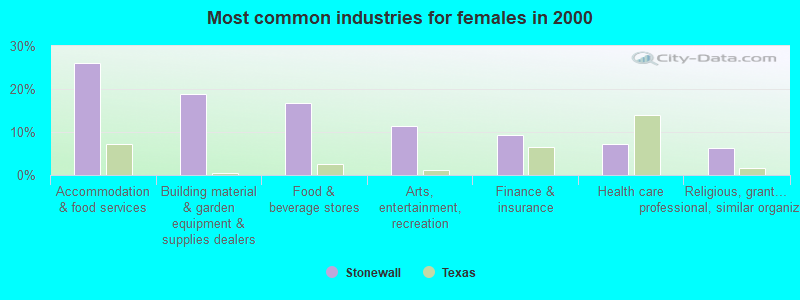
Accommodation and food services
15.7% (33)
7.0% (8)
26.0% (25)
Building material and garden equipment and supplies dealers
14.3% (30)
10.5% (12)
18.8% (18)
Religious, grantmaking, civic, professional, and similar organizations
8.6% (18)
10.5% (12)
6.2% (6)
Food and beverage stores
7.6% (16)
0.0% (0)
16.7% (16)
Arts, entertainment, and recreation
5.2% (11)
0.0% (0)
11.5% (11)
Finance and insurance
4.3% (9)
0.0% (0)
9.4% (9)
Agriculture, forestry, fishing and hunting
3.8% (8)
7.0% (8)
0.0% (0)
Food
3.8% (8)
7.0% (8)
0.0% (0)
Motor vehicle and parts dealers
3.8% (8)
7.0% (8)
0.0% (0)
Health care
3.3% (7)
0.0% (0)
7.3% (7)
Repair and maintenance
2.9% (6)
5.3% (6)
0.0% (0)
Broadcasting and telecommunications
1.9% (4)
0.0% (0)
4.2% (4)
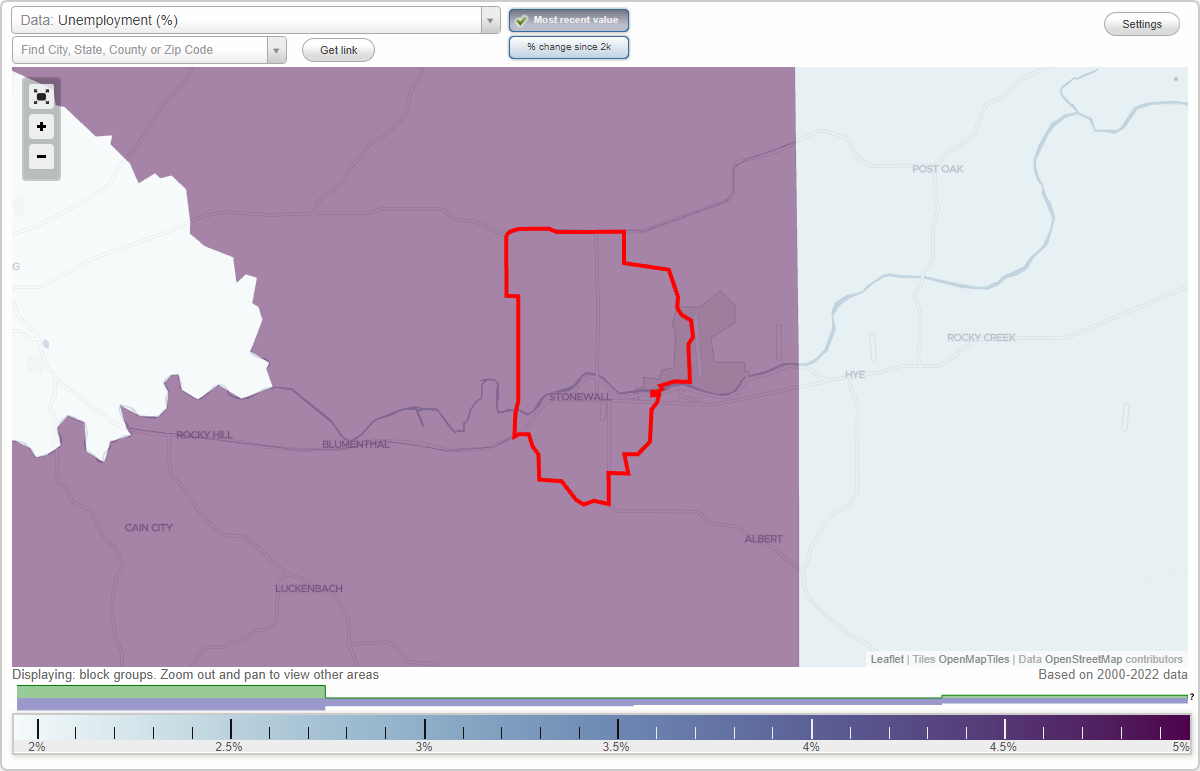
Unemployment in Stonewall
Unemployment by race in 2000
Unemployment rate for White non-Hispanic residents
9.5%Males
Unemployment rate for other race residents
63.6%Males
Unemployment rate for Hispanic or Latino residents
32.6%Males
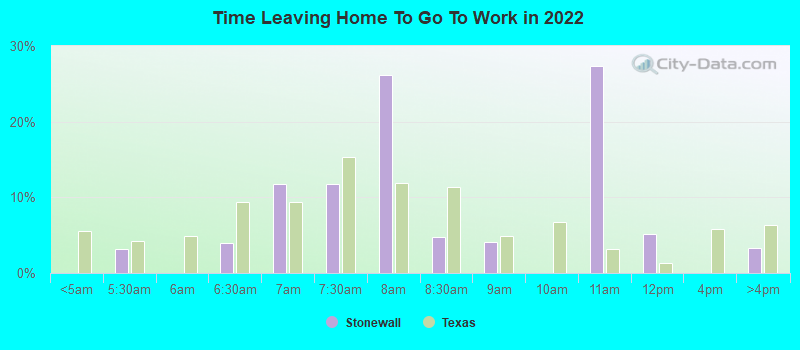
Time leaving home to go to work
5:00 a.m. to 5:29 a.m.:
Stonewall:
3.2% (9)
Texas:
4.3% (525,841)
6:00 a.m. to 6:29 a.m.:
Stonewall:
3.9% (11)
Texas:
9.4% (1,155,020)
6:30 a.m. to 6:59 a.m.:
Stonewall:
11.8% (33)
Texas:
9.3% (1,152,822)
7:00 a.m. to 7:29 a.m.:
Stonewall:
11.7% (33)
Texas:
15.3% (1,885,477)
7:30 a.m. to 7:59 a.m.:
Stonewall:
26.2% (73)
Texas:
11.9% (1,469,628)
8:00 a.m. to 8:29 a.m.:
Stonewall:
4.8% (13)
Texas:
11.3% (1,400,175)
8:30 a.m. to 8:59 a.m.:
Stonewall:
4.0% (11)
Texas:
4.9% (599,574)
10:00 a.m. to 10:59 a.m.:
Stonewall:
27.4% (76)
Texas:
3.2% (390,354)
11:00 a.m. to 11:59 a.m.:
Stonewall:
5.1% (14)
Texas:
1.3% (162,330)
4:00 p.m. to 11:59 p.m.:
Stonewall:
3.3% (9)
Texas:
6.3% (777,072)
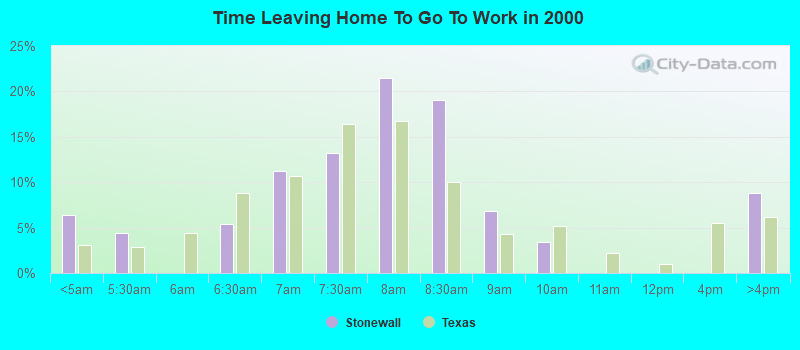
<5am:
Stonewall:
6.3% (13)
Texas:
3.1% (281,361)
5:30am:
Stonewall:
4.4% (9)
Texas:
2.9% (262,060)
6:30am:
Stonewall:
5.4% (11)
Texas:
8.8% (808,876)
7am:
Stonewall:
11.2% (23)
Texas:
10.7% (976,557)
7:30am:
Stonewall:
13.2% (27)
Texas:
16.4% (1,500,904)
8am:
Stonewall:
21.5% (44)
Texas:
16.8% (1,536,308)
8:30am:
Stonewall:
19.0% (39)
Texas:
10.0% (913,601)
9am:
Stonewall:
6.8% (14)
Texas:
4.4% (398,656)
10am:
Stonewall:
3.4% (7)
Texas:
5.2% (472,592)
>4pm:
Stonewall:
8.8% (18)
Texas:
6.1% (563,107)
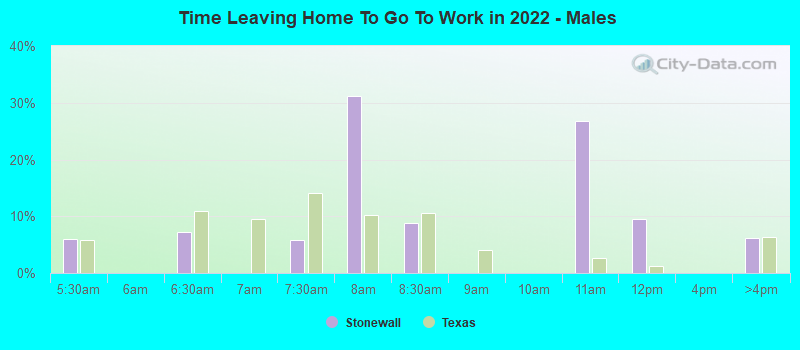
5:00 a.m. to 5:29 a.m. - Males:
Stonewall:
6.0% (9)
Texas:
5.8% (394,876)
6:00 a.m. to 6:29 a.m. - Males:
Stonewall:
7.2% (11)
Texas:
10.9% (751,118)
7:00 a.m. to 7:29 a.m. - Males:
Stonewall:
5.8% (9)
Texas:
14.1% (970,598)
7:30 a.m. to 7:59 a.m. - Males:
Stonewall:
31.2% (47)
Texas:
10.2% (696,429)
8:00 a.m. to 8:29 a.m. - Males:
Stonewall:
8.8% (13)
Texas:
10.6% (729,041)
10:00 a.m. to 10:59 a.m. - Males:
Stonewall:
26.7% (40)
Texas:
2.7% (186,469)
11:00 a.m. to 11:59 a.m. - Males:
Stonewall:
9.4% (14)
Texas:
1.2% (82,242)
4:00 p.m. to 11:59 p.m. - Males:
Stonewall:
6.2% (9)
Texas:
6.4% (435,950)
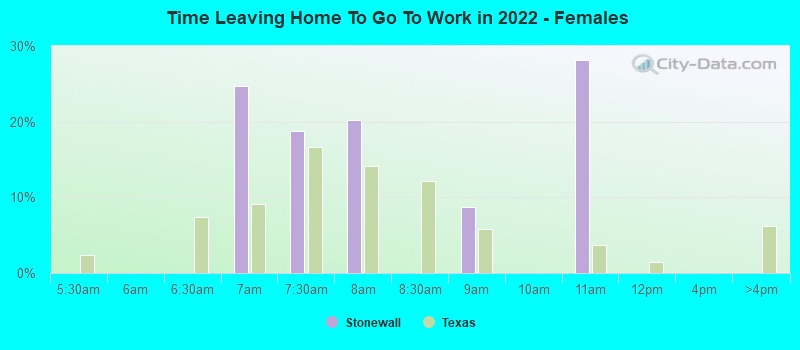
6:30 a.m. to 6:59 a.m. - Females:
Stonewall:
24.8% (32)
Texas:
9.1% (500,516)
7:00 a.m. to 7:29 a.m. - Females:
Stonewall:
18.8% (24)
Texas:
16.7% (914,879)
7:30 a.m. to 7:59 a.m. - Females:
Stonewall:
20.2% (26)
Texas:
14.1% (773,199)
8:30 a.m. to 8:59 a.m. - Females:
Stonewall:
8.7% (11)
Texas:
5.8% (317,812)
10:00 a.m. to 10:59 a.m. - Females:
Stonewall:
28.1% (36)
Texas:
3.7% (203,885)
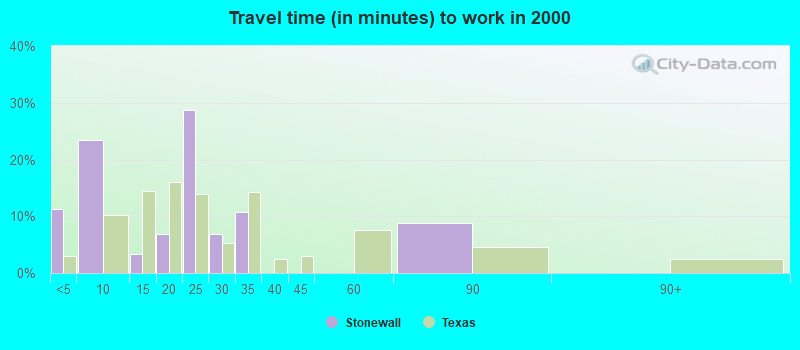
Travel time to work
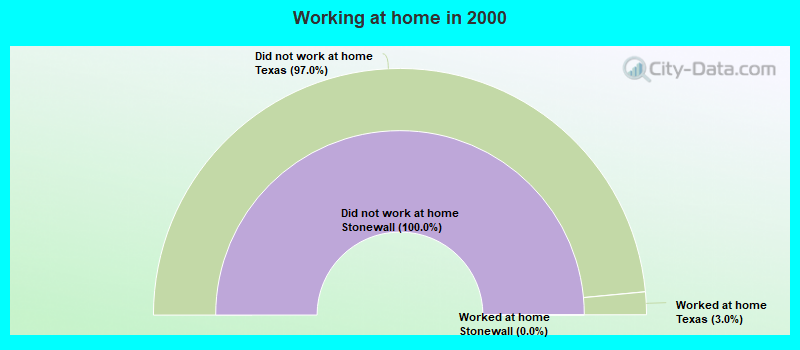
Percentage of workers working in this county: 80.4% Number of people working at home: 25 (8.0% of all workers)
Less than 5 minutes:
Stonewall:
11.2% (23)
Texas:
3.0% (277,642)
5 to 9 minutes:
Stonewall:
23.4% (48)
Texas:
10.3% (942,891)
10 to 14 minutes:
Stonewall:
3.4% (7)
Texas:
14.4% (1,317,555)
15 to 19 minutes:
Stonewall:
6.8% (14)
Texas:
16.0% (1,467,945)
20 to 24 minutes:
Stonewall:
28.8% (59)
Texas:
13.9% (1,276,781)
25 to 29 minutes:
Stonewall:
6.8% (14)
Texas:
5.3% (482,838)
30 to 34 minutes:
Stonewall:
10.7% (22)
Texas:
14.3% (1,309,699)
60 to 89 minutes:
Stonewall:
8.8% (18)
Texas:
4.6% (418,905)
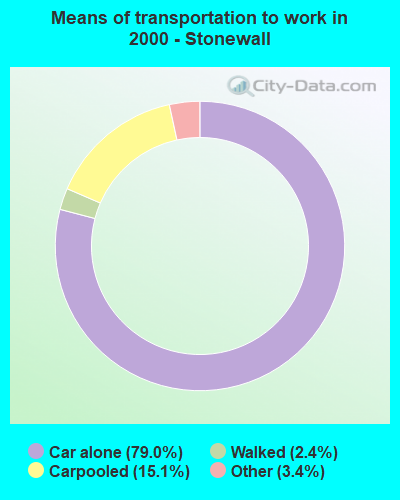
Means of transportation to work
Drove car alone:
Stonewall:
79.0% (162)
Texas:
77.7% (7,115,590)
Carpooled:
Stonewall:
15.1% (31)
Texas:
14.5% (1,326,012)
Walked:
Stonewall:
2.4% (5)
Texas:
1.9% (173,670)
Other means:
Stonewall:
3.4% (7)
Texas:
0.9% (86,692)
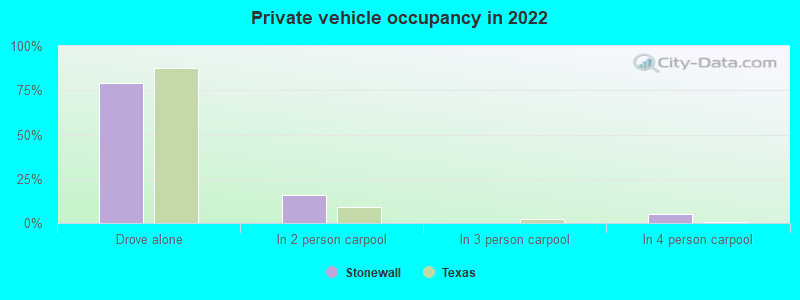
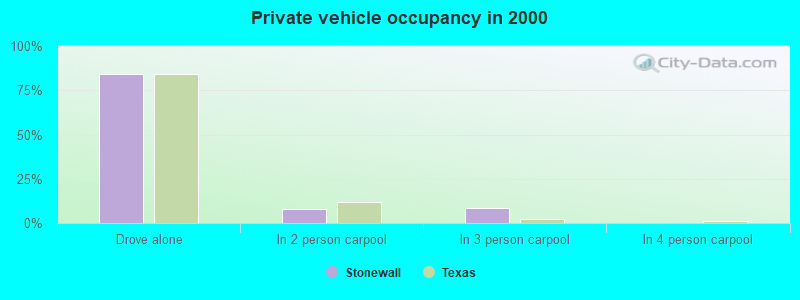
Private vehicle occupancy
Drove alone:
Stonewall:
79.1% (210)
Texas:
87.6% (10,283,021)
In 2 person carpool:
Stonewall:
15.9% (42)
Texas:
9.0% (1,052,595)
In 4 person carpool:
Stonewall:
5.0% (13)
Texas:
0.8% (92,732)
Drove alone:
Stonewall:
83.9% (162)
Texas:
84.3% (7,115,590)
In 2 person carpool:
Stonewall:
7.8% (15)
Texas:
11.6% (982,994)
In 3 person carpool:
Stonewall:
8.3% (16)
Texas:
2.4% (201,602)
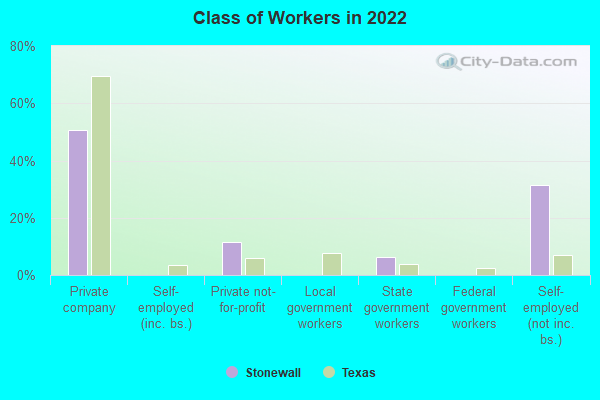
Class of workers
Employee of private company:
Stonewall:
50.5% (159)
Texas:
69.6% (10,139,666)
Private not-for-profit wage and salary workers:
Stonewall:
11.6% (37)
Texas:
6.0% (870,454)
State government workers:
Stonewall:
6.3% (20)
Texas:
3.8% (558,618)
Self-employed workers in own not incorporated business:
Stonewall:
31.6% (100)
Texas:
6.8% (998,270)
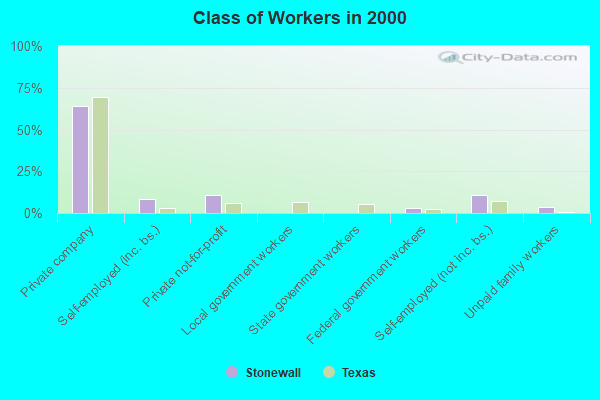
Employee of private company:
Stonewall:
63.8% (134)
Texas:
69.6% (6,425,274)
Self-employed in own incorporated business:
Stonewall:
8.1% (17)
Texas:
2.7% (250,864)
Private not-for-profit wage and salary workers:
Stonewall:
11.0% (23)
Texas:
5.7% (526,631)
Federal government workers:
Stonewall:
2.9% (6)
Texas:
2.6% (237,177)
Self-employed workers in own not incorporated business:
Stonewall:
11.0% (23)
Texas:
7.1% (653,527)
Unpaid family workers:
Stonewall:
3.3% (7)
Texas:
0.3% (31,338)
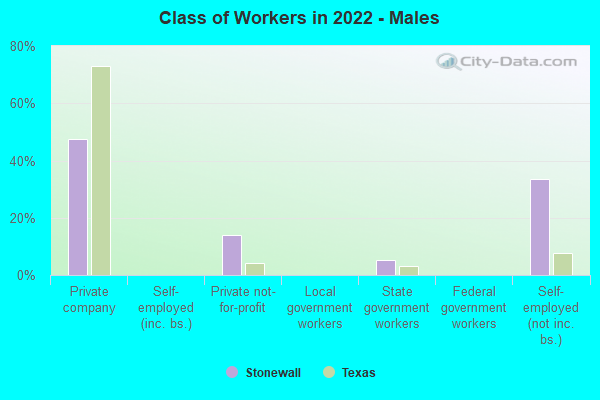
Employee of private company - Males:
Stonewall:
47.4% (86)
Texas:
73.1% (5,788,450)
Private not-for-profit wage and salary workers - Males:
Stonewall:
13.9% (25)
Texas:
4.1% (323,476)
State government workers - Males:
Stonewall:
5.2% (9)
Texas:
3.0% (236,706)
Self-employed workers in own not incorporated business - Males:
Stonewall:
33.5% (61)
Texas:
7.7% (609,246)
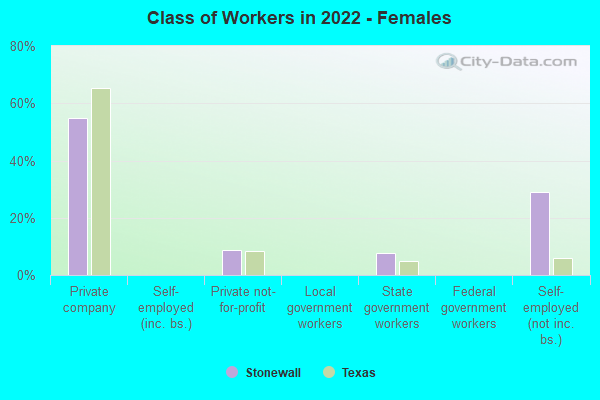
Employee of private company - Females:
Stonewall:
54.7% (73)
Texas:
65.4% (4,351,216)
Private not-for-profit wage and salary workers - Females:
Stonewall:
8.6% (12)
Texas:
8.2% (546,978)
State government workers - Females:
Stonewall:
7.8% (10)
Texas:
4.8% (321,912)
Self-employed workers in own not incorporated business - Females:
Stonewall:
28.9% (39)
Texas:
5.8% (389,024)
Discuss Stonewall, Texas (TX) on our hugely popular Texas forum.