Work and Jobs in Sun Valley, Nevada (NV) Detailed Stats
Occupations, Industries, Unemployment, Workers, Commute
Settings
X


Recent posts about work in Sun Valley, Nevada on our local forum with over 2,400,000 registered users:
 | Breakdown of areas in Reno (45 replies) |
| Wages Vs Cost of Living (34 replies) |
| Job transfer to moving to Reno/Carson City area (16 replies) |
| Airplane noise and places in S. Reno that get the worst of it? (9 replies) |
| Questions about northern Reno (5 replies) |
| Possible Job in Reno, Where to Live?? (28 replies) |
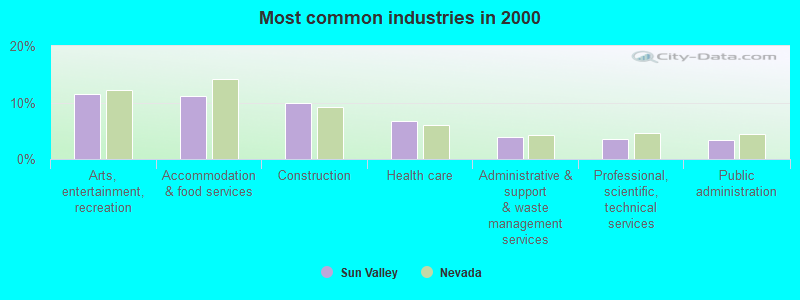
The most common industries in Sun Valley are: Arts, entertainment, recreation (11.5% of civilian employees), Accommodation & food services (11.1% of civilian employees), Construction (10.0% of civilian employees). 97.4% of workers work in Washoe County and 2.3% of all workers work at home. 83.3% of workers are employees of private companies, which is 10.7% greater than the rate of 74.4% across the entire state of Nevada.
Whole page based on the data from 2000 / 2022 when the population of Sun Valley, Nevada was 19,461 / 23,246
Whole page based on the data from 2000 / 2022 when the population of Sun Valley, Nevada was 19,461 / 23,246
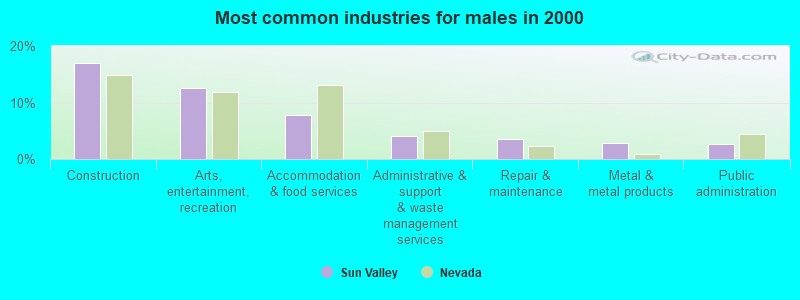
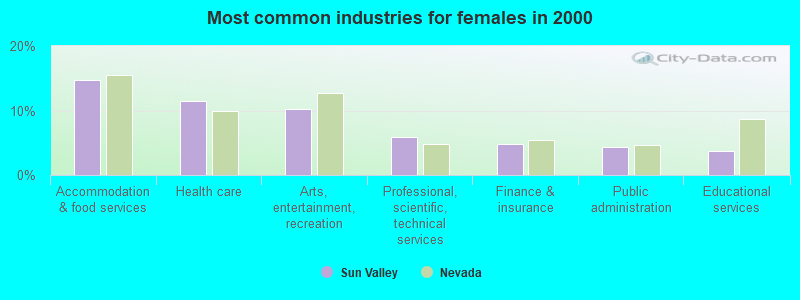
Most common industries
Most common industries | |||
|---|---|---|---|
Industry | All | Males | Females |
| Arts, entertainment, and recreation | 11.5% (1,044) | 12.6% (604) | 10.3% (440) |
| Accommodation and food services | 11.1% (1,006) | 7.8% (374) | 14.8% (632) |
| Construction | 10.0% (905) | 17.0% (818) | 2.0% (87) |
| Health care | 6.7% (607) | 2.5% (118) | 11.4% (489) |
| Administrative and support and waste management services | 3.8% (349) | 4.1% (198) | 3.5% (151) |
| Professional, scientific, and technical services | 3.6% (324) | 1.5% (73) | 5.9% (251) |
| Public administration | 3.4% (313) | 2.7% (128) | 4.3% (185) |
| Food and beverage stores | 2.8% (255) | 2.2% (106) | 3.5% (149) |
| Finance and insurance | 2.7% (249) | 0.9% (42) | 4.8% (207) |
| Department and other general merchandise stores | 2.7% (249) | 2.5% (122) | 3.0% (127) |
| Educational services | 2.7% (241) | 1.8% (85) | 3.7% (156) |
| Repair and maintenance | 2.1% (190) | 3.6% (173) | 0.4% (17) |
| Real estate and rental and leasing | 2.0% (184) | 2.4% (116) | 1.6% (68) |
| Building material and garden equipment and supplies dealers | 1.7% (154) | 2.4% (115) | 0.9% (39) |
| Miscellaneous manufacturing | 1.7% (151) | 1.6% (77) | 1.7% (74) |
| Warehousing and storage | 1.6% (142) | 2.6% (127) | 0.4% (15) |
| Used merchandise, gift, novelty, and souvenir, and other miscellaneous stores | 1.5% (134) | 1.2% (56) | 1.8% (78) |
| Metal and metal products | 1.5% (134) | 2.8% (134) | 0.0% (0) |
| Broadcasting and telecommunications | 1.4% (128) | 1.0% (47) | 1.9% (81) |
| Truck transportation | 1.3% (120) | 2.2% (107) | 0.3% (13) |
| Personal and laundry services | 1.2% (109) | 0.5% (22) | 2.0% (87) |
| Motor vehicle and parts dealers | 1.2% (108) | 1.2% (56) | 1.2% (52) |
| Other transportation, and support activities, and couriers | 1.2% (107) | 1.6% (77) | 0.7% (30) |
| Computer and electronic products | 1.1% (101) | 1.0% (47) | 1.3% (54) |
| Social assistance | 1.1% (97) | 0.0% (0) | 2.3% (97) |
| U. S. Postal service | 1.0% (92) | 1.2% (57) | 0.8% (35) |
| Air transportation | 0.9% (86) | 0.3% (16) | 1.6% (70) |
| Motor vehicles, parts and supplies merchant wholesalers | 0.9% (80) | 1.5% (73) | 0.2% (7) |
| Printing and related support activities | 0.9% (80) | 0.9% (42) | 0.9% (38) |
| Religious, grantmaking, civic, professional, and similar organizations | 0.8% (76) | 0.9% (44) | 0.7% (32) |
| Machinery, equipment, and supplies merchant wholesalers | 0.8% (74) | 0.7% (34) | 0.9% (40) |
| Plastics and rubber products | 0.8% (71) | 1.2% (60) | 0.3% (11) |
| Miscellaneous nondurable goods merchant wholesalers | 0.8% (71) | 0.3% (16) | 1.3% (55) |
| Furniture and home furnishings, and household appliance stores | 0.7% (64) | 1.3% (64) | 0.0% (0) |
| Other direct selling establishments | 0.7% (61) | 0.7% (34) | 0.6% (27) |
| Electrical and electronic goods merchant wholesalers | 0.6% (57) | 0.4% (18) | 0.9% (39) |
| Publishing, and motion picture and sound recording industries | 0.6% (56) | 0.5% (25) | 0.7% (31) |
| Utilities | 0.6% (54) | 0.9% (43) | 0.3% (11) |
| Pharmacies and drug stores | 0.6% (50) | 0.2% (9) | 1.0% (41) |
| Alcoholic beverages merchant wholesalers | 0.4% (40) | 0.7% (34) | 0.1% (6) |
| Food | 0.4% (38) | 0.7% (32) | 0.1% (6) |
| Agriculture, forestry, fishing and hunting | 0.4% (38) | 0.8% (38) | 0.0% (0) |
| Clothing and accessories, including shoe, stores | 0.4% (37) | 0.2% (12) | 0.6% (25) |
| Machinery | 0.4% (37) | 0.6% (29) | 0.2% (8) |
| Groceries and related products merchant wholesalers | 0.4% (36) | 0.7% (36) | 0.0% (0) |
| Professional and commercial equipment and supplies merchant wholesalers | 0.4% (36) | 0.4% (20) | 0.4% (16) |
| Music stores | 0.4% (34) | 0.4% (18) | 0.4% (16) |
| Paper | 0.3% (31) | 0.2% (8) | 0.5% (23) |
| Gasoline stations | 0.3% (30) | 0.5% (26) | 0.1% (4) |
| Nonmetallic mineral products | 0.3% (27) | 0.6% (27) | 0.0% (0) |
| Radio, TV, and computer stores | 0.3% (24) | 0.0% (0) | 0.6% (24) |
| Furniture and related product manufacturing | 0.3% (24) | 0.5% (24) | 0.0% (0) |
| Private households | 0.2% (22) | 0.0% (0) | 0.5% (22) |
| Hardware, plumbing and heating equipment, and supplies merchant wholesalers | 0.2% (21) | 0.4% (21) | 0.0% (0) |
| Health and personal care, except drug, stores | 0.2% (18) | 0.2% (10) | 0.2% (8) |
| Electronic shopping and mail-order houses | 0.2% (18) | 0.4% (18) | 0.0% (0) |
| Book stores and news dealers | 0.2% (18) | 0.0% (0) | 0.4% (18) |
| Wood products | 0.2% (16) | 0.3% (16) | 0.0% (0) |
| Lumber and other construction materials merchant wholesalers | 0.2% (15) | 0.3% (15) | 0.0% (0) |
| Apparel, fabrics, and notions merchant wholesalers | 0.2% (14) | 0.1% (6) | 0.2% (8) |
| Jewelry, luggage, and leather goods stores | 0.1% (13) | 0.0% (0) | 0.3% (13) |
| Chemicals | 0.1% (12) | 0.1% (4) | 0.2% (8) |
| Drugs, sundries, and chemical and allied products merchant wholesalers | 0.1% (12) | 0.2% (12) | 0.0% (0) |
| Mining, quarrying, and oil and gas extraction | 0.1% (11) | 0.2% (11) | 0.0% (0) |
| Textile mills and textile products | 0.1% (11) | 0.0% (0) | 0.3% (11) |
| Petroleum and petroleum products merchant wholesalers | 0.1% (11) | 0.2% (11) | 0.0% (0) |
| Sporting goods, camera, and hobby and toy stores | 0.1% (10) | 0.0% (0) | 0.2% (10) |
| Vending machine operators | 0.1% (10) | 0.2% (10) | 0.0% (0) |
| Office supplies and stationery stores | 0.1% (10) | 0.0% (0) | 0.2% (10) |
| Recyclable material merchant wholesalers | 0.1% (9) | 0.2% (9) | 0.0% (0) |
| Transportation equipment | 0.1% (5) | 0.1% (5) | 0.0% (0) |
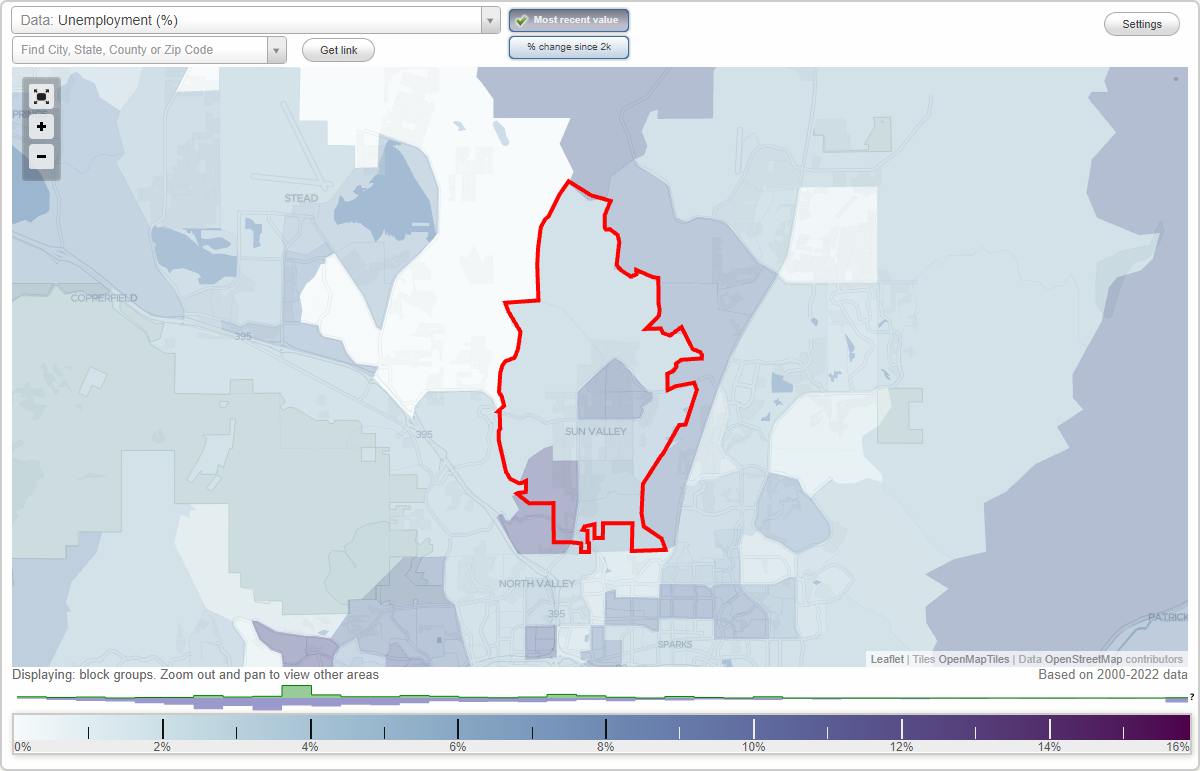
Unemployment in Sun Valley
- Unemployment by race in 2022
- Unemployment rate for White non-Hispanic residents
- 3.8%Males
- 5.0%Females
- Unemployment rate for other race residents
- 1.9%Males
- 10.2%Females
- Unemployment rate for two or more race residents
- 3.6%Males
- 6.1%Females
- Unemployment rate for Hispanic or Latino residents
- 3.5%Males
- 6.4%Females
- Unemployment by race in 2000
- Unemployment rate for White non-Hispanic residents
- 8.2%Males
- 5.4%Females
- Unemployment rate for Black residents
- 8.0%Males
- 15.8%Females
- Unemployment rate for American Indian and Alaska Native residents
- 9.6%Females
- Unemployment rate for other race residents
- 11.2%Females
- Unemployment rate for two or more race residents
- 2.9%Females
- Unemployment rate for Hispanic or Latino residents
- 3.6%Males
- 10.4%Females
Time leaving home to go to work
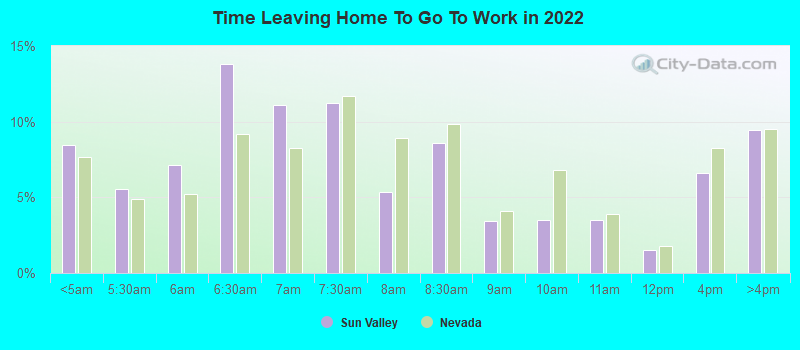
12:00 a.m. to 4:59 a.m.:
| Sun Valley: | 8.4% (850) |
| Nevada: | 7.7% (101,751) |
5:00 a.m. to 5:29 a.m.:
| Sun Valley: | 5.5% (556) |
| Nevada: | 4.9% (64,586) |
5:30 a.m. to 5:59 a.m.:
| Sun Valley: | 7.1% (716) |
| Nevada: | 5.2% (68,969) |
6:00 a.m. to 6:29 a.m.:
| Sun Valley: | 13.8% (1,390) |
| Nevada: | 9.2% (121,574) |
6:30 a.m. to 6:59 a.m.:
| Sun Valley: | 11.1% (1,118) |
| Nevada: | 8.2% (109,074) |
7:00 a.m. to 7:29 a.m.:
| Sun Valley: | 11.3% (1,134) |
| Nevada: | 11.7% (154,960) |
7:30 a.m. to 7:59 a.m.:
| Sun Valley: | 5.3% (536) |
| Nevada: | 8.9% (118,057) |
8:00 a.m. to 8:29 a.m.:
| Sun Valley: | 8.6% (867) |
| Nevada: | 9.8% (130,198) |
8:30 a.m. to 8:59 a.m.:
| Sun Valley: | 3.4% (346) |
| Nevada: | 4.1% (53,952) |
9:00 a.m. to 9:59 a.m.:
| Sun Valley: | 3.5% (351) |
| Nevada: | 6.8% (89,991) |
10:00 a.m. to 10:59 a.m.:
| Sun Valley: | 3.5% (350) |
| Nevada: | 3.9% (51,627) |
11:00 a.m. to 11:59 a.m.:
| Sun Valley: | 1.5% (151) |
| Nevada: | 1.8% (23,343) |
12:00 p.m. to 3:59 p.m.:
| Sun Valley: | 6.6% (666) |
| Nevada: | 8.2% (109,040) |
4:00 p.m. to 11:59 p.m.:
| Sun Valley: | 9.5% (952) |
| Nevada: | 9.5% (125,734) |
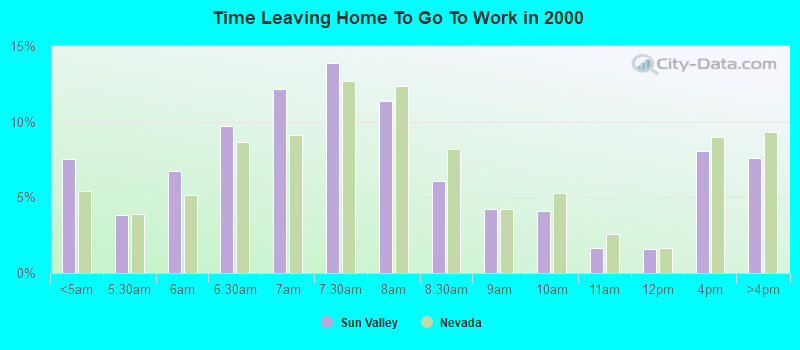
<5am:
| Sun Valley: | 7.5% (679) |
| Nevada: | 5.4% (49,950) |
5:30am:
| Sun Valley: | 3.8% (343) |
| Nevada: | 3.9% (35,924) |
6am:
| Sun Valley: | 6.7% (606) |
| Nevada: | 5.1% (47,324) |
6:30am:
| Sun Valley: | 9.7% (874) |
| Nevada: | 8.6% (79,614) |
7am:
| Sun Valley: | 12.2% (1,096) |
| Nevada: | 9.1% (84,251) |
7:30am:
| Sun Valley: | 13.9% (1,247) |
| Nevada: | 12.7% (117,088) |
8am:
| Sun Valley: | 11.3% (1,020) |
| Nevada: | 12.3% (113,773) |
8:30am:
| Sun Valley: | 6.1% (549) |
| Nevada: | 8.2% (75,666) |
9am:
| Sun Valley: | 4.2% (379) |
| Nevada: | 4.2% (38,916) |
10am:
| Sun Valley: | 4.1% (369) |
| Nevada: | 5.3% (48,591) |
11am:
| Sun Valley: | 1.6% (148) |
| Nevada: | 2.6% (23,932) |
12pm:
| Sun Valley: | 1.6% (142) |
| Nevada: | 1.6% (14,997) |
4pm:
| Sun Valley: | 8.0% (723) |
| Nevada: | 9.0% (83,088) |
>4pm:
| Sun Valley: | 7.6% (682) |
| Nevada: | 9.3% (86,164) |
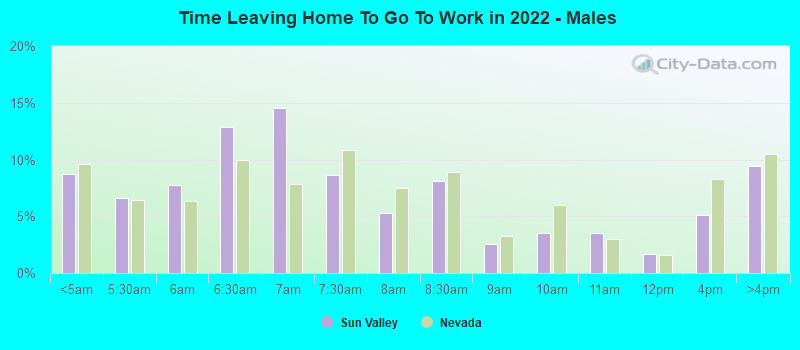
12:00 a.m. to 4:59 a.m. - Males:
| Sun Valley: | 8.7% (503) |
| Nevada: | 9.6% (70,047) |
5:00 a.m. to 5:29 a.m. - Males:
| Sun Valley: | 6.6% (380) |
| Nevada: | 6.5% (47,152) |
5:30 a.m. to 5:59 a.m. - Males:
| Sun Valley: | 7.7% (445) |
| Nevada: | 6.4% (46,554) |
6:00 a.m. to 6:29 a.m. - Males:
| Sun Valley: | 12.9% (743) |
| Nevada: | 10.0% (72,955) |
6:30 a.m. to 6:59 a.m. - Males:
| Sun Valley: | 14.5% (837) |
| Nevada: | 7.8% (57,078) |
7:00 a.m. to 7:29 a.m. - Males:
| Sun Valley: | 8.7% (499) |
| Nevada: | 10.8% (78,787) |
7:30 a.m. to 7:59 a.m. - Males:
| Sun Valley: | 5.3% (303) |
| Nevada: | 7.5% (54,841) |
8:00 a.m. to 8:29 a.m. - Males:
| Sun Valley: | 8.1% (464) |
| Nevada: | 8.9% (64,716) |
8:30 a.m. to 8:59 a.m. - Males:
| Sun Valley: | 2.6% (150) |
| Nevada: | 3.2% (23,638) |
9:00 a.m. to 9:59 a.m. - Males:
| Sun Valley: | 3.5% (202) |
| Nevada: | 6.0% (43,555) |
10:00 a.m. to 10:59 a.m. - Males:
| Sun Valley: | 3.5% (203) |
| Nevada: | 3.0% (21,591) |
11:00 a.m. to 11:59 a.m. - Males:
| Sun Valley: | 1.7% (98) |
| Nevada: | 1.6% (11,711) |
12:00 p.m. to 3:59 p.m. - Males:
| Sun Valley: | 5.1% (292) |
| Nevada: | 8.3% (60,650) |
4:00 p.m. to 11:59 p.m. - Males:
| Sun Valley: | 9.4% (544) |
| Nevada: | 10.5% (76,664) |
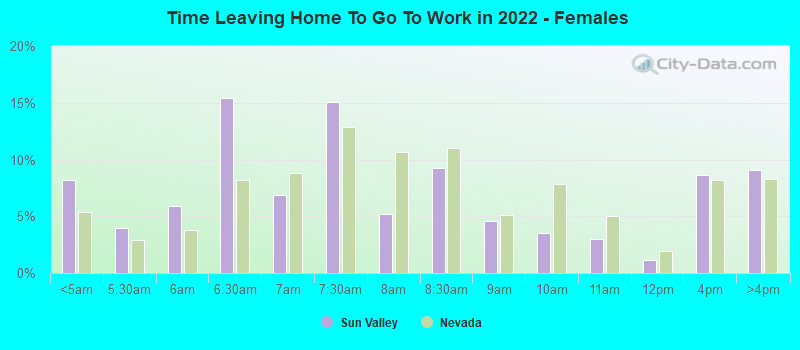
12:00 a.m. to 4:59 a.m. - Females:
| Sun Valley: | 8.2% (351) |
| Nevada: | 5.3% (31,704) |
5:00 a.m. to 5:29 a.m. - Females:
| Sun Valley: | 4.0% (172) |
| Nevada: | 2.9% (17,434) |
5:30 a.m. to 5:59 a.m. - Females:
| Sun Valley: | 5.9% (255) |
| Nevada: | 3.8% (22,415) |
6:00 a.m. to 6:29 a.m. - Females:
| Sun Valley: | 15.5% (665) |
| Nevada: | 8.2% (48,619) |
6:30 a.m. to 6:59 a.m. - Females:
| Sun Valley: | 6.9% (298) |
| Nevada: | 8.8% (51,996) |
7:00 a.m. to 7:29 a.m. - Females:
| Sun Valley: | 15.0% (647) |
| Nevada: | 12.8% (76,173) |
7:30 a.m. to 7:59 a.m. - Females:
| Sun Valley: | 5.2% (225) |
| Nevada: | 10.7% (63,216) |
8:00 a.m. to 8:29 a.m. - Females:
| Sun Valley: | 9.2% (398) |
| Nevada: | 11.0% (65,482) |
8:30 a.m. to 8:59 a.m. - Females:
| Sun Valley: | 4.6% (196) |
| Nevada: | 5.1% (30,314) |
9:00 a.m. to 9:59 a.m. - Females:
| Sun Valley: | 3.5% (153) |
| Nevada: | 7.8% (46,436) |
10:00 a.m. to 10:59 a.m. - Females:
| Sun Valley: | 3.0% (128) |
| Nevada: | 5.1% (30,036) |
11:00 a.m. to 11:59 a.m. - Females:
| Sun Valley: | 1.2% (50) |
| Nevada: | 2.0% (11,632) |
12:00 p.m. to 3:59 p.m. - Females:
| Sun Valley: | 8.7% (373) |
| Nevada: | 8.2% (48,390) |
4:00 p.m. to 11:59 p.m. - Females:
| Sun Valley: | 9.0% (389) |
| Nevada: | 8.3% (49,070) |
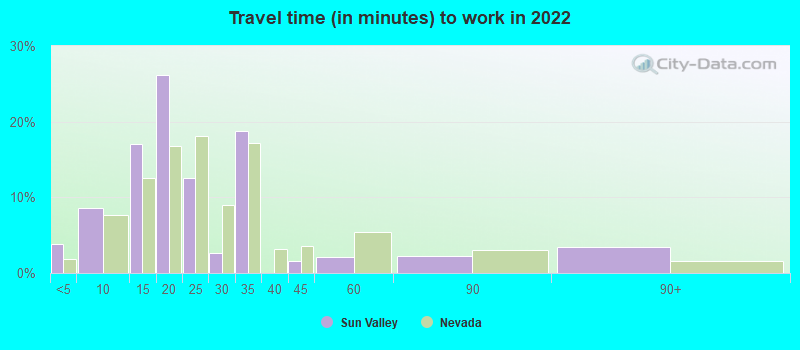
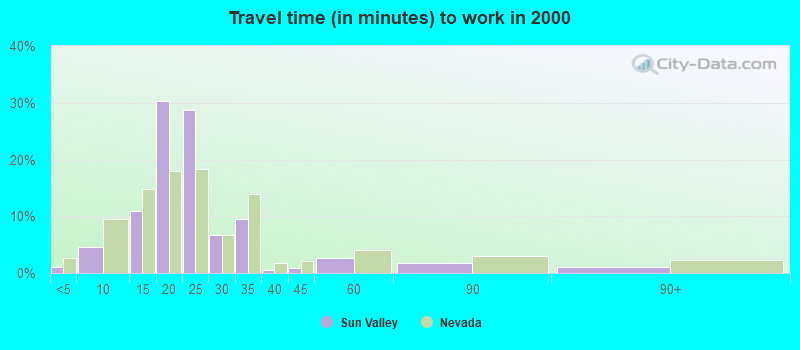
Travel time to work
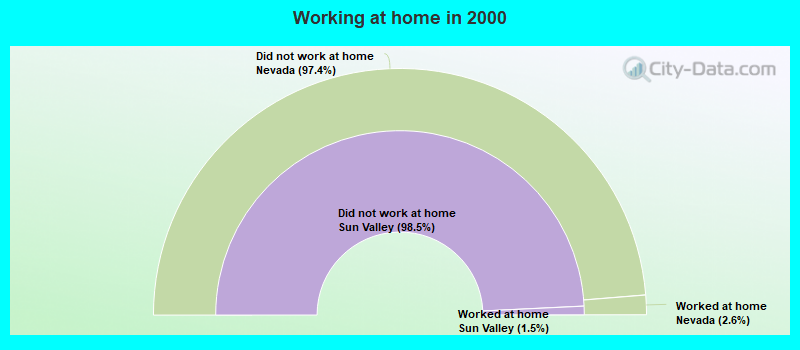
Percentage of workers working in this county: 97.4%
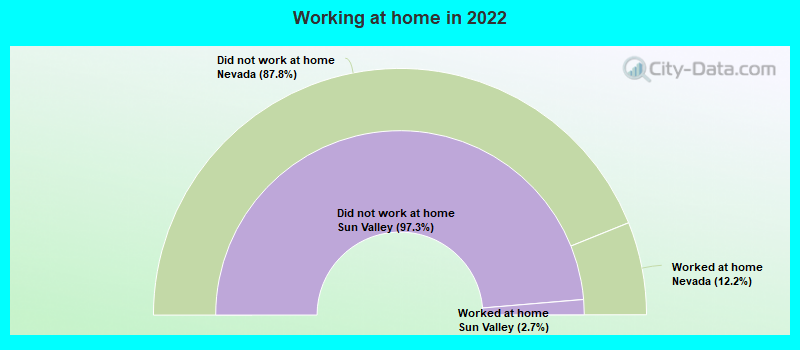
Number of people working at home: 244 (2.3% of all workers)
Daytime population change due to commuting: -7,805 (-40.1%)
Workers who live and work in this place: 581 (6.5%)
Number of people working at home: 244 (2.3% of all workers)
Daytime population change due to commuting: -7,805 (-40.1%)
Workers who live and work in this place: 581 (6.5%)
Less than 5 minutes:
| Sun Valley: | 3.8% (52) |
| Nevada: | 1.9% (24,625) |
5 to 9 minutes:
| Sun Valley: | 8.6% (118) |
| Nevada: | 7.7% (101,732) |
10 to 14 minutes:
| Sun Valley: | 17.1% (233) |
| Nevada: | 12.6% (166,011) |
15 to 19 minutes:
| Sun Valley: | 26.2% (358) |
| Nevada: | 16.7% (219,907) |
20 to 24 minutes:
| Sun Valley: | 12.5% (171) |
| Nevada: | 18.1% (237,977) |
25 to 29 minutes:
| Sun Valley: | 2.7% (36) |
| Nevada: | 9.0% (118,701) |
30 to 34 minutes:
| Sun Valley: | 18.8% (257) |
| Nevada: | 17.2% (226,012) |
40 to 44 minutes:
| Sun Valley: | 1.6% (21) |
| Nevada: | 3.5% (46,360) |
45 to 59 minutes:
| Sun Valley: | 2.2% (30) |
| Nevada: | 5.4% (70,902) |
60 to 89 minutes:
| Sun Valley: | 2.3% (31) |
| Nevada: | 3.1% (40,186) |
90 or more minutes:
| Sun Valley: | 3.5% (48) |
| Nevada: | 1.6% (21,418) |
Less than 5 minutes:
| Sun Valley: | 1.1% (102) |
| Nevada: | 2.7% (24,637) |
5 to 9 minutes:
| Sun Valley: | 4.7% (419) |
| Nevada: | 9.6% (88,626) |
10 to 14 minutes:
| Sun Valley: | 10.8% (975) |
| Nevada: | 14.9% (137,121) |
15 to 19 minutes:
| Sun Valley: | 30.3% (2,722) |
| Nevada: | 17.9% (165,652) |
20 to 24 minutes:
| Sun Valley: | 28.7% (2,578) |
| Nevada: | 18.3% (169,033) |
25 to 29 minutes:
| Sun Valley: | 6.8% (608) |
| Nevada: | 6.7% (62,292) |
30 to 34 minutes:
| Sun Valley: | 9.4% (848) |
| Nevada: | 14.0% (129,026) |
35 to 39 minutes:
| Sun Valley: | 0.5% (41) |
| Nevada: | 1.8% (17,061) |
40 to 44 minutes:
| Sun Valley: | 0.8% (75) |
| Nevada: | 2.1% (19,732) |
45 to 59 minutes:
| Sun Valley: | 2.6% (233) |
| Nevada: | 4.0% (37,254) |
60 to 89 minutes:
| Sun Valley: | 1.7% (157) |
| Nevada: | 3.1% (28,357) |
90 or more minutes:
| Sun Valley: | 1.1% (99) |
| Nevada: | 2.2% (20,487) |
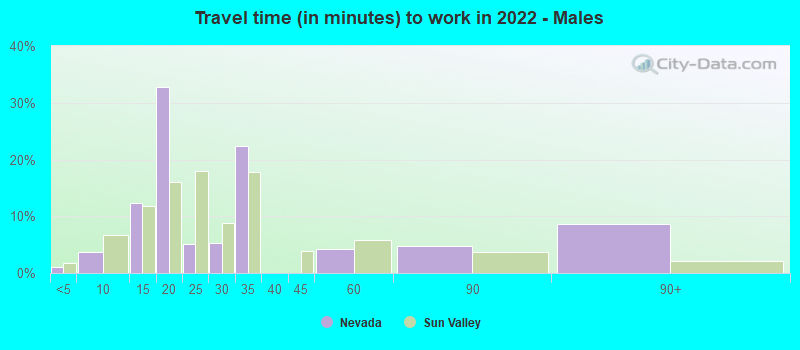
Less than 5 minutes - Males:
| Sun Valley: | 1.1% (7) |
| Nevada: | 1.7% (12,594) |
5 to 9 minutes - Males:
| Sun Valley: | 3.8% (26) |
| Nevada: | 6.8% (48,819) |
10 to 14 minutes - Males:
| Sun Valley: | 12.4% (86) |
| Nevada: | 11.7% (84,745) |
15 to 19 minutes - Males:
| Sun Valley: | 32.7% (226) |
| Nevada: | 16.1% (116,457) |
20 to 24 minutes - Males:
| Sun Valley: | 5.2% (36) |
| Nevada: | 17.9% (129,732) |
25 to 29 minutes - Males:
| Sun Valley: | 5.2% (36) |
| Nevada: | 8.9% (64,282) |
30 to 34 minutes - Males:
| Sun Valley: | 22.4% (154) |
| Nevada: | 17.8% (128,678) |
45 to 59 minutes - Males:
| Sun Valley: | 4.2% (29) |
| Nevada: | 5.8% (41,984) |
60 to 89 minutes - Males:
| Sun Valley: | 4.7% (32) |
| Nevada: | 3.8% (27,131) |
90 or more minutes - Males:
| Sun Valley: | 8.7% (60) |
| Nevada: | 2.1% (15,232) |
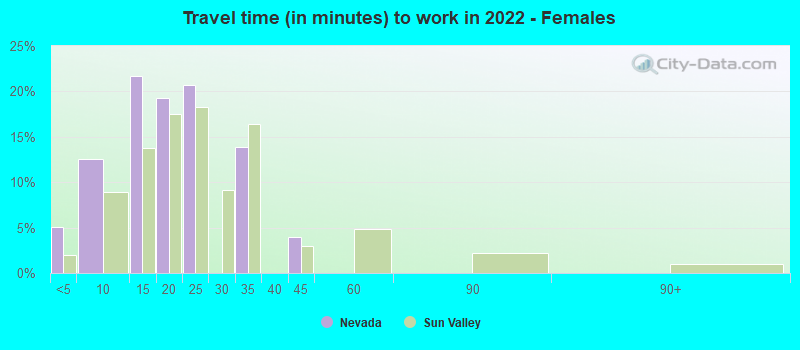
Less than 5 minutes - Females:
| Sun Valley: | 5.1% (35) |
| Nevada: | 2.0% (12,031) |
5 to 9 minutes - Females:
| Sun Valley: | 12.5% (85) |
| Nevada: | 8.9% (52,913) |
10 to 14 minutes - Females:
| Sun Valley: | 21.7% (146) |
| Nevada: | 13.7% (81,266) |
15 to 19 minutes - Females:
| Sun Valley: | 19.3% (130) |
| Nevada: | 17.5% (103,450) |
20 to 24 minutes - Females:
| Sun Valley: | 20.7% (140) |
| Nevada: | 18.3% (108,245) |
30 to 34 minutes - Females:
| Sun Valley: | 13.8% (93) |
| Nevada: | 16.4% (97,334) |
40 to 44 minutes - Females:
| Sun Valley: | 3.9% (27) |
| Nevada: | 3.0% (17,794) |
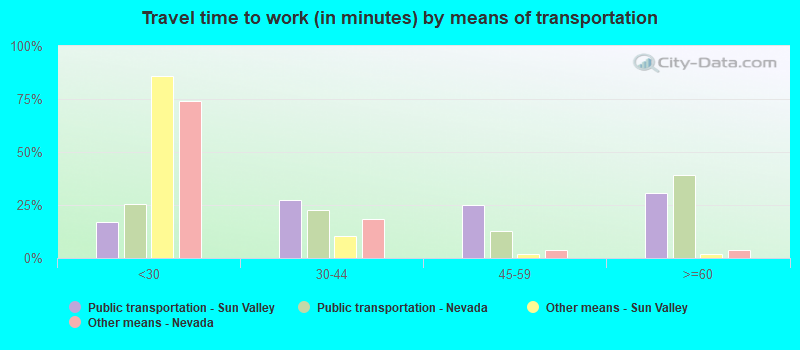
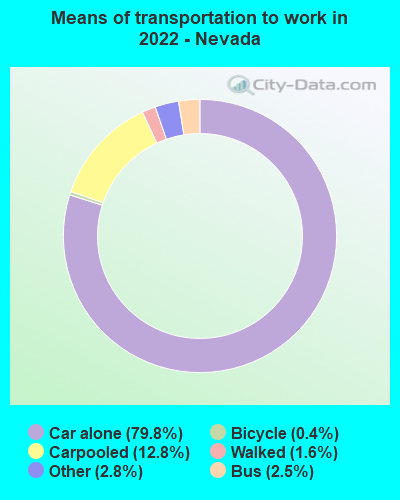
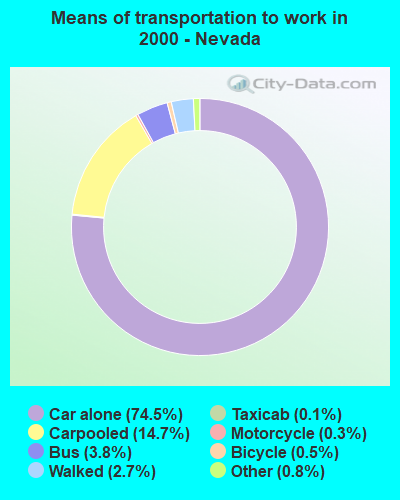
Means of transportation to work
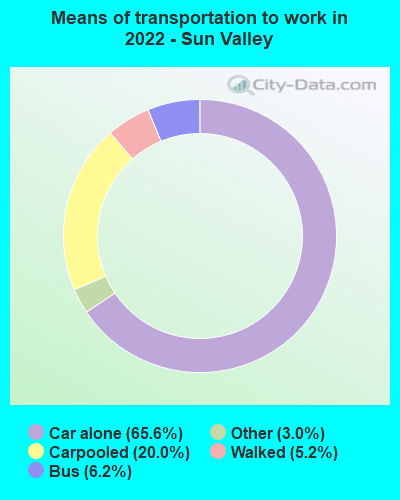
Drove car alone:
| Sun Valley: | 65.6% (910) |
| Nevada: | 79.8% (466,920) |
Carpooled:
| Sun Valley: | 20.0% (277) |
| Nevada: | 12.8% (86,355) |
Bus:
| Sun Valley: | 6.2% (86) |
| Nevada: | 2.5% (11,340) |
Walked:
| Sun Valley: | 5.2% (72) |
| Nevada: | 1.6% (10,080) |
Other means:
| Sun Valley: | 3.0% (42) |
| Nevada: | 2.8% (15,177) |
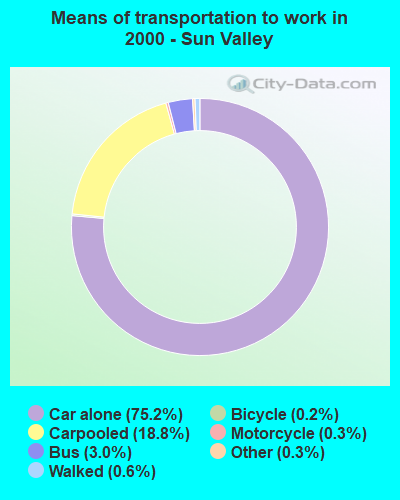
Drove car alone:
| Sun Valley: | 75.2% (6,766) |
| Nevada: | 74.5% (687,368) |
Carpooled:
| Sun Valley: | 18.8% (1,690) |
| Nevada: | 14.7% (135,874) |
Bus or trolley bus:
| Sun Valley: | 3.0% (272) |
| Nevada: | 3.8% (35,031) |
Motorcycle:
| Sun Valley: | 0.3% (25) |
| Nevada: | 0.3% (2,693) |
Bicycle:
| Sun Valley: | 0.2% (21) |
| Nevada: | 0.5% (4,545) |
Walked:
| Sun Valley: | 0.6% (53) |
| Nevada: | 2.7% (24,875) |
Other means:
| Sun Valley: | 0.3% (30) |
| Nevada: | 0.8% (7,477) |
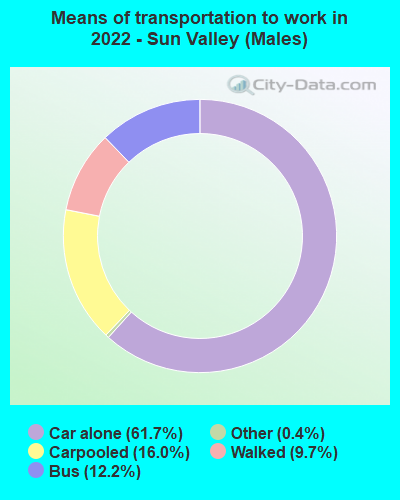
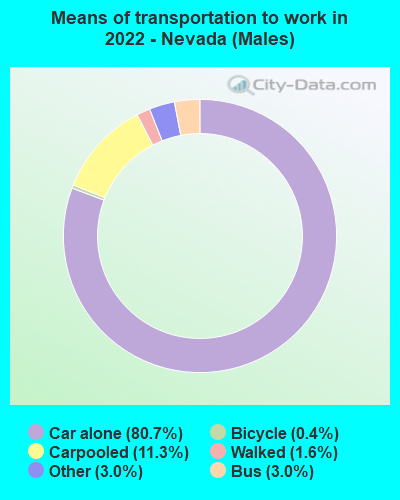
Drove car alone - Males:
| Sun Valley: | 61.7% (434) |
| Nevada: | 80.7% (466,920) |
Carpooled - Males:
| Sun Valley: | 16.0% (113) |
| Nevada: | 11.3% (86,355) |
Bus - Males:
| Sun Valley: | 12.2% (86) |
| Nevada: | 3.0% (11,340) |
Walked - Males:
| Sun Valley: | 9.7% (68) |
| Nevada: | 1.6% (10,080) |
Other means - Males:
| Sun Valley: | 0.4% (3) |
| Nevada: | 3.0% (15,177) |
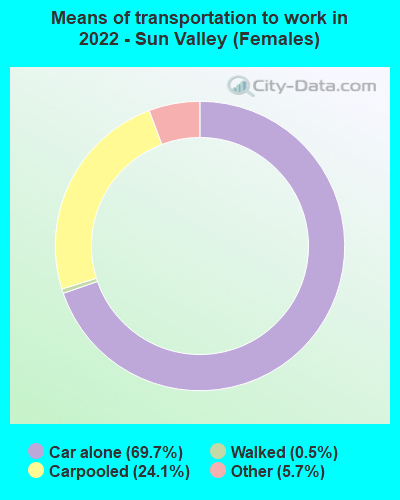
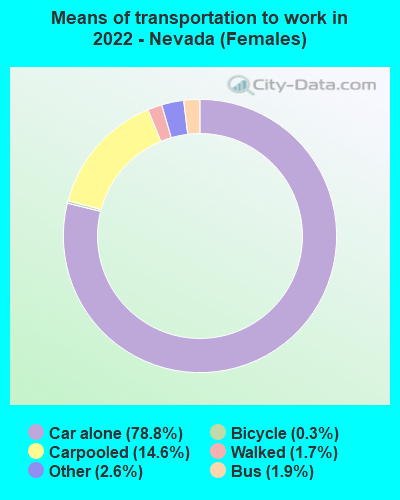
Drove car alone - Females:
| Sun Valley: | 69.7% (477) |
| Nevada: | 78.8% (466,920) |
Carpooled - Females:
| Sun Valley: | 24.1% (165) |
| Nevada: | 14.6% (86,355) |
Walked - Females:
| Sun Valley: | 0.5% (3) |
| Nevada: | 1.7% (10,080) |
Other means - Females:
| Sun Valley: | 5.7% (39) |
| Nevada: | 2.6% (15,177) |
Private vehicle occupancy
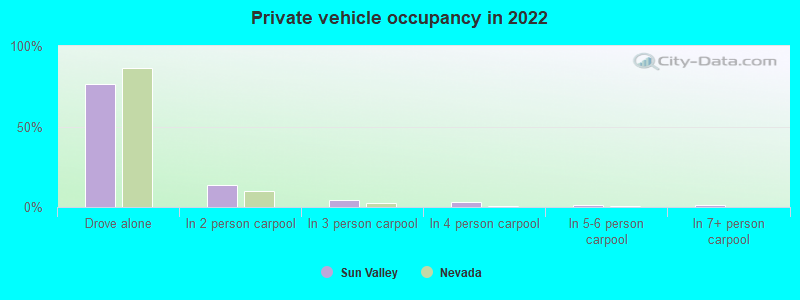
Drove alone:
| Sun Valley: | 76.2% (7,410) |
| Nevada: | 86.2% (1,053,747) |
In 2 person carpool:
| Sun Valley: | 13.8% (1,341) |
| Nevada: | 9.8% (119,603) |
In 3 person carpool:
| Sun Valley: | 4.4% (427) |
| Nevada: | 2.6% (31,745) |
In 4 person carpool:
| Sun Valley: | 2.9% (286) |
| Nevada: | 0.8% (9,602) |
In 5-6 person carpool:
| Sun Valley: | 1.4% (137) |
| Nevada: | 0.5% (6,330) |
In 7+ person carpool:
| Sun Valley: | 1.2% (120) |
| Nevada: | 0.2% (1,950) |
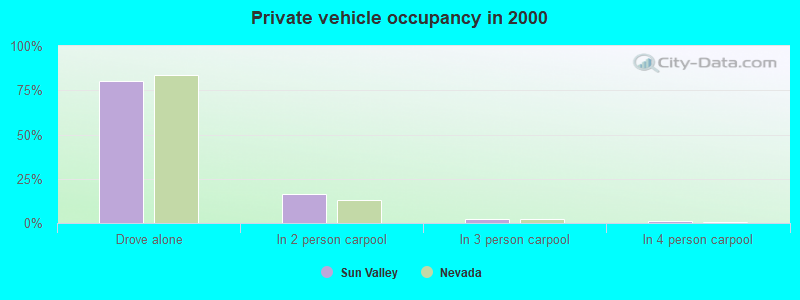
Drove alone:
| Sun Valley: | 80.0% (6,766) |
| Nevada: | 83.5% (687,368) |
In 2 person carpool:
| Sun Valley: | 16.4% (1,383) |
| Nevada: | 13.1% (108,073) |
In 3 person carpool:
| Sun Valley: | 2.4% (200) |
| Nevada: | 2.1% (17,292) |
In 4 person carpool:
| Sun Valley: | 0.9% (74) |
| Nevada: | 0.8% (6,404) |
In 5-6 person carpool:
| Sun Valley: | 0.4% (33) |
| Nevada: | 0.3% (2,878) |
Class of workers
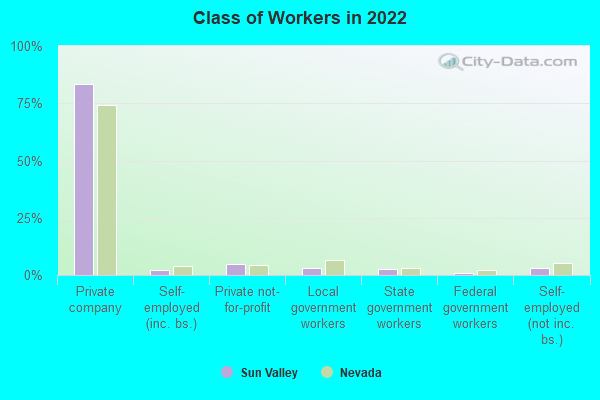
Employee of private company:
| Sun Valley: | 83.3% (8,915) |
| Nevada: | 74.4% (1,134,089) |
Self-employed in own incorporated business:
| Sun Valley: | 2.2% (236) |
| Nevada: | 3.9% (58,842) |
Private not-for-profit wage and salary workers:
| Sun Valley: | 4.9% (520) |
| Nevada: | 4.3% (65,709) |
Local government workers:
| Sun Valley: | 3.2% (339) |
| Nevada: | 6.6% (100,544) |
State government workers:
| Sun Valley: | 2.8% (299) |
| Nevada: | 3.0% (45,694) |
Federal government workers:
| Sun Valley: | 0.7% (78) |
| Nevada: | 2.2% (33,013) |
Self-employed workers in own not incorporated business:
| Sun Valley: | 2.9% (314) |
| Nevada: | 5.4% (82,796) |
Unpaid family workers:
| Sun Valley: | 0.1% (8) |
| Nevada: | 0.3% (4,207) |
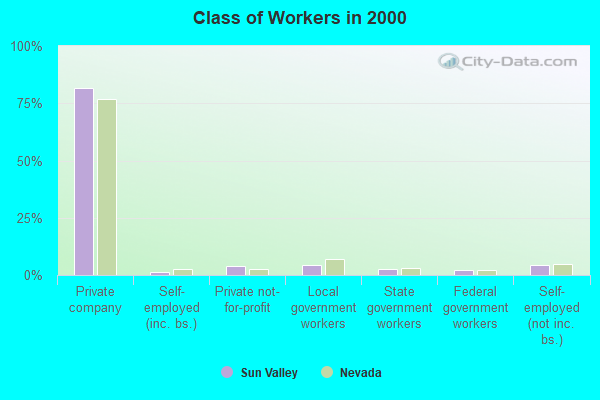
Employee of private company:
| Sun Valley: | 81.5% (7,402) |
| Nevada: | 76.8% (716,774) |
Self-employed in own incorporated business:
| Sun Valley: | 1.3% (114) |
| Nevada: | 2.8% (26,180) |
Private not-for-profit wage and salary workers:
| Sun Valley: | 3.9% (357) |
| Nevada: | 2.8% (26,101) |
Local government workers:
| Sun Valley: | 4.3% (393) |
| Nevada: | 7.0% (65,211) |
State government workers:
| Sun Valley: | 2.6% (239) |
| Nevada: | 3.2% (30,014) |
Federal government workers:
| Sun Valley: | 2.0% (183) |
| Nevada: | 2.3% (21,071) |
Self-employed workers in own not incorporated business:
| Sun Valley: | 4.3% (394) |
| Nevada: | 4.9% (45,578) |
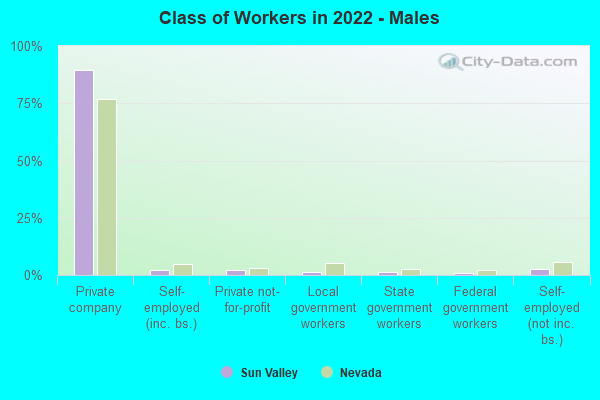
Employee of private company - Males:
| Sun Valley: | 89.5% (5,388) |
| Nevada: | 76.7% (628,875) |
Self-employed in own incorporated business - Males:
| Sun Valley: | 2.1% (123) |
| Nevada: | 4.6% (37,601) |
Private not-for-profit wage and salary workers - Males:
| Sun Valley: | 2.2% (133) |
| Nevada: | 3.1% (25,024) |
Local government workers - Males:
| Sun Valley: | 1.1% (67) |
| Nevada: | 5.2% (42,771) |
State government workers - Males:
| Sun Valley: | 1.4% (81) |
| Nevada: | 2.6% (21,189) |
Federal government workers - Males:
| Sun Valley: | 1.0% (62) |
| Nevada: | 2.2% (17,921) |
Self-employed workers in own not incorporated business - Males:
| Sun Valley: | 2.6% (156) |
| Nevada: | 5.5% (45,353) |
Unpaid family workers - Males:
| Sun Valley: | 0.1% (8) |
| Nevada: | 0.2% (1,304) |
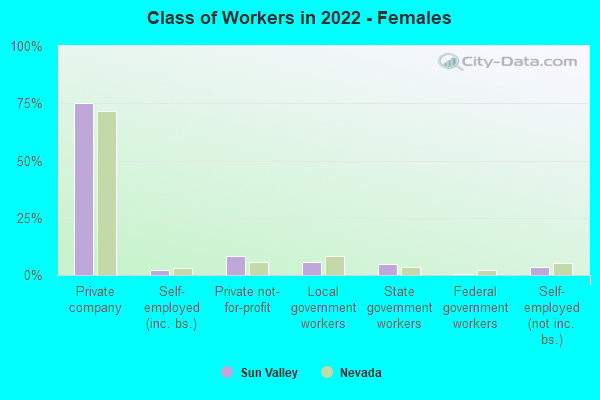
Employee of private company - Females:
| Sun Valley: | 75.2% (3,527) |
| Nevada: | 71.7% (505,214) |
Self-employed in own incorporated business - Females:
| Sun Valley: | 2.4% (112) |
| Nevada: | 3.0% (21,241) |
Private not-for-profit wage and salary workers - Females:
| Sun Valley: | 8.2% (387) |
| Nevada: | 5.8% (40,685) |
Local government workers - Females:
| Sun Valley: | 5.8% (272) |
| Nevada: | 8.2% (57,773) |
State government workers - Females:
| Sun Valley: | 4.7% (218) |
| Nevada: | 3.5% (24,505) |
Federal government workers - Females:
| Sun Valley: | 0.4% (16) |
| Nevada: | 2.1% (15,092) |
Self-employed workers in own not incorporated business - Females:
| Sun Valley: | 3.4% (157) |
| Nevada: | 5.3% (37,443) |