Work and Jobs in West Compton, California (CA) Detailed Stats
Occupations, Industries, Unemployment, Workers, Commute

Recent posts about work in West Compton, California on our local forum with over 2,400,000 registered users:
 | How safe is West Rancho Dominguez? (West Compton area) (7 replies) |
| Compton - Comparing now vs. 8 years ago (23 replies) |
| Night Shift in West Compton Factory (7 replies) |
| Rebound in black population - possible? (54 replies) |
| Why do people say they love L.A., (38 replies) |
| What is worse Compton or Watts or Inglewood? (39 replies) |
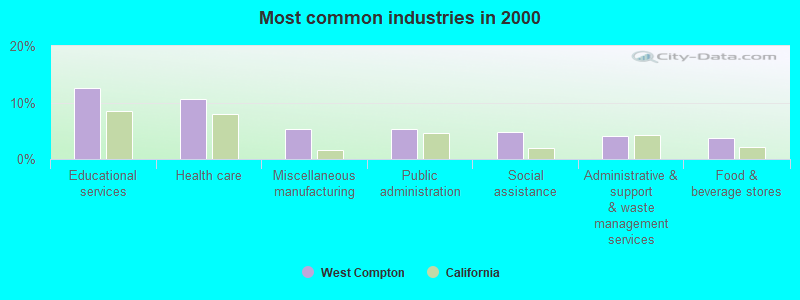
The most common industries in West Compton are: Educational services (12.6% of civilian employees), Health care (10.5% of civilian employees), Miscellaneous manufacturing (5.3% of civilian employees). 63.8% of workers are employees of private companies, which is 6.6% less than the rate of 68.0% across the entire state of California.
Most common industries
Most common industries | |||
|---|---|---|---|
Industry | All | Males | Females |
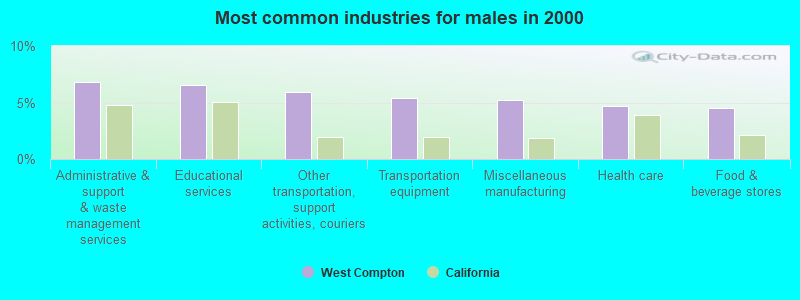
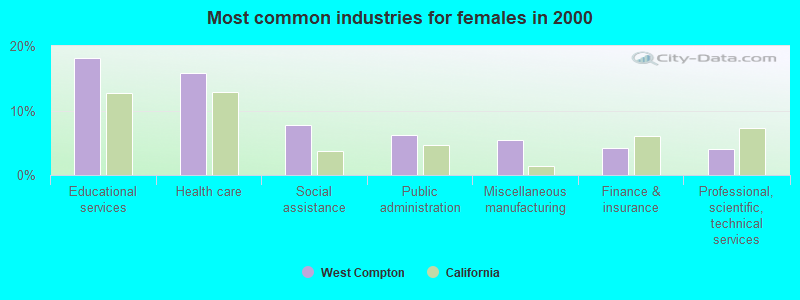
| Educational services | 12.6% (230) | 6.6% (57) | 18.1% (173) |
| Health care | 10.5% (192) | 4.7% (41) | 15.8% (151) |
| Miscellaneous manufacturing | 5.3% (97) | 5.2% (45) | 5.4% (52) |
| Public administration | 5.3% (96) | 4.3% (37) | 6.2% (59) |
| Social assistance | 4.8% (88) | 1.6% (14) | 7.7% (74) |
| Administrative and support and waste management services | 4.0% (73) | 6.8% (59) | 1.5% (14) |
| Food and beverage stores | 3.8% (69) | 4.5% (39) | 3.1% (30) |
| Professional, scientific, and technical services | 3.5% (64) | 3.0% (26) | 4.0% (38) |
| Other transportation, and support activities, and couriers | 3.5% (64) | 5.9% (51) | 1.4% (13) |
| Transportation equipment | 3.1% (57) | 5.4% (47) | 1.0% (10) |
| Accommodation and food services | 3.0% (54) | 3.1% (27) | 2.8% (27) |
| Finance and insurance | 2.7% (49) | 1.0% (9) | 4.2% (40) |
| Construction | 2.5% (45) | 4.4% (38) | 0.7% (7) |
| U. S. Postal service | 2.5% (45) | 1.0% (9) | 3.8% (36) |
| Repair and maintenance | 2.4% (44) | 4.2% (36) | 0.8% (8) |
| Apparel | 2.1% (38) | 2.0% (17) | 2.2% (21) |
| Truck transportation | 2.1% (38) | 1.4% (12) | 2.7% (26) |
| Department and other general merchandise stores | 1.6% (29) | 1.0% (9) | 2.1% (20) |
| Miscellaneous nondurable goods merchant wholesalers | 1.4% (26) | 1.2% (10) | 1.7% (16) |
| Broadcasting and telecommunications | 1.4% (25) | 2.2% (19) | 0.6% (6) |
| Religious, grantmaking, civic, professional, and similar organizations | 1.3% (24) | 0.8% (7) | 1.8% (17) |
| Printing and related support activities | 1.2% (22) | 1.3% (11) | 1.1% (11) |
| Personal and laundry services | 1.2% (22) | 0.5% (4) | 1.9% (18) |
| Arts, entertainment, and recreation | 1.2% (21) | 2.4% (21) | 0.0% (0) |
| Food | 1.1% (20) | 2.3% (20) | 0.0% (0) |
| Chemicals | 1.0% (19) | 1.3% (11) | 0.8% (8) |
| Machinery | 1.0% (18) | 2.1% (18) | 0.0% (0) |
| Groceries and related products merchant wholesalers | 0.9% (17) | 2.0% (17) | 0.0% (0) |
| Sporting goods, camera, and hobby and toy stores | 0.9% (16) | 0.0% (0) | 1.7% (16) |
| Machinery, equipment, and supplies merchant wholesalers | 0.8% (14) | 1.6% (14) | 0.0% (0) |
| Paper and paper products merchant wholesalers | 0.8% (14) | 1.6% (14) | 0.0% (0) |
| Miscellaneous durable goods merchant wholesalers | 0.7% (12) | 1.4% (12) | 0.0% (0) |
| Plastics and rubber products | 0.7% (12) | 0.8% (7) | 0.5% (5) |
| Wood products | 0.7% (12) | 1.4% (12) | 0.0% (0) |
| Apparel, fabrics, and notions merchant wholesalers | 0.6% (11) | 0.0% (0) | 1.1% (11) |
| Private households | 0.6% (11) | 0.0% (0) | 1.1% (11) |
| Furniture and related product manufacturing | 0.5% (10) | 1.2% (10) | 0.0% (0) |
| Metal and metal products | 0.5% (10) | 1.2% (10) | 0.0% (0) |
| Nonmetallic mineral products | 0.5% (9) | 0.5% (4) | 0.5% (5) |
| Air transportation | 0.5% (9) | 1.0% (9) | 0.0% (0) |
| Radio, TV, and computer stores | 0.4% (8) | 0.0% (0) | 0.8% (8) |
| Textile mills and textile products | 0.4% (8) | 0.9% (8) | 0.0% (0) |
| Retail florists | 0.4% (8) | 0.0% (0) | 0.8% (8) |
| Computer and electronic products | 0.4% (7) | 0.8% (7) | 0.0% (0) |
| Building material and garden equipment and supplies dealers | 0.4% (7) | 0.8% (7) | 0.0% (0) |
| Pharmacies and drug stores | 0.4% (7) | 0.0% (0) | 0.7% (7) |
| Warehousing and storage | 0.4% (7) | 0.8% (7) | 0.0% (0) |
| Used merchandise, gift, novelty, and souvenir, and other miscellaneous stores | 0.3% (6) | 0.7% (6) | 0.0% (0) |
| Furniture and home furnishings, and household appliance stores | 0.3% (6) | 0.7% (6) | 0.0% (0) |
| Real estate and rental and leasing | 0.3% (6) | 0.0% (0) | 0.6% (6) |
| Electrical equipment, appliances, and components | 0.3% (6) | 0.7% (6) | 0.0% (0) |
| Petroleum and coal products | 0.3% (6) | 0.7% (6) | 0.0% (0) |
| Office supplies and stationery stores | 0.3% (5) | 0.6% (5) | 0.0% (0) |
| Motor vehicle and parts dealers | 0.3% (5) | 0.6% (5) | 0.0% (0) |
| Other direct selling establishments | 0.3% (5) | 0.0% (0) | 0.5% (5) |
Unemployment in West Compton
- Unemployment by race in 2000
- Unemployment rate for White non-Hispanic residents
- 54.5%Males
- Unemployment rate for Black residents
- 14.4%Males
- 11.3%Females
- Unemployment rate for American Indian and Alaska Native residents
- 32.3%Males
- 66.7%Females
- Unemployment rate for other race residents
- 11.8%Males
- 13.9%Females
- Unemployment rate for two or more race residents
- 48.4%Males
- 21.2%Females
- Unemployment rate for Hispanic or Latino residents
- 10.8%Males
- 11.1%Females
Time leaving home to go to work

<5am:
| West Compton: | 7.4% (132) |
| California: | 4.2% (606,086) |
5:30am:
| West Compton: | 2.6% (47) |
| California: | 3.6% (523,209) |
6am:
| West Compton: | 7.0% (126) |
| California: | 4.8% (692,256) |
6:30am:
| West Compton: | 12.1% (216) |
| California: | 8.4% (1,216,867) |
7am:
| West Compton: | 8.5% (152) |
| California: | 9.4% (1,362,830) |
7:30am:
| West Compton: | 16.5% (296) |
| California: | 13.8% (2,006,950) |
8am:
| West Compton: | 11.6% (207) |
| California: | 13.7% (1,986,831) |
8:30am:
| West Compton: | 5.8% (104) |
| California: | 10.9% (1,577,815) |
9am:
| West Compton: | 2.4% (43) |
| California: | 5.4% (778,152) |
10am:
| West Compton: | 2.5% (45) |
| California: | 6.7% (972,355) |
11am:
| West Compton: | 2.5% (44) |
| California: | 2.9% (414,479) |
12pm:
| West Compton: | 2.3% (42) |
| California: | 1.3% (189,005) |
4pm:
| West Compton: | 9.0% (161) |
| California: | 6.0% (865,284) |
>4pm:
| West Compton: | 7.0% (125) |
| California: | 5.3% (776,167) |
Travel time to work
Daytime population change due to commuting: +6,449 (+118.7%)
Workers who live and work in this place: 83 (4.6%)
Workers who live and work in this place: 83 (4.6%)


Less than 5 minutes:
| West Compton: | 1.2% (22) |
| California: | 2.2% (324,703) |
5 to 9 minutes:
| West Compton: | 4.3% (77) |
| California: | 8.8% (1,280,443) |
10 to 14 minutes:
| West Compton: | 6.8% (122) |
| California: | 13.3% (1,930,263) |
15 to 19 minutes:
| West Compton: | 19.2% (344) |
| California: | 14.9% (2,157,970) |
20 to 24 minutes:
| West Compton: | 18.1% (323) |
| California: | 13.8% (2,004,060) |
25 to 29 minutes:
| West Compton: | 4.9% (87) |
| California: | 5.4% (782,241) |
30 to 34 minutes:
| West Compton: | 16.8% (301) |
| California: | 13.9% (2,025,657) |
35 to 39 minutes:
| West Compton: | 4.0% (72) |
| California: | 2.5% (366,487) |
40 to 44 minutes:
| West Compton: | 4.0% (71) |
| California: | 3.6% (528,043) |
45 to 59 minutes:
| West Compton: | 12.1% (217) |
| California: | 7.9% (1,151,598) |
60 to 89 minutes:
| West Compton: | 2.6% (47) |
| California: | 6.4% (933,123) |
90 or more minutes:
| West Compton: | 3.2% (57) |
| California: | 3.3% (483,698) |
Means of transportation to work


Drove car alone:
| West Compton: | 70.1% (1,254) |
| California: | 71.8% (10,432,462) |
Carpooled:
| West Compton: | 20.5% (367) |
| California: | 14.5% (2,113,313) |
Bus or trolley bus:
| West Compton: | 5.3% (95) |
| California: | 3.8% (549,425) |
Motorcycle:
| West Compton: | 0.2% (4) |
| California: | 0.2% (36,262) |
Bicycle:
| West Compton: | 0.3% (5) |
| California: | 0.8% (120,567) |
Walked:
| West Compton: | 0.6% (10) |
| California: | 2.9% (414,581) |
Other means:
| West Compton: | 0.3% (5) |
| California: | 0.8% (115,064) |
Private vehicle occupancy

Drove alone:
| West Compton: | 77.4% (1,254) |
| California: | 83.2% (10,432,462) |
In 2 person carpool:
| West Compton: | 15.7% (254) |
| California: | 12.5% (1,564,905) |
In 3 person carpool:
| West Compton: | 4.6% (74) |
| California: | 2.6% (330,732) |
In 4 person carpool:
| West Compton: | 2.4% (39) |
| California: | 1.0% (119,364) |
Class of workers

Employee of private company:
| West Compton: | 63.8% (1,163) |
| California: | 68.0% (10,009,465) |
Self-employed in own incorporated business:
| West Compton: | 1.5% (27) |
| California: | 2.7% (402,392) |
Private not-for-profit wage and salary workers:
| West Compton: | 6.5% (119) |
| California: | 5.7% (845,536) |
Local government workers:
| West Compton: | 14.8% (269) |
| California: | 8.3% (1,218,764) |
State government workers:
| West Compton: | 4.1% (75) |
| California: | 4.0% (594,953) |
Federal government workers:
| West Compton: | 5.1% (93) |
| California: | 2.3% (344,354) |
Self-employed workers in own not incorporated business:
| West Compton: | 4.2% (77) |
| California: | 8.5% (1,249,530) |

Employee of private company - Males:
| West Compton: | 72.6% (629) |
| California: | 71.1% (5,716,697) |
Self-employed in own incorporated business - Males:
| West Compton: | 1.2% (10) |
| California: | 3.6% (290,657) |
Private not-for-profit wage and salary workers - Males:
| West Compton: | 4.2% (36) |
| California: | 3.8% (303,997) |
Local government workers - Males:
| West Compton: | 9.5% (82) |
| California: | 6.2% (495,927) |
State government workers - Males:
| West Compton: | 3.7% (32) |
| California: | 3.2% (255,434) |
Federal government workers - Males:
| West Compton: | 3.8% (33) |
| California: | 2.5% (198,555) |
Self-employed workers in own not incorporated business - Males:
| West Compton: | 5.1% (44) |
| California: | 9.5% (760,853) |

Employee of private company - Females:
| West Compton: | 55.8% (534) |
| California: | 64.3% (4,292,768) |
Self-employed in own incorporated business - Females:
| West Compton: | 1.8% (17) |
| California: | 1.7% (111,735) |
Private not-for-profit wage and salary workers - Females:
| West Compton: | 8.7% (83) |
| California: | 8.1% (541,539) |
Local government workers - Females:
| West Compton: | 19.5% (187) |
| California: | 10.8% (722,837) |
State government workers - Females:
| West Compton: | 4.5% (43) |
| California: | 5.1% (339,519) |
Federal government workers - Females:
| West Compton: | 6.3% (60) |
| California: | 2.2% (145,799) |
Self-employed workers in own not incorporated business - Females:
| West Compton: | 3.4% (33) |
| California: | 7.3% (488,677) |