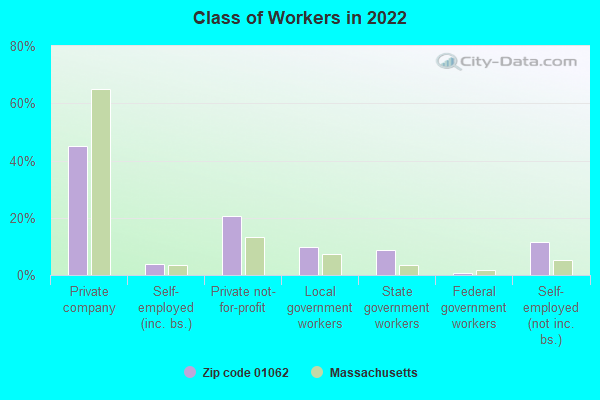
Estimated zip code population in 2022: 9,487 Zip code population in 2010: 11,150 Zip code population in 2000: 11,225
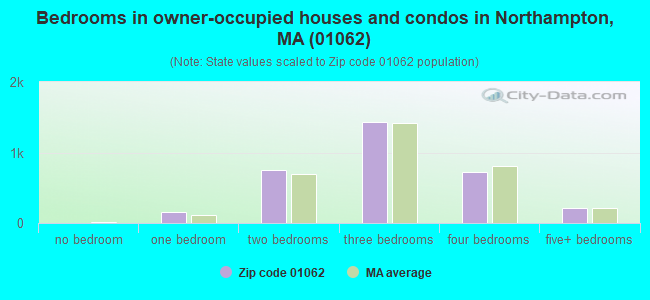
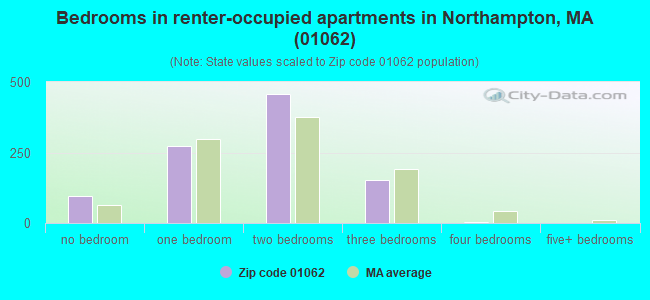
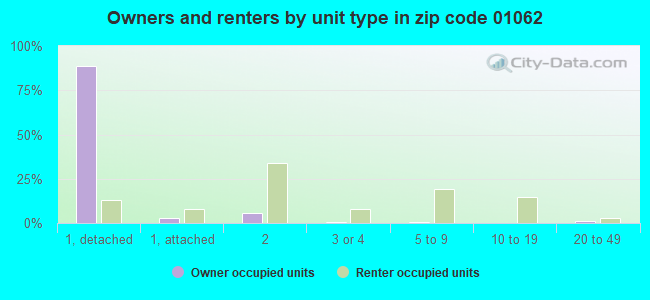
Houses and condos: 4,522 Renter-occupied apartments: 985
% of renters here:
23%
State:
38%
March 2022 cost of living index in zip code 01062: 107.6 (more than average, U.S. average is 100)
Land area: 18.2 sq. mi. Water area: 0.2 sq. mi.
Population density: 523 people per square mile
(low).
OSM Map
Google Map
MSN Map
OSM Map
General Map
Google Map
MSN Map
OSM Map
Google Map
MSN Map
OSM Map
Google Map
MSN Map
Please wait while loading the map...
Real estate property taxes paid for housing units in 2022:
This zip code:
1.2% ($4,896)
Massachusetts:
1.0% ($5,536)
Median real estate property taxes paid for housing units with mortgages in 2022: $4,845 (1.2%) Median real estate property taxes paid for housing units with no mortgage in 2022: $5,056 (1.3%)
Business Search- 14 Million verified businesses
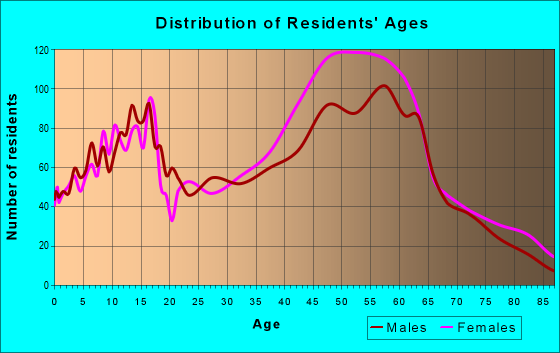
Males: 4,533
(47.8%)
Females: 4,954
(52.2%)
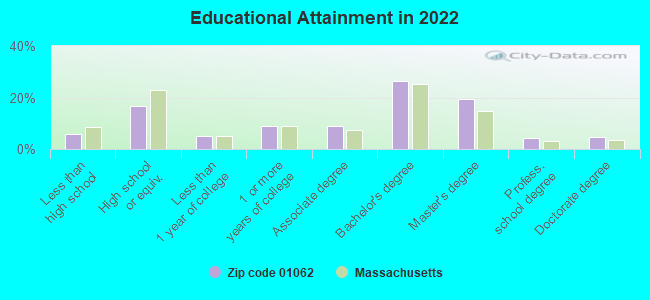
For population 25 years and over in 01062:
High school or higher: 93.9%
Bachelor's degree or higher: 54.5%
Graduate or professional degree: 28.2%
Unemployed: 2.4%
Mean travel time to work (commute): 21.9 minutes
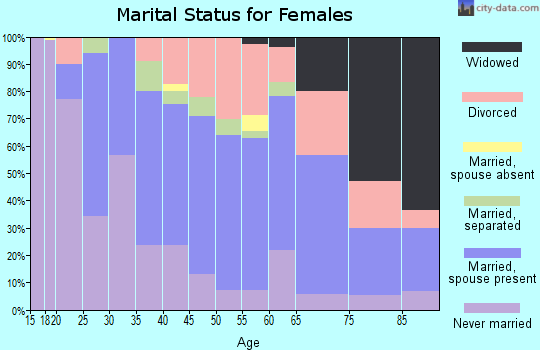
For population 15 years and over in 01062:
Never married: 30.7%
Now married: 49.1%
Separated: 1.1%
Widowed: 5.2%
Divorced: 13.7%
Zip code 01062 compared to state average:
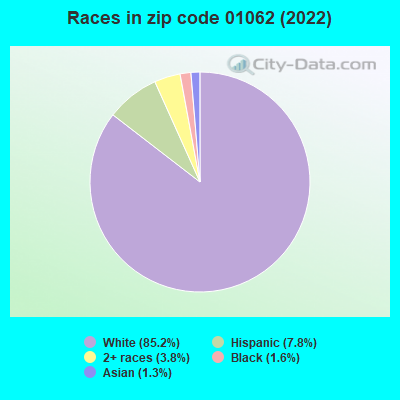
Black race population percentage significantly below state average.
Median age significantly above state average.
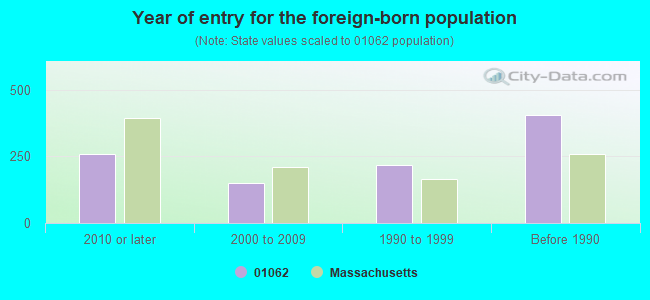
Foreign-born population percentage significantly below state average.
Renting percentage below state average.
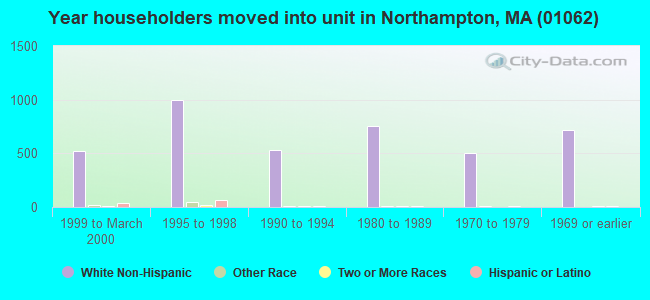
Length of stay since moving in significantly above state average.
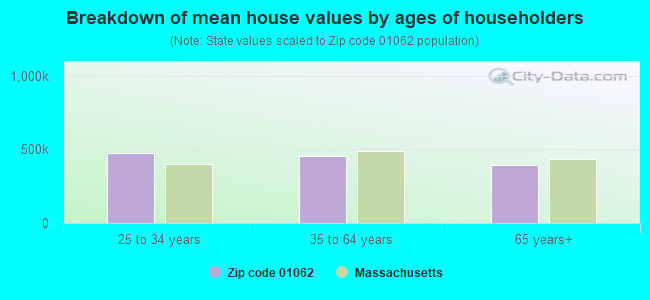
Estimated median house/condo value in 2022: $413,373
01062:
$413,373
Massachusetts:
$534,700
According to our research of Massachusetts and other state lists, there were 3 registered sex offenders living in 01062 zip code as of April 25, 2024. The ratio of all residents to sex offenders in zip code 01062 is 3,674 to 1. The ratio of registered sex offenders to all residents in this zip code is lower than the state average.
Median resident age:
This zip code:
50.2 years
Massachusetts median age:
40.3 years
Average household size:
This zip code:
2.1 people
Massachusetts:
2.4 people
Averages for the 2020 tax year for zip code 01062, filed in 2021:
Average Adjusted Gross Income (AGI) in 2020: $109,817 (Individual Income Tax Returns)
Here:
$109,817
State:
$105,130
Salary/wage: $68,248 (reported on 75.4% of returns)
Here:
$68,248
State:
$82,951
(% of AGI for various income ranges: 1092.7% for AGIs below $25k, 3496.0% for AGIs $25k-50k, 6206.7% for AGIs $50k-75k, 9116.6% for AGIs $75k-100k, 17713.7% for AGIs $100k-200k, 71715.0% for AGIs over 200k)
Taxable interest for individuals: $1,999 (reported on 48.1% of returns)
This zip code:
$1,999
Massachusetts:
$2,361
(% of AGI for various income ranges: 26.7% for AGIs below $25k, 45.6% for AGIs $25k-50k, 57.6% for AGIs $50k-75k, 154.0% for AGIs $75k-100k, 226.5% for AGIs $100k-200k, 2080.0% for AGIs over 200k)
Ordinary dividends: $9,035 (reported on 32.6% of returns)
Here:
$9,035
State:
$10,365
(% of AGI for various income ranges: 50.8% for AGIs below $25k, 113.8% for AGIs $25k-50k, 203.5% for AGIs $50k-75k, 366.3% for AGIs $75k-100k, 692.6% for AGIs $100k-200k, 6902.9% for AGIs over 200k)
Net capital gain/loss in AGI: +$24,364 (reported on 28.4% of returns)
Here:
+$24,364
State:
+$48,178
(% of AGI for various income ranges: 22.6% for AGIs below $25k, 81.0% for AGIs $25k-50k, 185.2% for AGIs $50k-75k, 364.9% for AGIs $75k-100k, 998.9% for AGIs $100k-200k, 22622.1% for AGIs over 200k)
Profit/loss from business: +$24,285 (reported on 21.5% of returns)
Here:
+$24,285
State:
+$20,792
(% of AGI for various income ranges: 116.6% for AGIs below $25k, 296.2% for AGIs $25k-50k, 564.8% for AGIs $50k-75k, 917.1% for AGIs $75k-100k, 1681.1% for AGIs $100k-200k, 8260.0% for AGIs over 200k)
Taxable individual retirement arrangement distribution: $19,332 (reported on 14.4% of returns)
01062:
$19,332
Massachusetts:
$22,790
(% of AGI for various income ranges: 102.6% for AGIs below $25k, 185.5% for AGIs $25k-50k, 246.7% for AGIs $50k-75k, 564.3% for AGIs $75k-100k, 1012.4% for AGIs $100k-200k, 3590.7% for AGIs over 200k)
Self-employed (Keogh) retirement plans: $18,369 (reported on 2.2% of returns)
01062:
$18,369
Massachusetts:
$26,868
(% of AGI for various income ranges: 62.8% for AGIs $50k-75k, 123.3% for AGIs $100k-200k, 987.9% for AGIs over 200k)
Total itemized deductions: $32,029 (reported on 9.6% of returns)
Here:
$32,029
State:
$36,722
(% of AGI for various income ranges: 101.9% for AGIs below $25k, 125.9% for AGIs $25k-50k, 433.1% for AGIs $50k-75k, 499.1% for AGIs $75k-100k, 838.7% for AGIs $100k-200k, 5261.4% for AGIs over 200k)
Charity contributions: $9,996 (reported on 8.1% of returns)
Here:
$9,996
State:
$12,529
(% of AGI for various income ranges: 4.3% for AGIs below $25k, 10.0% for AGIs $25k-50k, 52.6% for AGIs $50k-75k, 39.4% for AGIs $75k-100k, 109.6% for AGIs $100k-200k, 2545.7% for AGIs over 200k)
Taxes paid: $8,596 (reported on 9.6% of returns)
01062:
$8,596
State:
$8,782
(% of AGI for various income ranges: 19.5% for AGIs below $25k, 42.8% for AGIs $25k-50k, 123.5% for AGIs $50k-75k, 193.4% for AGIs $75k-100k, 266.1% for AGIs $100k-200k, 1078.6% for AGIs over 200k)
Earned income credit: $1,538 (reported on 8.6% of returns)
Here:
$1,538
State:
$1,909
(% of AGI for various income ranges: 40.8% for AGIs below $25k, 48.8% for AGIs $25k-50k)
Percentage of individuals using paid preparers for their 2020 taxes: 92.1%
Here:
92%
State:
92%
(% for various income ranges: 91.2% for AGIs below $25k, 92.5% for AGIs $25k-50k, 93.0% for AGIs $50k-75k, 90.3% for AGIs $75k-100k, 92.5% for AGIs $100k-200k, 93.9% for AGIs over 200k)
Averages for the 2012 tax year for zip code 01062, filed in 2013:
Average Adjusted Gross Income (AGI) in 2012: $69,253 (Individual Income Tax Returns)
Here:
$69,253
State:
$81,425
Salary/wage: $55,580 (reported on 80.5% of returns)
Here:
$55,580
State:
$64,752
(% of AGI for various income ranges: 67.2% for AGIs below $25k, 70.4% for AGIs $25k-50k, 72.4% for AGIs $50k-75k, 75.1% for AGIs $75k-100k, 72.3% for AGIs $100k-200k, 47.3% for AGIs over 200k)
Taxable interest for individuals: $1,214 (reported on 54.4% of returns)
This zip code:
$1,214
Massachusetts:
$2,136
(% of AGI for various income ranges: 1.8% for AGIs below $25k, 0.9% for AGIs $25k-50k, 0.9% for AGIs $50k-75k, 1.1% for AGIs $75k-100k, 1.1% for AGIs $100k-200k, 0.6% for AGIs over 200k)
Ordinary dividends: $5,049 (reported on 30.8% of returns)
Here:
$5,049
State:
$9,473
(% of AGI for various income ranges: 2.7% for AGIs below $25k, 1.5% for AGIs $25k-50k, 2.0% for AGIs $50k-75k, 1.8% for AGIs $75k-100k, 2.0% for AGIs $100k-200k, 3.0% for AGIs over 200k)
Net capital gain/loss in AGI: +$9,637 (reported on 22.2% of returns)
Here:
+$9,637
State:
+$31,437
(% of AGI for various income ranges: 0.5% for AGIs $25k-50k, 1.0% for AGIs $50k-75k, 0.6% for AGIs $75k-100k, 2.9% for AGIs $100k-200k, 6.9% for AGIs over 200k)
Profit/loss from business: +$22,304 (reported on 22.0% of returns)
Here:
+$22,304
State:
+$20,662
(% of AGI for various income ranges: 11.1% for AGIs below $25k, 7.4% for AGIs $25k-50k, 6.4% for AGIs $50k-75k, 5.9% for AGIs $75k-100k, 6.4% for AGIs $100k-200k, 7.6% for AGIs over 200k)
Taxable individual retirement arrangement distribution: $13,891 (reported on 12.3% of returns)
01062:
$13,891
Massachusetts:
$18,892
(% of AGI for various income ranges: 3.2% for AGIs below $25k, 2.7% for AGIs $25k-50k, 2.3% for AGIs $50k-75k, 2.0% for AGIs $75k-100k, 3.1% for AGIs $100k-200k, 2.1% for AGIs over 200k)
Self-employment retirement plans: $17,671 (reported on 2.5% of returns)
01062:
$17,671
Massachusetts:
$20,669
(% of AGI for various income ranges: 0.6% for AGIs $50k-75k, 0.6% for AGIs $100k-200k, 1.3% for AGIs over 200k)
Total itemized deductions: $20,818 (18% of AGI, reported on 42.3% of returns)
Here:
$20,818
State:
$28,907
Here:
17.6% of AGI
State:
18.2% of AGI
(% of AGI for various income ranges: 12.2% for AGIs below $25k, 12.3% for AGIs $25k-50k, 14.2% for AGIs $50k-75k, 14.5% for AGIs $75k-100k, 14.8% for AGIs $100k-200k, 9.8% for AGIs over 200k)
Charity contributions: $2,493 (reported on 34.3% of returns)
Here:
$2,493
State:
$4,208
(% of AGI for various income ranges: 0.6% for AGIs below $25k, 0.9% for AGIs $25k-50k, 1.0% for AGIs $50k-75k, 1.3% for AGIs $75k-100k, 1.3% for AGIs $100k-200k, 1.6% for AGIs over 200k)
Taxes paid: $9,908 (reported on 42.3% of returns)
01062:
$9,908
State:
$13,303
(% of AGI for various income ranges: 3.6% for AGIs below $25k, 4.3% for AGIs $25k-50k, 5.6% for AGIs $50k-75k, 6.4% for AGIs $75k-100k, 7.5% for AGIs $100k-200k, 6.1% for AGIs over 200k)
Earned income credit: $1,703 (reported on 10.9% of returns)
Here:
$1,703
State:
$1,971
(% of AGI for various income ranges: 3.7% for AGIs below $25k, 0.5% for AGIs $25k-50k)
Percentage of individuals using paid preparers for their 2012 taxes: 59.2%
Here:
59%
State:
56%
(% for various income ranges: 51.3% for AGIs below $25k, 59.5% for AGIs $25k-50k, 61.8% for AGIs $50k-75k, 63.2% for AGIs $75k-100k, 65.3% for AGIs $100k-200k, 77.8% for AGIs over 200k)
Averages for the 2004 tax year for zip code 01062, filed in 2005:
Average Adjusted Gross Income (AGI) in 2004: $48,738 (Individual Income Tax Returns)
Here:
$48,738
State:
$62,877
Salary/wage: $43,833 (reported on 82.9% of returns)
Here:
$43,833
State:
$52,969
(% of AGI for various income ranges: 93.2% for AGIs below $10k, 71.4% for AGIs $10k-25k, 78.4% for AGIs $25k-50k, 79.7% for AGIs $50k-75k, 80.8% for AGIs $75k-100k, 67.1% for AGIs over 100k)
Taxable interest for individuals: $1,123 (reported on 61.1% of returns)
This zip code:
$1,123
Massachusetts:
$1,945
(% of AGI for various income ranges: 6.2% for AGIs below $10k, 2.2% for AGIs $10k-25k, 1.4% for AGIs $25k-50k, 1.2% for AGIs $50k-75k, 0.8% for AGIs $75k-100k, 1.4% for AGIs over 100k)
Taxable dividends: $2,497 (reported on 32.8% of returns)
Here:
$2,497
State:
$5,323
(% of AGI for various income ranges: 6.9% for AGIs below $10k, 1.8% for AGIs $10k-25k, 1.1% for AGIs $25k-50k, 1.3% for AGIs $50k-75k, 1.1% for AGIs $75k-100k, 2.2% for AGIs over 100k)
Net capital gain/loss: +$9,110 (reported on 25.0% of returns)
Here:
+$9,110
State:
+$20,377
(% of AGI for various income ranges: -4.0% for AGIs below $10k, 1.4% for AGIs $10k-25k, 0.9% for AGIs $25k-50k, 1.1% for AGIs $50k-75k, 1.9% for AGIs $75k-100k, 10.7% for AGIs over 100k)
Profit/loss from business: +$16,218 (reported on 20.0% of returns)
Here:
+$16,218
State:
+$17,837
(% of AGI for various income ranges: 8.2% for AGIs below $10k, 7.3% for AGIs $10k-25k, 5.7% for AGIs $25k-50k, 5.4% for AGIs $50k-75k, 4.8% for AGIs $75k-100k, 8.4% for AGIs over 100k)
IRA payment deduction: $3,042 (reported on 3.9% of returns)
01062:
$3,042
Massachusetts:
$3,100
(% of AGI for various income ranges: 0.5% for AGIs $10k-25k, 0.5% for AGIs $25k-50k, 0.3% for AGIs $50k-75k, 0.2% for AGIs $75k-100k, 0.1% for AGIs over 100k)
Self-employed pension: $13,190 (reported on 2.3% of returns)
Here:
$13,190
Massachusetts:
$14,516
(% of AGI for various income ranges: 0.3% for AGIs $25k-50k, 0.3% for AGIs $50k-75k, 0.2% for AGIs $75k-100k, 1.2% for AGIs over 100k)
Total itemized deductions: $16,894 (20% of AGI, reported on 39.5% of returns)
Here:
$16,894
State:
$22,573
Here:
20.2% of AGI
State:
19.5% of AGI
(% of AGI for various income ranges: 16.0% for AGIs below $10k, 10.6% for AGIs $10k-25k, 11.8% for AGIs $25k-50k, 14.9% for AGIs $50k-75k, 15.7% for AGIs $75k-100k, 13.7% for AGIs over 100k)
Charity contributions deductions: $1,984 (2% of AGI, reported on 35.5% of returns)
Here:
$1,984
State:
$3,295
Here:
2.3% of AGI
State:
2.7% of AGI
(% of AGI for various income ranges: 1.0% for AGIs below $10k, 0.7% for AGIs $10k-25k, 0.8% for AGIs $25k-50k, 1.3% for AGIs $50k-75k, 1.5% for AGIs $75k-100k, 2.0% for AGIs over 100k)
Total tax: $7,342 (reported on 81.1% of returns)
01062:
$7,342
State:
$11,494
(% of AGI for various income ranges: 3.1% for AGIs below $10k, 5.3% for AGIs $10k-25k, 8.3% for AGIs $25k-50k, 9.5% for AGIs $50k-75k, 10.9% for AGIs $75k-100k, 17.9% for AGIs over 100k)
Earned income credit: $1,274 (reported on 9.7% of returns)
Here:
$1,274
State:
$1,518
Percentage of individuals using paid preparers for their 2004 taxes: 58.8%
Here:
59%
State:
58%
(% for various income ranges: 51.2% for AGIs below $10k, 54.7% for AGIs $10k-25k, 57.6% for AGIs $25k-50k, 63.2% for AGIs $50k-75k, 63.9% for AGIs $75k-100k, 73.1% for AGIs over 100k)
Likely homosexual households (counted as self-reported same-sex unmarried-partner households)
Lesbian couples: 1.4% of all households
Gay men: 0.0% of all households
Household received Food Stamps/SNAP in the past 12 months: 608 Household did not receive Food Stamps/SNAP in the past 12 months: 3,647
Women who had a birth in the past 12 months: 97 (94 now married, 6 unmarried) Women who did not have a birth in the past 12 months: 1,729 (693 now married, 1,032 unmarried)
Housing units in zip code 01062 with a mortgage: 2,008 (249 second mortgage, 231 both second mortgage and home equity loan) Houses without a mortgage: 191
Median monthly owner costs for units with a mortgage: $2,048 Median monthly owner costs for units without a mortgage: $841
Residents with income below the poverty level in 2022:
This zip code:
10.6%
Whole state:
10.4%
Residents with income below 50% of the poverty level in 2022:
This zip code:
7.3%
Whole state:
5.1%
Median number of rooms in houses and condos:
Here:
6.5
State:
6.5
Median number of rooms in apartments:
Here:
3.9
State:
4.0
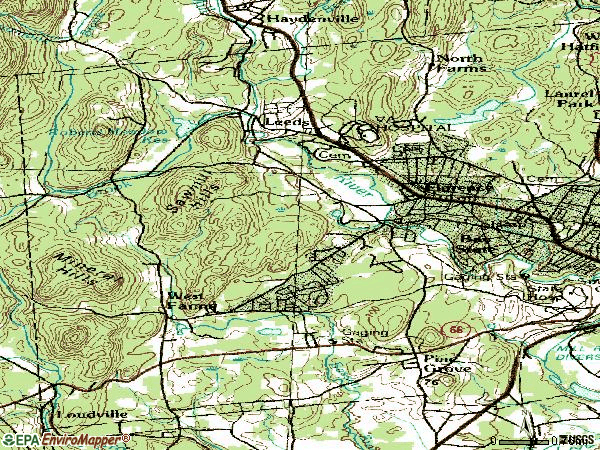
Notable locations in this zip code not listed on our city pages
Notable locations in zip code 01062: Florence Plaza (A), Pine Grove Golf Course (B), Northampton Fire Department Station 2 Florence Station (C), Lilly Library (D). Display/hide their locations on the map
Churches in zip code 01062 include: Seventh Day Adventist Church (A), Florence Congregational Church (B), Cornerstone Chapel (C). Display/hide their locations on the map
Cemeteries: Peter and Paul Russian Orthodox Cemetery (1), West Farms Cemetery (2), Spring Grove Cemetery (3), Park Street Cemetery (4). Display/hide their locations on the map
Lakes and reservoirs: Florence Pond (A), Clear Falls Pond (B), Rocky Hill Pond (C), Mill River Reservoir (D), Upper Reservoir (E). Display/hide their locations on the map
In group quarters: 355 (-1 institutionalized population)
Size of family households: 1,133 2-persons, 589 3-persons, 517 4-persons, 62 5-persons, 37 6-persons, 36 7-or-more-persons
Size of nonfamily households: 1,487 1-person, 328 2-persons, 77 3-persons
1,208 married couples with children.
417 single-parent households (141 men, 276 women).
86.7% of residents of 01062 zip code speak English at home.
8.3% of residents speak Spanish at home (51% very well, 13% well, 25% not well, 12% not at all).
4.1% of residents speak other Indo-European language at home (80% very well, 12% well, 7% not well).
0.8% of residents speak Asian or Pacific Island language at home (88% very well, 12% well).
0.1% of residents speak other language at home (100% very well).
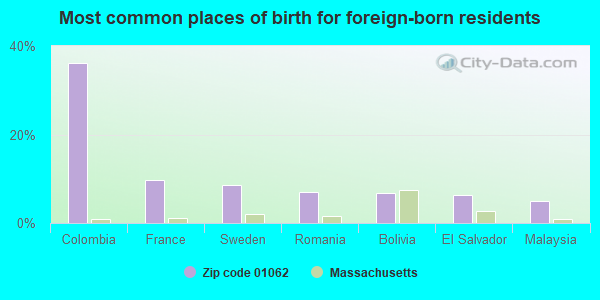
Foreign born population: 679 (7.2%) (41.1% of them are naturalized citizens)
This zip code:
7.2%
Whole state:
18.0%
36%Colombia
10%France
9%Sweden
7%Romania
7%Bolivia
6%El Salvador
5%Malaysia
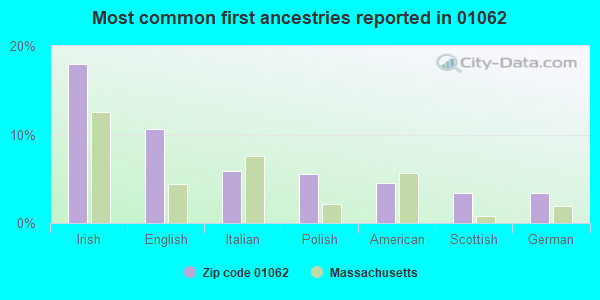
18%Irish
11%English
6%Italian
6%Polish
4%American
3%Scottish
3%German
Year of entry for the foreign-born population
2572010 or later
1492000 to 2009
2161990 to 1999
405Before 1990
Public elementary/middle schools in in zip code 01062 not listed on the city page:
Facilities with environmental interests located in this zip code:
JOHN F KENNEDY JR HIGH (100 BRIDGE RD in FLORENCE, MA)
(National Center for Education Statistics) - STATE ID-210410 Organizations: NORTHAMPTON (SCHOOL DISTRICT)
NORTHAMPTON LANDFILL (140 GLENDALE RD in FLORENCE, MA)
CRITERIA AND HAZARDOUS AIR POLLUTANT INVENTORY (Inventory of air pollution sources) Business SIC classification: REFUSE SYSTEMS Business NAICS classification: SOLID WASTE LANDFILL.
Housing units lacking complete plumbing facilities: 2.0% Housing units lacking complete kitchen facilities: 2.4%
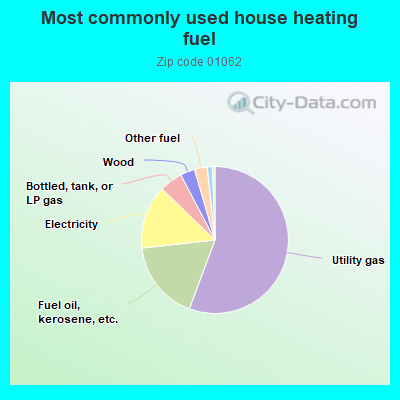
55.8%Utility gas
17.6%Fuel oil, kerosene, etc.
14.0%Electricity
5.1%Bottled, tank, or LP gas
3.2%Wood
2.8%Other fuel
1.2%Solar energy
Place of birth for U.S.-born residents:
This state: 5,352
Northeast: 1,797
Midwest: 410
South: 549
West: 338
63% of the 01062 zip code residents lived in the same house 5 years ago. Out of people who lived in different houses, 57% lived in this county. Out of people who lived in different counties, 50% lived in Massachusetts.
92% of the 01062 zip code residents lived in the same house 1 year ago. Out of people who lived in different houses, 48% moved from this county. Out of people who lived in different houses, 22% moved from different county within same state. Out of people who lived in different houses, 24% moved from different state. Out of people who lived in different houses, 6% moved from abroad.
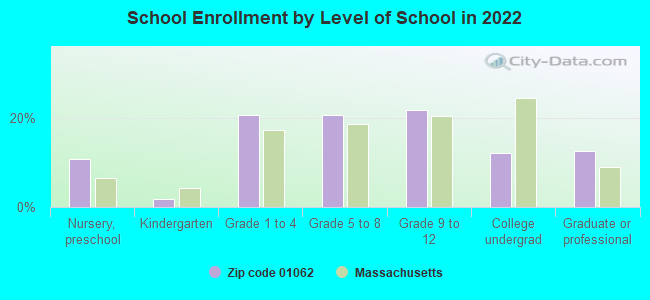
Private vs. public school enrollment:
Students in private schools in grades 1 to 8 (elementary and middle school): 64
Here:
7.6%
Massachusetts:
10.3%
Students in private schools in grades 9 to 12 (high school): 25
Here:
5.7%
Massachusetts:
12.3%
Students in private undergraduate colleges: 74
Here:
30.1%
Massachusetts:
51.2%
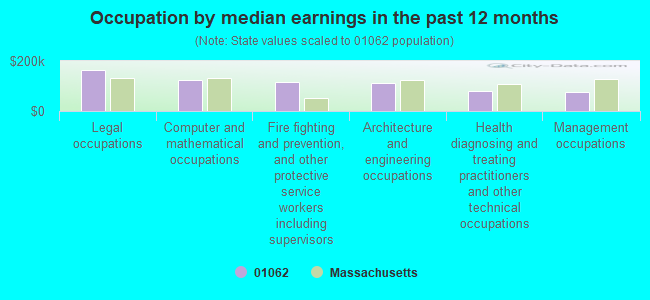
Occupation by median earnings in the past 12 months ($)
165,777Legal occupations
122,604Computer and mathematical occupations
116,691Fire fighting and prevention, and other protective service workers including supervisors
113,424Architecture and engineering occupations
80,291Health diagnosing and treating practitioners and other technical occupations
75,298Management occupations
Companies with federal contracts located in this zip code (FLORENCE, MA):
XFINIT, LTD (373 N FARMS RD; small business)
$69,572 with Army for Defense Missile and Space Systems -- Basic Research (R&D). Signed on 2002-05-03. Completion date: 2002-10-03.
NATIONAL WIRELESS INC (221 PINE ST STE 1G3; small business)
$67,496 with Navy for Defense Ships -- Basic Research (R&D). Signed on 2003-06-18. Completion date: 2003-12-18.
DR TERRENCE P DONNELLY (107 HILLCREST DR; small business) : $10,059 in 5 contractsfrom 2004 to 2005
Contracts for Optometry Services by Army Signed by year:2000: $0; 2001: $0; 2002: $0; 2003: $0; 2004: $10,059; 2005: $0; 2006: $0.
Biggest contracts:
$5,500 with Army for Optometry Services. Taking place in NH. Signed on 2005-10-01. Completion date: 2006-09-30.
$5,500, same as above.Signed on 2004-10-01. Completion date: 2005-09-30.
$3,908, same as above.Signed on 2004-01-22. Completion date: 2004-09-30.
$651, same as above.Signed on 2004-08-06. Completion date: 2004-09-30.
NORMANDEAU COMMUNICATIONS INC (30 N MAPLE ST; small business)
$9,407 with Army for Maintenance, Repair or Alteration of Real Property -- Miscellaneous Buildings. Signed on 2005-05-27. Completion date: 2005-07-29.
Top industries in this zip code by the number of employees in 2005:
2002 - 2018 National Fire Incident Reporting System (NFIRS) incidents
According to the data from the years 2002 - 2018 the average number of fire incidents per year is 27. The highest number of reported fire incidents - 45 took place in 2006, and the least - 12 in 2018. The data has a declining trend.
When looking into fire subcategories, the most incidents belonged to: Structure Fires (52.2%), and Outside Fires (32.4%).
Fire incident types reported to NFIRS in Zip Code 01062


 Nearest zip codes: 01053, 01027, 01063, 01060, 01039, 01088.
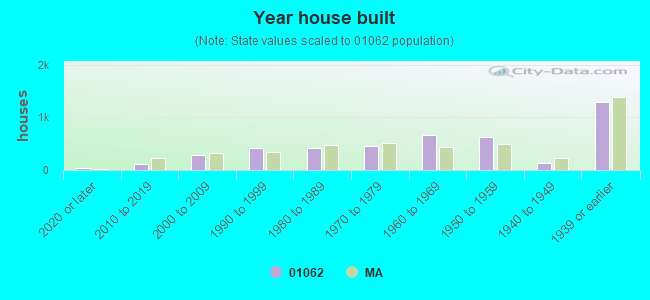


 (Students: 675, Location: 100 BRIDGE RD, Grades: 6-8)
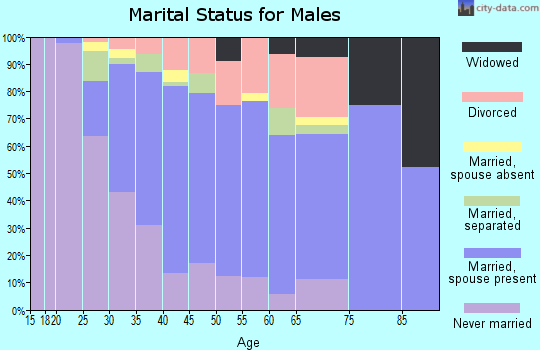
 According to the data from the years 2002 - 2018 the average number of fire incidents per year is 27. The highest number of reported fire incidents - 45 took place in 2006, and the least - 12 in 2018. The data has a declining trend.
 When looking into fire subcategories, the most incidents belonged to: Structure Fires (52.2%), and Outside Fires (32.4%).