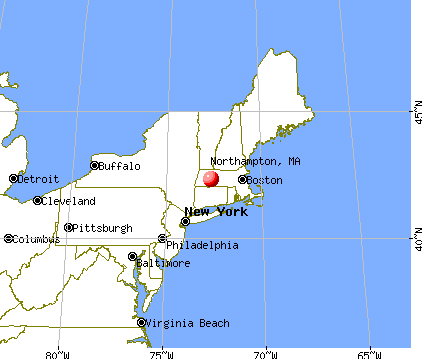
Northampton, Massachusetts
Northampton: Northampton Municipal

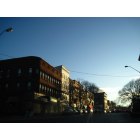
Northampton: Sunny during Winter 2007, Main St., Northampton, MA
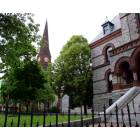
Northampton: Northampton Museum
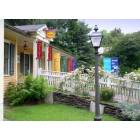
Northampton: Northampton Bliss
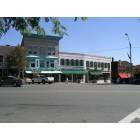
Northampton: Downtown
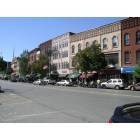
Northampton: Downtown
Northampton
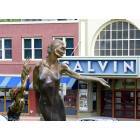
Northampton: Northampton Art

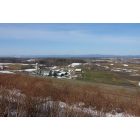
Northampton: Northampton MA Autumn
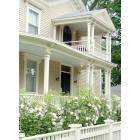
Northampton: Northampton
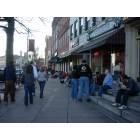
Northampton: Enjoying the weather, Main St., Northampton, MA
- see
14
more - add
your
Submit your own pictures of this city and show them to the world
- OSM Map
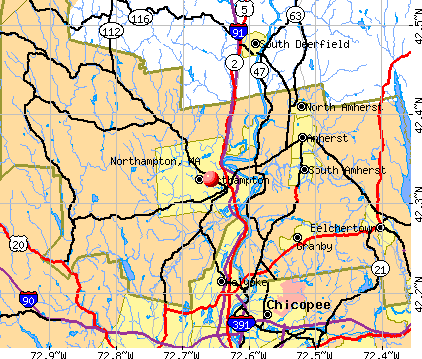
- General Map
- Google Map
- MSN Map
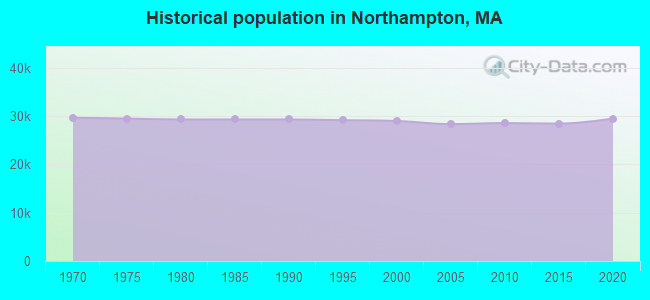
Population change since 2000: +1.2%
 |
| Males: 12,646 | |
| Females: 16,681 |
| Median resident age: | 40.3 years |
| Massachusetts median age: | 40.3 years |
Zip codes: 01053, 01060, 01062, 01063.
Northampton Zip Code Map| Northampton: | $79,105 |
| MA: | $94,488 |
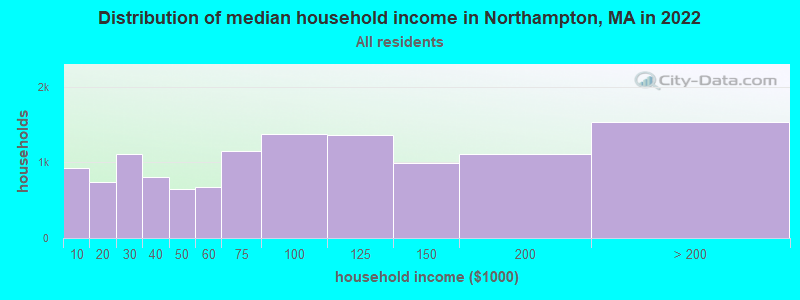
Estimated per capita income in 2022: $47,352 (it was $24,022 in 2000)
Northampton city income, earnings, and wages data
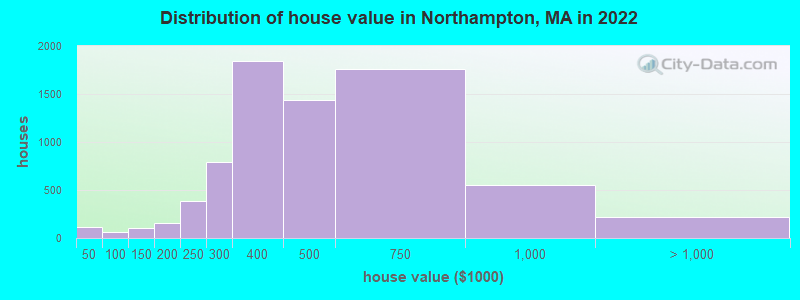
Estimated median house or condo value in 2022: $417,221 (it was $147,100 in 2000)
| Northampton: | $417,221 |
| MA: | $534,700 |
Mean prices in 2022: all housing units: $512,288; detached houses: $540,699; townhouses or other attached units: $397,291; in 2-unit structures: $467,814; in 3-to-4-unit structures: $632,796; in 5-or-more-unit structures: $299,348
Median gross rent in 2022: $1,408.
(10.4% for White Non-Hispanic residents, 29.8% for Black residents, 13.9% for Hispanic or Latino residents, 45.7% for American Indian residents, 22.7% for other race residents, 10.7% for two or more races residents)
Detailed information about poverty and poor residents in Northampton, MA


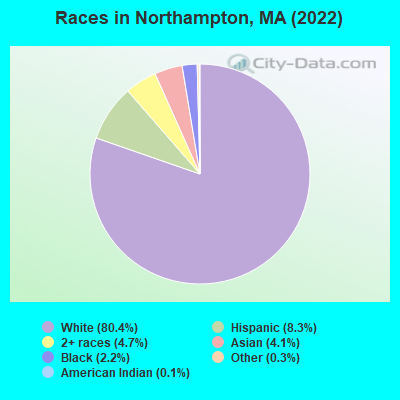
- 23,99480.4%White alone
- 2,4828.3%Hispanic
- 1,4144.7%Two or more races
- 1,2314.1%Asian alone
- 6672.2%Black alone
- 1030.3%Other race alone
- 370.1%American Indian alone
Races in Northampton detailed stats: ancestries, foreign born residents, place of birth
According to our research of Massachusetts and other state lists, there were 10 registered sex offenders living in Northampton, Massachusetts as of April 27, 2024.
The ratio of all residents to sex offenders in Northampton is 2,867 to 1.
The ratio of registered sex offenders to all residents in this city is lower than the state average.
Type |
2009 |
2010 |
2011 |
2012 |
2013 |
2014 |
2015 |
2016 |
2017 |
2018 |
2019 |
2020 |
2021 |
2022 |
|---|---|---|---|---|---|---|---|---|---|---|---|---|---|---|
| Murders (per 100,000) | 3 (10.4) | 2 (7.0) | 0 (0.0) | 0 (0.0) | 0 (0.0) | 0 (0.0) | 0 (0.0) | 0 (0.0) | 0 (0.0) | 1 (3.5) | 1 (3.5) | 0 (0.0) | 1 (3.5) | 1 (3.4) |
| Rapes (per 100,000) | 19 (65.7) | 5 (17.5) | 13 (45.3) | 8 (27.8) | 28 (98.0) | 20 (70.3) | 21 (73.6) | 19 (66.6) | 30 (105.4) | 24 (84.0) | 25 (87.0) | 13 (45.7) | 22 (77.7) | 23 (78.9) |
| Robberies (per 100,000) | 10 (34.6) | 7 (24.5) | 10 (34.8) | 16 (55.6) | 15 (52.5) | 19 (66.7) | 13 (45.6) | 13 (45.6) | 21 (73.8) | 7 (24.5) | 9 (31.3) | 10 (35.2) | 9 (31.8) | 5 (17.2) |
| Assaults (per 100,000) | 64 (221.3) | 91 (318.8) | 79 (275.0) | 90 (313.0) | 87 (304.4) | 93 (326.7) | 92 (322.4) | 93 (326.1) | 114 (400.6) | 81 (283.3) | 83 (288.8) | 69 (242.7) | 82 (289.4) | 85 (291.6) |
| Burglaries (per 100,000) | 146 (504.8) | 189 (662.0) | 152 (529.2) | 137 (476.4) | 126 (440.9) | 144 (505.9) | 87 (304.9) | 84 (294.5) | 75 (263.5) | 108 (377.8) | 53 (184.4) | 50 (175.9) | 42 (148.2) | 37 (126.9) |
| Thefts (per 100,000) | 670 (2,317) | 608 (2,130) | 611 (2,127) | 697 (2,424) | 649 (2,271) | 534 (1,876) | 527 (1,847) | 507 (1,778) | 465 (1,634) | 416 (1,455) | 376 (1,309) | 402 (1,414) | 333 (1,175) | 308 (1,057) |
| Auto thefts (per 100,000) | 29 (100.3) | 43 (150.6) | 21 (73.1) | 25 (86.9) | 27 (94.5) | 15 (52.7) | 21 (73.6) | 11 (38.6) | 14 (49.2) | 17 (59.5) | 20 (69.6) | 16 (56.3) | 17 (60.0) | 18 (61.7) |
| Arson (per 100,000) | 24 (83.0) | 2 (7.0) | 1 (3.5) | 5 (17.4) | 4 (14.0) | 4 (14.1) | 7 (24.5) | 7 (24.5) | 3 (10.5) | 1 (3.5) | 8 (27.8) | 5 (17.6) | 3 (10.6) | 3 (10.3) |
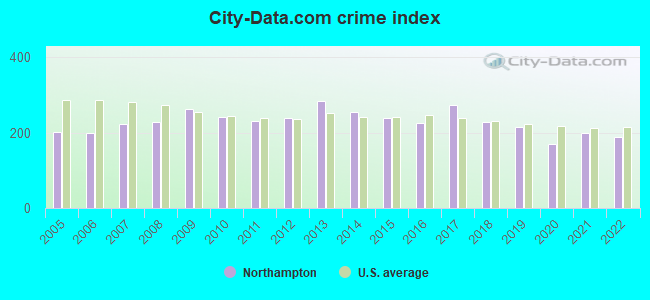
| City-Data.com crime index | 264.0 | 242.7 | 229.6 | 238.8 | 284.2 | 256.2 | 238.1 | 227.0 | 274.3 | 227.6 | 214.5 | 169.1 | 198.8 | 189.5 |
The City-Data.com crime index weighs serious crimes and violent crimes more heavily. Higher means more crime, U.S. average is 246.1. It adjusts for the number of visitors and daily workers commuting into cities.
Crime rate in Northampton detailed stats: murders, rapes, robberies, assaults, burglaries, thefts, arson
Full-time law enforcement employees in 2021, including police officers: 67 (60 officers - 50 male; 10 female).
| Officers per 1,000 residents here: | 2.12 |
| Massachusetts average: | 2.53 |
 Recent articles from our blog. Our writers, many of them Ph.D. graduates or candidates, create easy-to-read articles on a wide variety of topics.

 | Looking for feedback or ideas on our move to Northampton area (23 replies) |
| So how *do* grad students find housing around Northampton??? (13 replies) |
| Rentals in Northampton (3 replies) |
| Job Situation in Northampton area for older person (4 replies) |
| Oklahoma to (likely Western) Massachusetts - Beginning Research (274 replies) |
| Winter Commute to Northampton (24 replies) |
Latest news from Northampton, MA collected exclusively by city-data.com from local newspapers, TV, and radio stations
Northampton, MA City Guides:
Ancestries: English (11.0%), Irish (10.9%), American (6.2%), European (6.0%), Polish (5.5%), Italian (5.4%).
Current Local Time: EST time zone
Elevation: 140 feet
Land area: 34.5 square miles.
Population density: 851 people per square mile (low).
2,671 residents are foreign born (2.8% Asia, 2.8% Latin America, 2.7% Europe).
| This city: | 9.0% |
| Massachusetts: | 17.6% |
Median real estate property taxes paid for housing units with mortgages in 2022: $5,444 (1.3%)
Median real estate property taxes paid for housing units with no mortgage in 2022: $5,768 (1.5%)
Nearest city with pop. 50,000+: Chicopee, MA  (11.4 miles , pop. 54,653).
Nearest city with pop. 200,000+: Boston, MA (80.2 miles , pop. 589,141).
Nearest city with pop. 1,000,000+: Bronx, NY (120.2 miles , pop. 1,332,650).
Nearest cities:
), ), ), Latitude: 42.33 N, Longitude: 72.66 W
Daytime population change due to commuting: +5,891 (+19.7%)
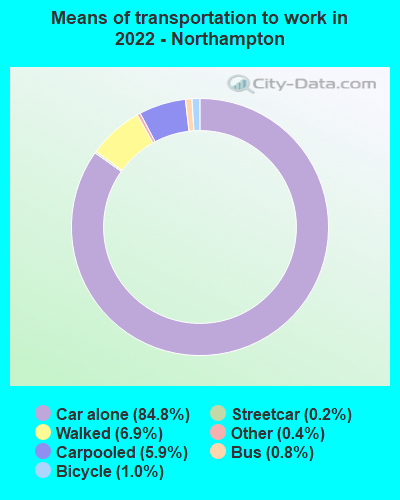
Workers who live and work in this city: 7,749 (52.1%)
Area code: 413
Northampton tourist attractions:
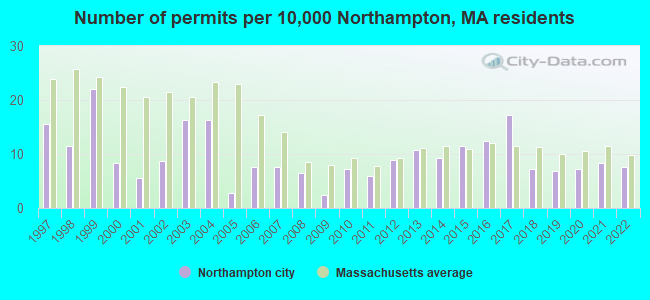
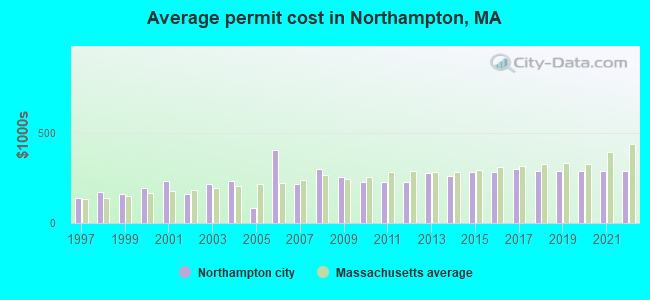
Single-family new house construction building permits:
- 2022: 22 buildings, average cost: $285,800
- 2021: 24 buildings, average cost: $285,800
- 2020: 21 buildings, average cost: $285,800
- 2019: 20 buildings, average cost: $285,800
- 2018: 21 buildings, average cost: $285,800
- 2017: 50 buildings, average cost: $297,000
- 2016: 36 buildings, average cost: $282,300
- 2015: 33 buildings, average cost: $282,300
- 2014: 27 buildings, average cost: $261,000
- 2013: 31 buildings, average cost: $273,600
- 2012: 26 buildings, average cost: $224,900
- 2011: 17 buildings, average cost: $228,700
- 2010: 21 buildings, average cost: $225,800
- 2009: 7 buildings, average cost: $252,100
- 2008: 19 buildings, average cost: $298,900
- 2007: 22 buildings, average cost: $218,000
- 2006: 22 buildings, average cost: $402,400
- 2005: 8 buildings, average cost: $81,500
- 2004: 47 buildings, average cost: $229,600
- 2003: 47 buildings, average cost: $217,700
- 2002: 25 buildings, average cost: $161,700
- 2001: 16 buildings, average cost: $235,300
- 2000: 24 buildings, average cost: $196,400
- 1999: 64 buildings, average cost: $158,200
- 1998: 33 buildings, average cost: $169,800
- 1997: 45 buildings, average cost: $137,200
| Here: | 2.7% |
| Massachusetts: | 3.5% |
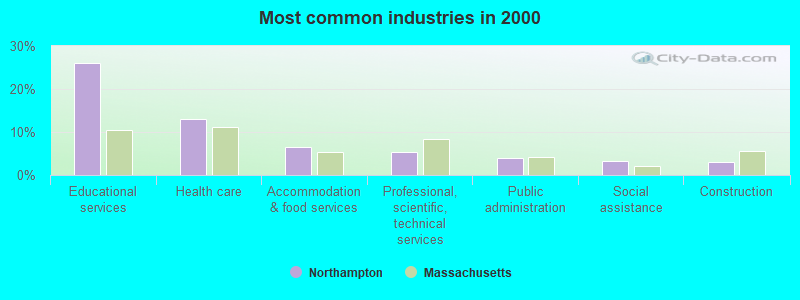
- Educational services (26.2%)
- Health care (13.1%)
- Accommodation & food services (6.4%)
- Professional, scientific, technical services (5.3%)
- Public administration (4.1%)
- Social assistance (3.4%)
- Construction (3.1%)
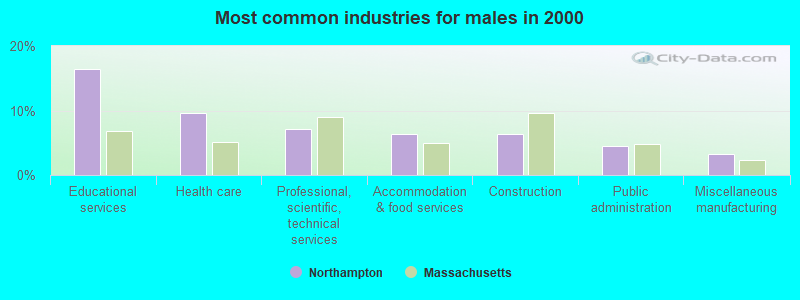
- Educational services (16.4%)
- Health care (9.6%)
- Professional, scientific, technical services (7.1%)
- Accommodation & food services (6.4%)
- Construction (6.3%)
- Public administration (4.5%)
- Miscellaneous manufacturing (3.2%)
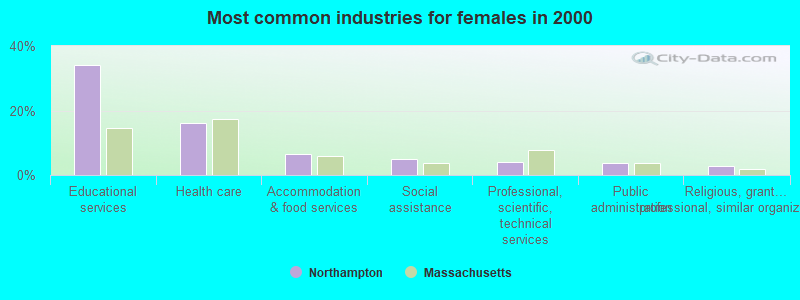
- Educational services (34.1%)
- Health care (16.0%)
- Accommodation & food services (6.4%)
- Social assistance (5.1%)
- Professional, scientific, technical services (3.9%)
- Public administration (3.7%)
- Religious, grantmaking, civic, professional, similar organizations (2.7%)
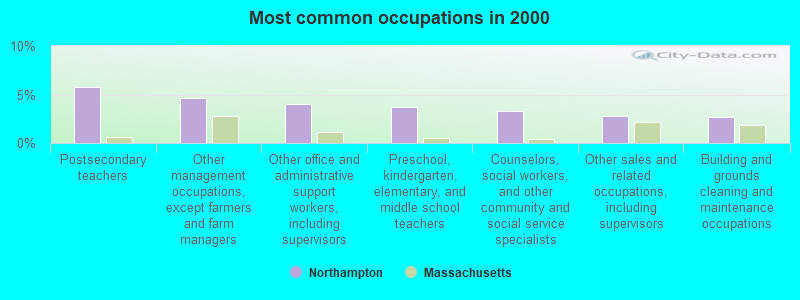
- Postsecondary teachers (5.8%)
- Other management occupations, except farmers and farm managers (4.6%)
- Other office and administrative support workers, including supervisors (4.1%)
- Preschool, kindergarten, elementary, and middle school teachers (3.7%)
- Counselors, social workers, and other community and social service specialists (3.3%)
- Other sales and related occupations, including supervisors (2.8%)
- Building and grounds cleaning and maintenance occupations (2.7%)
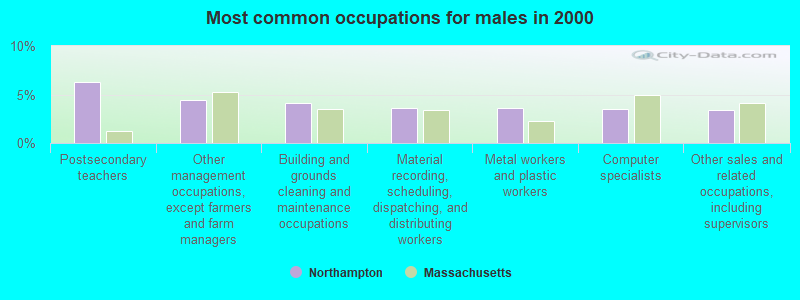
- Postsecondary teachers (6.3%)
- Other management occupations, except farmers and farm managers (4.4%)
- Building and grounds cleaning and maintenance occupations (4.1%)
- Material recording, scheduling, dispatching, and distributing workers (3.6%)
- Metal workers and plastic workers (3.6%)
- Computer specialists (3.5%)
- Other sales and related occupations, including supervisors (3.4%)
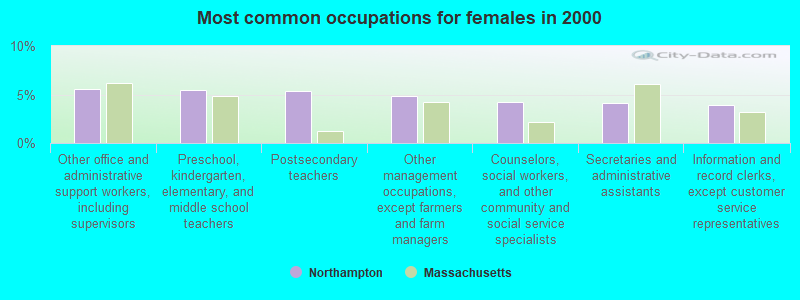
- Other office and administrative support workers, including supervisors (5.6%)
- Preschool, kindergarten, elementary, and middle school teachers (5.5%)
- Postsecondary teachers (5.4%)
- Other management occupations, except farmers and farm managers (4.8%)
- Counselors, social workers, and other community and social service specialists (4.2%)
- Secretaries and administrative assistants (4.1%)
- Information and record clerks, except customer service representatives (3.9%)
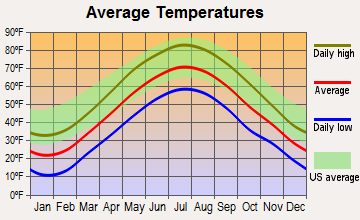
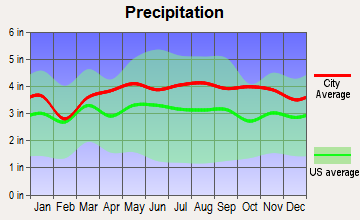
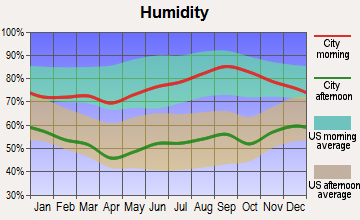
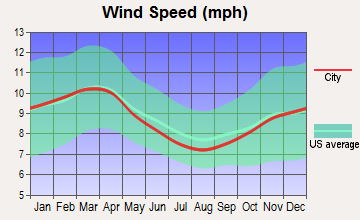
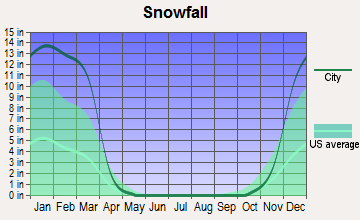
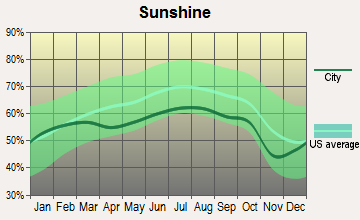
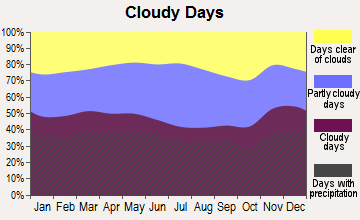
Average climate in Northampton, Massachusetts
Based on data reported by over 4,000 weather stations
|
|


(lower is better)
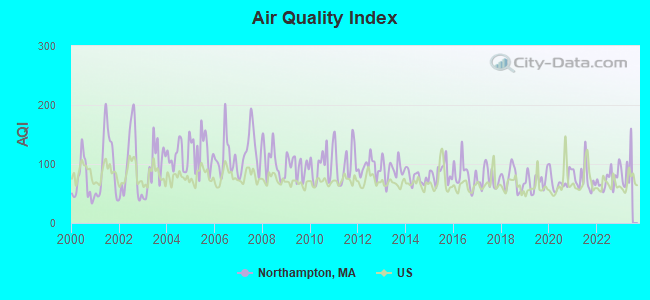
Air Quality Index (AQI) level in 2022 was 74.4. This is about average.
| City: | 74.4 |
| U.S.: | 72.6 |
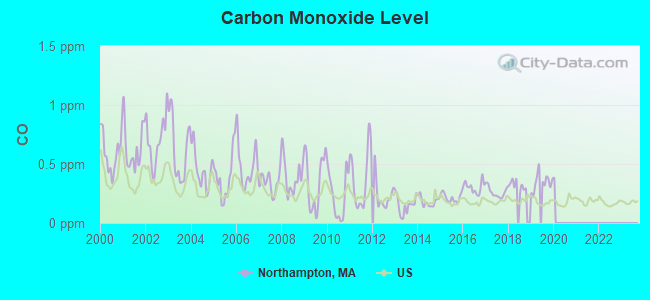
Carbon Monoxide (CO) [ppm] level in 2019 was 0.346. This is worse than average. Closest monitor was 10.0 miles away from the city center.
| City: | 0.346 |
| U.S.: | 0.251 |
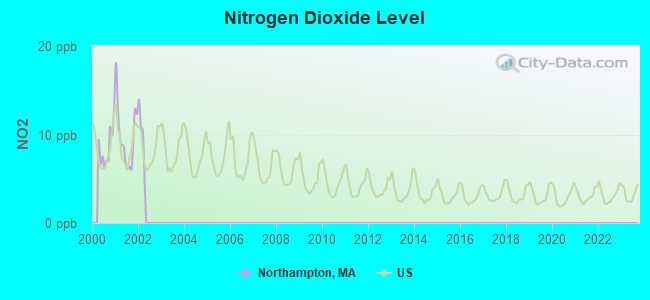
Nitrogen Dioxide (NO2) [ppb] level in 2001 was 9.83. This is significantly worse than average. Closest monitor was 9.6 miles away from the city center.
| City: | 9.83 |
| U.S.: | 5.11 |
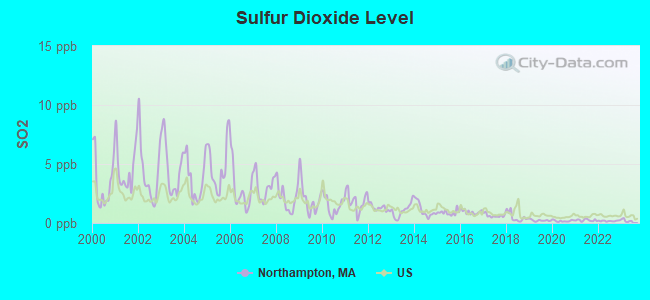
Sulfur Dioxide (SO2) [ppb] level in 2022 was 0.175. This is significantly better than average. Closest monitor was 3.5 miles away from the city center.
| City: | 0.175 |
| U.S.: | 1.515 |
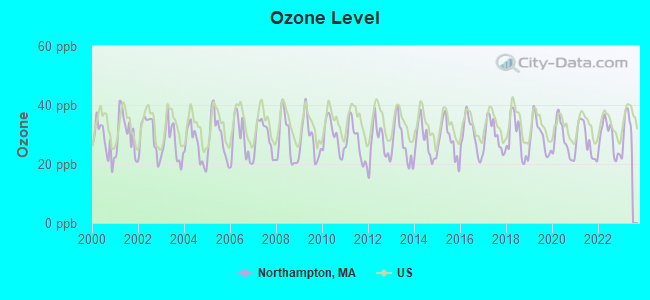
Ozone [ppb] level in 2022 was 28.8. This is about average. Closest monitor was 8.1 miles away from the city center.
| City: | 28.8 |
| U.S.: | 33.3 |
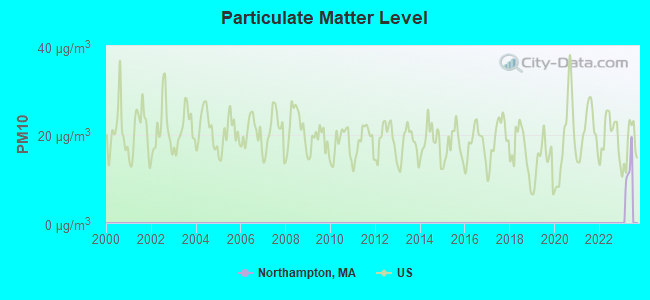
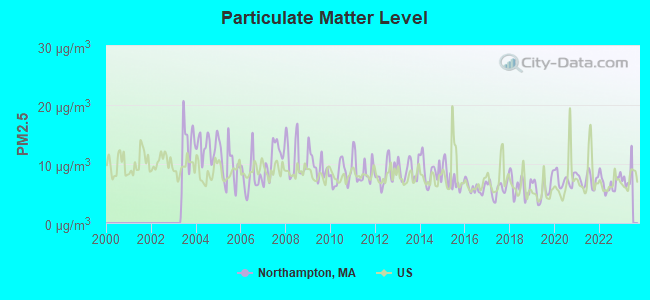
Particulate Matter (PM2.5) [µg/m3] level in 2022 was 6.76. This is about average. Closest monitor was 10.6 miles away from the city center.
| City: | 6.76 |
| U.S.: | 8.11 |
Tornado activity:
Northampton-area historical tornado activity is above Massachusetts state average. It is 8% smaller than the overall U.S. average.
On 10/3/1979, a category F4 (max. wind speeds 207-260 mph) tornado 19.3 miles away from the Northampton city center killed 3 people and injured 500 people and caused between $50,000,000 and $500,000,000 in damages.
On 9/13/1971, a category F3 (max. wind speeds 158-206 mph) tornado 0.7 miles away from the city center caused between $5000 and $50,000 in damages.
Earthquake activity:
Northampton-area historical earthquake activity is significantly above Massachusetts state average. It is 70% smaller than the overall U.S. average.On 10/7/1983 at 10:18:46, a magnitude 5.3 (5.1 MB, 5.3 LG, 5.1 ML, Class: Moderate, Intensity: VI - VII) earthquake occurred 141.0 miles away from Northampton center
On 4/20/2002 at 10:50:47, a magnitude 5.3 (5.3 ML, Depth: 3.0 mi) earthquake occurred 159.9 miles away from Northampton center
On 4/20/2002 at 10:50:47, a magnitude 5.2 (5.2 MB, 4.2 MS, 5.2 MW, 5.0 MW) earthquake occurred 158.6 miles away from the city center
On 1/19/1982 at 00:14:42, a magnitude 4.7 (4.5 MB, 4.7 MD, 4.5 LG, Class: Light, Intensity: IV - V) earthquake occurred 97.2 miles away from Northampton center
On 10/16/2012 at 23:12:25, a magnitude 4.7 (4.7 ML, Depth: 10.0 mi) earthquake occurred 134.1 miles away from Northampton center
On 8/23/2011 at 17:51:04, a magnitude 5.8 (5.8 MW, Depth: 3.7 mi) earthquake occurred 413.7 miles away from Northampton center
Magnitude types: regional Lg-wave magnitude (LG), body-wave magnitude (MB), duration magnitude (MD), local magnitude (ML), surface-wave magnitude (MS), moment magnitude (MW)
Natural disasters:
The number of natural disasters in Hampshire County (21) is greater than the US average (15).Major Disasters (Presidential) Declared: 10
Emergencies Declared: 10
Causes of natural disasters: Floods: 5, Snowstorms: 5, Storms: 5, Hurricanes: 4, Winter Storms: 4, Blizzards: 2, Snows: 2, Snowfall: 1, Tropical Storm: 1, Wind: 1, Other: 1 (Note: some incidents may be assigned to more than one category).

Hospitals and medical centers in Northampton:
- COOLEY DICKINSON HOSPITAL INC,THE (Voluntary non-profit - Private, provides emergency services, 30 LOCUST STREET)
- CALVIN COOLIDGE NURING AND REHAB CTR - NORTHAMPTON (548 ELM STREET)
- NORTHAMPTON REHABILITATION AND NURSING CENTER (737 BRIDGE ROAD)
- PINE REST NURSING HOME (5 FRANKLIN ST)
- HAMPSHIRE COUNTY DIALYSIS CENTER (84 CONZ STREET)
- SERVICENET HOMECARE (216 NORTH KING STREET)
- VNA AND HOSPICE OF COOLEY DICKINSON (168 INDUSTRIAL DRIVE)
- VNA OF HAMPSHIRE COUNTY, INC (243 KING STREET)
Airports located in Northampton:
- Northampton Airport (7B2) (Runways: 1, Air Taxi Ops: 156, Itinerant Ops: 1,000, Local Ops: 29,000, Military Ops: 400)
Amtrak stations near Northampton:
- 9 miles: AMHERST (RAILROAD ST.) . Services: enclosed waiting area, public payphones, free short-term parking, paid long-term parking, call for car rental service, call for taxi service, public transit connection.
- 16 miles: SPRINGFIELD (66 LYMAN ST.) . Services: ticket office, partially wheelchair accessible, enclosed waiting area, public restrooms, public payphones, full-service food facilities, snack bar, vending machines, ATM, paid short-term parking, paid long-term parking, call for car rental service, taxi stand, intercity bus service, public transit connection.
College/University in Northampton:
Other colleges/universities with over 2000 students near Northampton:
- Mount Holyoke College (about 7 miles; South Hadley, MA; Full-time enrollment: 2,573)
- University of Massachusetts-Amherst (about 8 miles; Amherst, MA; FT enrollment: 26,583)
- Holyoke Community College (about 10 miles; Holyoke, MA; FT enrollment: 4,911)
- Westfield State University (about 16 miles; Westfield, MA; FT enrollment: 5,548)
- Springfield Technical Community College (about 16 miles; Springfield, MA; FT enrollment: 4,750)
- American International College (about 16 miles; Springfield, MA; FT enrollment: 2,733)
- Springfield College (about 17 miles; Springfield, MA; FT enrollment: 3,144)
Public high schools in Northampton:
- NORTHAMPTON HIGH (Students: 887, Location: 380 ELM STREET, Grades: 9-12)
- SMITH VOCATIONAL AND AGRICULTURAL HIGH (Location: 80 LOCUST STREET, Grades: 9-12)
Private high school in Northampton:
Public elementary/middle schools in Northampton:
- JACKSON STREET (Students: 408, Location: 120 JACKSON STREET, Grades: KG-5)
- BRIDGE STREET (Students: 287, Location: 2 PARSONS STREET, Grades: PK-5)
Private elementary/middle schools in Northampton:
User-submitted facts and corrections:
- Additional Schools in Northampton. NOTE:Leeds and Florence are simply sections of the City of Northampton. Public Primary/Elementary Schools: Northampton School Superintendant 413-587-1451 for data. Leeds Elementary School, 20 Florence St R.K. Finn Ryan Road School, 498 Ryan Road JFK Middle School 100 Bridge Road Private Primary/Elementary Schools Solomon Schechter Day School of the Pioneer Valley, 257 Prospect Street (413-584-6622 for data)
Points of interest:
Notable locations in Northampton: Sheldon Field (A), Northampton Country Club (B), Hamp Plaza (C), Florence Plaza (D), Hampshire County Fairgrounds (E), Northampton Industrial Park (F), Pine Grove Golf Course (G), John M Greene Hall (H), Lily Hall (I), Lyman Point House (J), Mason Infirmary (K), McConnell Hall (L), Mendenhall Center (M), Northampton Center for the Arts (N), Northampton Chamber of Commerce (O), Northampton City Hall (P), Northampton Historical Society Building (Q), Pierce Hall (R), Presidents House (S), Richard H Dolloff Medical Library (T). Display/hide their locations on the map
Shopping Centers: Potpourri Shopping Center (1), Kingsgate Mall (2), Hill and Dale Mall (3), Florence Plaza Shopping Center (4), Hill and Dale Mall Shopping Center (5), Kingsgate Plaza Shopping Center (6), Northampton Place Shopping Center (7), Thornes Market Place Shopping Center (8). Display/hide their locations on the map
Churches in Northampton include: Seventh Day Adventist Church (A), Saint Johns Episcopal Church (B), Kingdom Hall of Jehovahs Witnesses (C), Helen Hills Chapel (D), Florence Congregational Church (E), First Church United Church of Christ (F), First Church of Christ Scientist (G), Cornerstone Chapel (H), College Church (I). Display/hide their locations on the map
Cemeteries: Peter and Paul Russian Orthodox Cemetery (1), West Farms Cemetery (2), Spring Grove Cemetery (3), Saint Marys Cemetery (4), Park Street Cemetery (5), Saint Marys Cemetery (6), Bridge Street Cemetery (7). Display/hide their locations on the map
Lakes, reservoirs, and swamps: The Oxbow (A), Florence Pond (B), Danks Pond (C), Clear Falls Pond (D), Paradise Pond (E), Roberts Meadow Reservoir (F), Rocky Hill Pond (G), Mill River Diversion Reservoir (H). Display/hide their locations on the map
Streams, rivers, and creeks: Marble Brook (A), Roberts Meadow Brook (B), Mill River (C), Turkey Brook (D), Day Brook (E), Clark Brook (F), Beaver Brook (G), Parsons Brook (H). Display/hide their locations on the map
Parks in Northampton include: Childs Park (1), Look Memorial Park (2), Arcadia Sanctuary (3), Maines Field (4), Childs Park (5), Northampton Downtown Historic District (6), Kearney Field (7), Japanese Garden and Tea Hut (8), Fort Hill Historic District (9). Display/hide their locations on the map
Tourist attractions: ScienceNet Productions (Nature Centers; 6 Ahwaga Avenue 5) (1), Northampton Historical Society (46 Bridge Street) (2). Display/hide their approximate locations on the map
Hotels: Hotel Northampton (36 King St) (1), Best Western Valley Inn Stes (117 Conz Street) (2), Montana's Steakhouse (1 Atwood Drive) (3), Clarion Hotel (1 Atwood Drive) (4). Display/hide their approximate locations on the map
Courts: Mass Commonwealth - Courts- Superior Court- Probation Office (15 Gothic Street) (1), Mass Commonwealth - Courts- Superior Court- Jury Pool (15 Gothic Street) (2), Mass Commonwealth - Courts- Superior Court- Clerk (15 Gothic Street) (3), Mass Commonwealth - Courts- Probate And Family Court- Probation (33 King Street) (4), Mass Commonwealth - Courts- Northampton District Court- Probation Of (15 Gothic Street) (5), Mass Commonwealth - Courts- Northampton District Court- Jury Of Six (15 Gothic Street) (6), Mass Commonwealth - Courts- Northampton District Court- Clerk's Office (15 Gothic Street) (7), Mass Commonwealth - Courts- Probate And Family Court (33 King Street) (8), Mass Commonwealth - Courts- Northampton District Court- Small Claims (15 Gothic Street) (9). Display/hide their approximate locations on the map
Birthplace of: Dyer Lum - Labor leader, Timothy Dwight IV - Theologian, Benjamin Smith Lyman - Engineer, Benjamin Tappan - Politician, Caleb Strong - Massachusetts lawyer, Constance Mabel Winchell - Librarian, John Miles Foley - Literary scholar, Frank Philbrick - Writer, James M. Bower - Neuroscientist, Jeremy Arel - Brazilian Jiu Jitsu Black Belt.
Drinking water stations with addresses in Northampton and their reported violations in the past:
YMCA CAMP NORWICH (Address: 286 PROSPECT STREET , Population served: 150, Groundwater):Past monitoring violations:
- One regular monitoring violation
Drinking water stations with addresses in Northampton that have no violations reported:
- NORTHAMPTON WATER DEPT (Population served: 27,244, Primary Water Source Type: Surface water)
| This city: | 2.1 people |
| Massachusetts: | 2.5 people |
| This city: | 49.1% |
| Whole state: | 63.0% |
| This city: | 10.3% |
| Whole state: | 7.0% |
Likely homosexual households (counted as self-reported same-sex unmarried-partner households)
- Lesbian couples: 3.4% of all households
- Gay men: 0.7% of all households
People in group quarters in Northampton in 2010:
- 2,015 people in college/university student housing
- 527 people in nursing facilities/skilled-nursing facilities
- 249 people in local jails and other municipal confinement facilities
- 178 people in residential treatment centers for adults
- 67 people in other noninstitutional facilities
- 35 people in residential treatment centers for juveniles (non-correctional)
- 24 people in correctional facilities intended for juveniles
- 23 people in group homes intended for adults
- 17 people in emergency and transitional shelters (with sleeping facilities) for people experiencing homelessness
- 10 people in residential schools for people with disabilities
- 10 people in workers' group living quarters and job corps centers
People in group quarters in Northampton in 2000:
- 2,270 people in college dormitories (includes college quarters off campus)
- 675 people in nursing homes
- 245 people in local jails and other confinement facilities (including police lockups)
- 145 people in other noninstitutional group quarters
- 112 people in mental (psychiatric) hospitals or wards
- 58 people in wards in general hospitals for patients who have no usual home elsewhere
- 42 people in homes for the mentally ill
- 28 people in homes or halfway houses for drug/alcohol abuse
- 26 people in other group homes
Banks with branches in Northampton (2011 data):
- Florence Savings Bank: King Street Branch at 176 King Street, branch established on 1986/09/18; Northampton Branch at 58 Main Street, branch established on 1994/02/14. Info updated 2006/11/30: Bank assets: $1,088.0 mil, Deposits: $825.9 mil, headquarters in Florence, MA, positive income, Mortgage Lending Specialization, 10 total offices, Holding Company: Florence Bancorp, Mhc
- United Bank: Pleasant Branch at 491 Pleasant Street, branch established on 2008/09/15; Northampton Branch at 180 Main Street, branch established on 2007/06/01. Info updated 2012/01/20: Bank assets: $1,617.9 mil, Deposits: $1,235.2 mil, headquarters in West Springfield, MA, positive income, Commercial Lending Specialization, 25 total offices
- Bank of America, National Association: King Street Branch at 79 King Street, branch established on 1984/09/24; North Hampton Center Branch at 144 Main Street, branch established on 1994/10/31. Info updated 2009/11/18: Bank assets: $1,451,969.3 mil, Deposits: $1,077,176.8 mil, headquarters in Charlotte, NC, positive income, 5782 total offices, Holding Company: Bank Of America Corporation
- Easthampton Savings Bank: Locust Street Branch at 21 Locust Street, branch established on 1989/05/30; Northampton Branch at 297 King Street, branch established on 1997/09/08. Info updated 2008/10/14: Bank assets: $939.2 mil, Deposits: $757.1 mil, headquarters in Easthampton, MA, positive income, Mortgage Lending Specialization, 9 total offices, Holding Company: Esb Bancorp Mhc
- People's United Bank: Northampton Branch at 43 King Street, branch established on 1996/07/15. Info updated 2012/02/16: Bank assets: $27,319.3 mil, Deposits: $20,835.4 mil, headquarters in Bridgeport, CT, positive income, Commercial Lending Specialization, 374 total offices
- TD Bank, National Association: Northampton Branch at 175 Main Street, branch established on 1800/01/01. Info updated 2010/10/04: Bank assets: $188,912.6 mil, Deposits: $153,149.8 mil, headquarters in Wilmington, DE, positive income, 1314 total offices, Holding Company: Toronto-Dominion Bank, The
- RBS Citizens, National Association: Northampton Stop & Shop at 228 King Street, branch established on 2001/12/19. Info updated 2007/09/19: Bank assets: $106,940.6 mil, Deposits: $75,690.2 mil, headquarters in Providence, RI, positive income, 1135 total offices, Holding Company: Uk Financial Investments Limited
- The Northampton Co-operative Bank: The Northampton Co-Operative Bank at 67 King Street, branch established on 1889/01/01. Info updated 2006/11/03: Bank assets: $155.1 mil, Deposits: $126.7 mil, local headquarters, positive income, Mortgage Lending Specialization, 4 total offices
For population 15 years and over in Northampton:
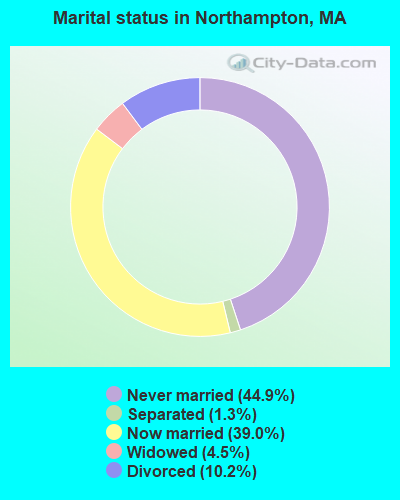
- Never married: 44.9%
- Now married: 39.0%
- Separated: 1.3%
- Widowed: 4.5%
- Divorced: 10.2%
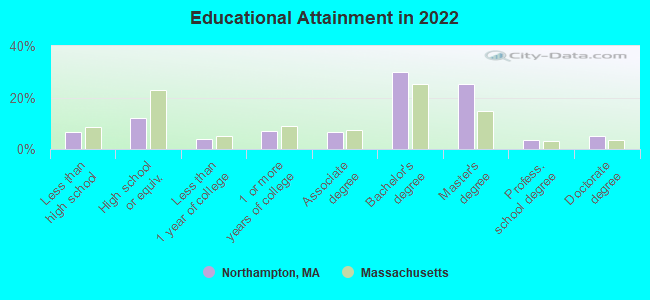
For population 25 years and over in Northampton:
- High school or higher: 93.9%
- Bachelor's degree or higher: 62.9%
- Graduate or professional degree: 34.9%
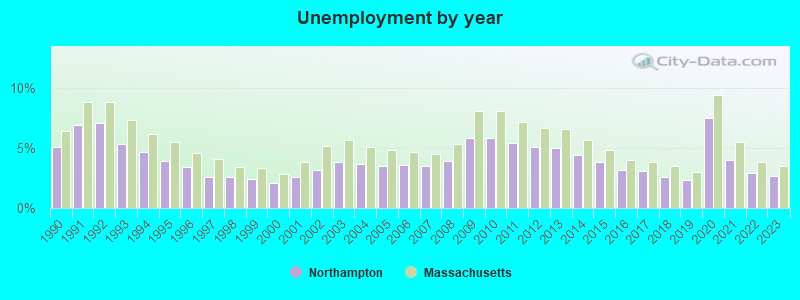
- Unemployed: 4.1%
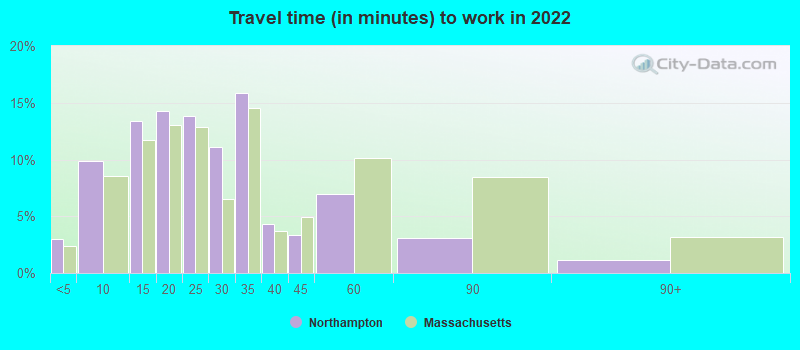
- Mean travel time to work (commute): 16.0 minutes
| Here: | 12.0 |
| Massachusetts average: | 13.0 |
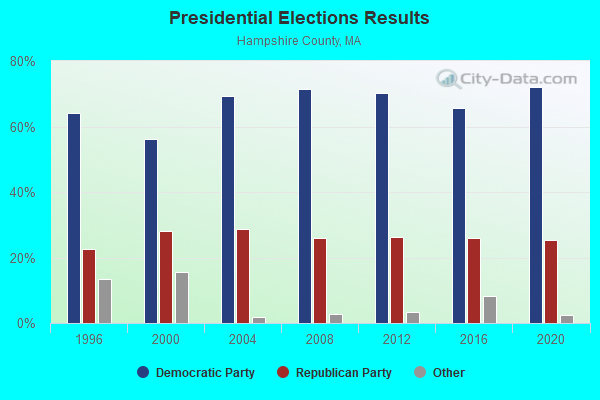
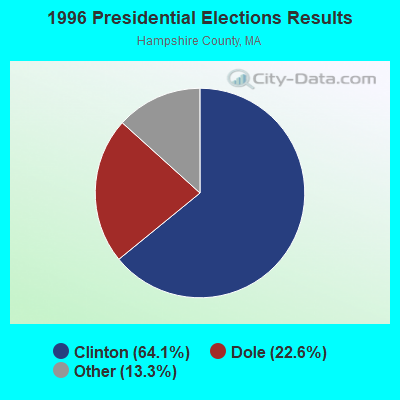
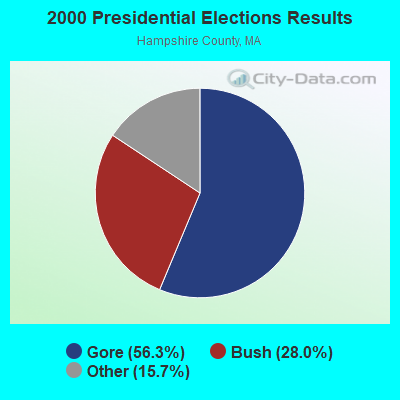
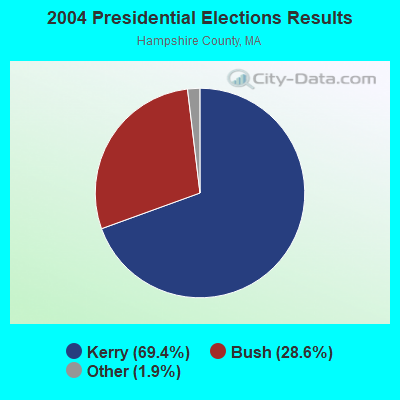
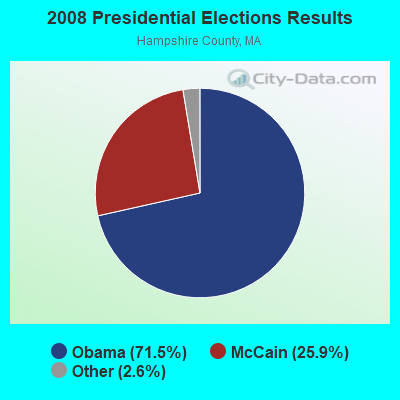
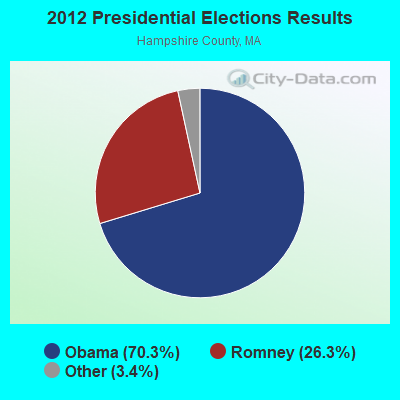
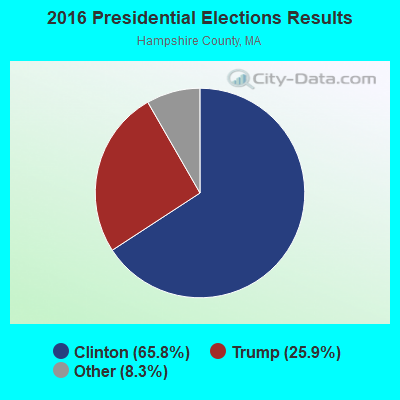
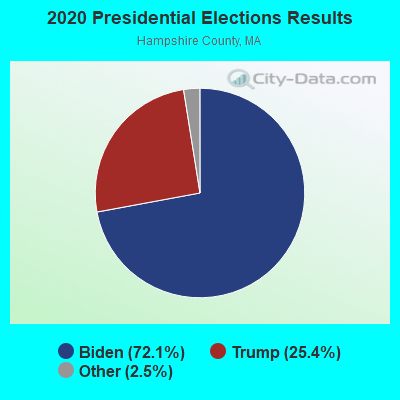
Graphs represent county-level data. Detailed 2008 Election Results
Religion statistics for Northampton, MA (based on Hampshire County data)
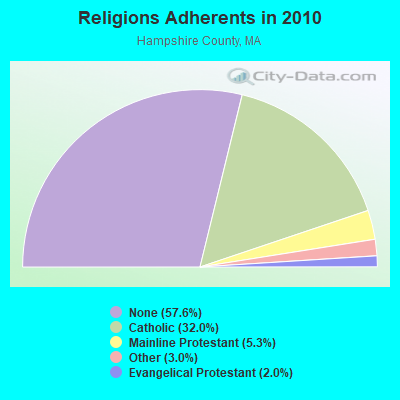
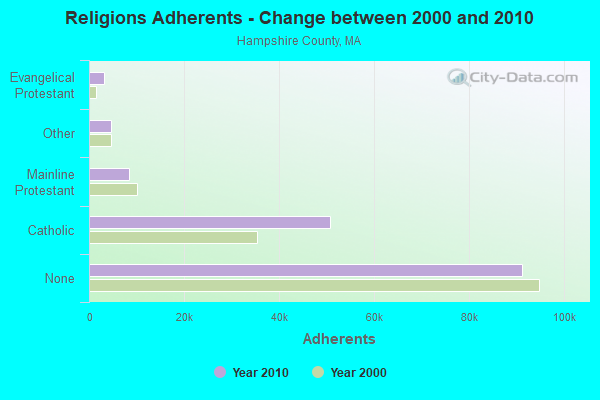
| Religion | Adherents | Congregations |
|---|---|---|
| Catholic | 50,643 | 22 |
| Mainline Protestant | 8,454 | 45 |
| Other | 4,722 | 27 |
| Evangelical Protestant | 3,128 | 22 |
| Black Protestant | 29 | 1 |
| None | 91,104 | - |
Food Environment Statistics:
| This county: | 2.07 / 10,000 pop. |
| State: | 1.98 / 10,000 pop. |
| Hampshire County: | 0.06 / 10,000 pop. |
| State: | 0.05 / 10,000 pop. |
| This county: | 1.55 / 10,000 pop. |
| State: | 2.22 / 10,000 pop. |
| Here: | 1.94 / 10,000 pop. |
| Massachusetts: | 1.77 / 10,000 pop. |
| Hampshire County: | 10.22 / 10,000 pop. |
| State: | 8.76 / 10,000 pop. |
| Here: | 7.3% |
| Massachusetts: | 8.1% |
| This county: | 21.7% |
| Massachusetts: | 22.5% |
| This county: | 12.3% |
| Massachusetts: | 16.5% |
Health and Nutrition:
| Northampton: | 51.2% |
| Massachusetts: | 50.5% |
| Northampton: | 49.7% |
| Massachusetts: | 48.0% |
| Here: | 28.2 |
| Massachusetts: | 28.4 |
| Northampton: | 21.6% |
| State: | 20.7% |
| This city: | 10.5% |
| State: | 10.4% |
| This city: | 6.9 |
| Massachusetts: | 6.8 |
| Northampton: | 32.1% |
| Massachusetts: | 33.4% |
| Northampton: | 58.3% |
| Massachusetts: | 57.1% |
| Northampton: | 79.9% |
| Massachusetts: | 79.2% |
More about Health and Nutrition of Northampton, MA Residents
| Local government employment and payroll (March 2021) | |||||
| Function | Full-time employees | Monthly full-time payroll | Average yearly full-time wage | Part-time employees | Monthly part-time payroll |
|---|---|---|---|---|---|
| Elementary and Secondary - Instruction | 407 | $2,461,194 | $72,566 | 459 | $539,167 |
| Firefighters | 125 | $1,283,755 | $123,240 | 0 | $0 |
| Police Protection - Officers | 119 | $1,194,176 | $120,421 | 0 | $0 |
| Elementary and Secondary - Other Total | 92 | $481,074 | $62,749 | 88 | $172,271 |
| Other Government Administration | 60 | $403,868 | $80,774 | 0 | $0 |
| Streets and Highways | 42 | $281,107 | $80,316 | 0 | $0 |
| Sewerage | 41 | $290,590 | $85,051 | 0 | $0 |
| Police - Other | 41 | $216,937 | $63,494 | 0 | $0 |
| Financial Administration | 34 | $197,890 | $69,844 | 0 | $0 |
| Health | 34 | $192,713 | $68,016 | 0 | $0 |
| Solid Waste Management | 31 | $192,872 | $74,660 | 0 | $0 |
| Welfare | 27 | $121,128 | $53,835 | 0 | $0 |
| Water Supply | 20 | $127,418 | $76,451 | 0 | $0 |
| Local Libraries | 20 | $103,375 | $62,025 | 42 | $60,572 |
| Parks and Recreation | 17 | $114,852 | $81,072 | 0 | $0 |
| Housing and Community Development (Local) | 15 | $105,942 | $84,754 | 0 | $0 |
| Other and Unallocable | 4 | $15,294 | $45,882 | 0 | $0 |
| Fire - Other | 2 | $13,093 | $78,558 | 0 | $0 |
| Airports | 2 | $9,064 | $54,384 | 0 | $0 |
| Totals for Government | 1,133 | $7,806,342 | $82,680 | 589 | $772,010 |
Northampton government finances - Expenditure in 2021 (per resident):
- Current Operations - Elementary and Secondary Education: $48,144,000 ($1641.63)
General - Other: $27,187,000 ($927.03)
Regular Highways: $7,058,000 ($240.67)
Local Fire Protection: $6,011,000 ($204.96)
Police Protection: $5,723,000 ($195.14)
Sewerage: $5,212,000 ($177.72)
Water Utilities: $4,219,000 ($143.86)
Libraries: $1,810,000 ($61.72)
General Public Buildings: $1,486,000 ($50.67)
Protective Inspection and Regulation - Other: $1,260,000 ($42.96)
Financial Administration: $1,094,000 ($37.30)
Central Staff Services: $1,070,000 ($36.49)
Housing and Community Development: $740,000 ($25.23)
Public Welfare - Other: $611,000 ($20.83)
Solid Waste Management: $528,000 ($18.00)
Parks and Recreation: $472,000 ($16.09)
Parking Facilities: $465,000 ($15.86)
Judicial and Legal Services: $362,000 ($12.34)
Health - Other: $325,000 ($11.08)
Natural Resources - Other: $2,000 ($0.07)
- General - Interest on Debt: $1,141,000 ($38.91)
- Intergovernmental to Local - Other - Elementary and Secondary Education: $904,000 ($30.82)
Other - Health - Other: $8,000 ($0.27)
- Intergovernmental to State - Transit Utilities: $437,000 ($14.90)
General - Other: $79,000 ($2.69)
- Other Capital Outlay - Elementary and Secondary Education: $1,142,000 ($38.94)
Regular Highways: $947,000 ($32.29)
Water Utilities: $494,000 ($16.84)
General Public Building: $475,000 ($16.20)
General - Other: $298,000 ($10.16)
Financial Administration: $237,000 ($8.08)
Protective Inspection and Regulation - Other: $177,000 ($6.04)
Sewerage: $144,000 ($4.91)
Central Staff Services: $73,000 ($2.49)
Parking Facilities: $42,000 ($1.43)
Local Fire Protection: $18,000 ($0.61)
Parks and Recreation: $6,000 ($0.20)
Solid Waste Management: $3,000 ($0.10)
- Total Salaries and Wages: $29,971,000 ($1021.96)
- Water Utilities - Interest on Debt: $54,000 ($1.84)
Northampton government finances - Revenue in 2021 (per resident):
- Charges - Other: $12,521,000 ($426.94)
Sewerage: $6,859,000 ($233.88)
Parking Facilities: $1,043,000 ($35.56)
Solid Waste Management: $590,000 ($20.12)
Elementary and Secondary Education School Lunch: $562,000 ($19.16)
Elementary and Secondary Education - Other: $81,000 ($2.76)
Elementary and Secondary Education School Tuition and Transportation: $50,000 ($1.70)
- Federal Intergovernmental - Other: $11,734,000 ($400.11)
Education: $1,182,000 ($40.30)
Housing and Community Development: $747,000 ($25.47)
- Local Intergovernmental - Education: $1,241,000 ($42.32)
- Miscellaneous - General Revenue - Other: $10,570,000 ($360.42)
Donations From Private Sources: $767,000 ($26.15)
Fines and Forfeits: $504,000 ($17.19)
Interest Earnings: $227,000 ($7.74)
- Revenue - Water Utilities: $7,682,000 ($261.94)
- State Intergovernmental - Education: $12,430,000 ($423.84)
General Local Government Support: $4,975,000 ($169.64)
Other: $2,907,000 ($99.12)
Highways: $1,419,000 ($48.39)
Public Welfare: $428,000 ($14.59)
- Tax - Property: $68,270,000 ($2327.89)
Other Selective Sales: $2,183,000 ($74.44)
Other License: $1,287,000 ($43.88)
Northampton government finances - Debt in 2021 (per resident):
- Long Term Debt - Outstanding Unspecified Public Purpose: $40,400,000 ($1377.57)
Beginning Outstanding - Unspecified Public Purpose: $40,313,000 ($1374.60)
Issue, Unspecified Public Purpose: $9,107,000 ($310.53)
Retired Unspecified Public Purpose: $9,021,000 ($307.60)
- Short Term Debt Outstanding - End of Fiscal Year: $11,150,000 ($380.20)
Northampton government finances - Cash and Securities in 2021 (per resident):
- Other Funds - Cash and Securities: $121,704,000 ($4149.90)
| Businesses in Northampton, MA | ||||
| Name | Count | Name | Count | |
|---|---|---|---|---|
| 7-Eleven | 1 | Quality | 1 | |
| AT&T | 1 | RadioShack | 1 | |
| AutoZone | 1 | SAS Shoes | 1 | |
| Blockbuster | 1 | Staples | 1 | |
| Burger King | 1 | Starbucks | 2 | |
| CVS | 2 | Stop & Shop | 1 | |
| Chevrolet | 1 | Subway | 1 | |
| Clarion | 1 | T-Mobile | 2 | |
| Curves | 1 | Taco Bell | 1 | |
| Domino's Pizza | 1 | Talbots | 1 | |
| Dunkin Donuts | 4 | Toyota | 1 | |
| FedEx | 3 | True Value | 1 | |
| Firestone Complete Auto Care | 1 | U-Haul | 1 | |
| Ford | 1 | UPS | 6 | |
| H&R Block | 1 | Urban Outfitters | 1 | |
| Honda | 1 | Volkswagen | 1 | |
| KFC | 1 | Walgreens | 1 | |
| McDonald's | 1 | Walmart | 1 | |
| New Balance | 2 | YMCA | 1 | |
| Nike | 3 | |||
Strongest AM radio stations in Northampton:
- WHMP (1400 AM; 1 kW; NORTHAMPTON, MA; Owner: SAGA COMMUNICATIONS OF NEW ENGLAND, LLC)
- WNNZ (640 AM; 50 kW; WESTFIELD, MA; Owner: CLEAR CHANNEL BROADCASTING LICENSES, INC.)
- WHYN (560 AM; 5 kW; SPRINGFIELD, MA; Owner: CLEAR CHANNEL BROADCASTING LICENSES, INC.)
- WACE (730 AM; 5 kW; CHICOPEE, MA; Owner: CARTER BROADCASTING CORP.)
- WPNI (1430 AM; 5 kW; AMHERST, MA; Owner: WESTERN MASSACHUSETTS RADIO COMPANY)
- WCRN (830 AM; 50 kW; WORCESTER, MA; Owner: CARTER BROADCASTING CORPORATION)
- WVNE (760 AM; daytime; 25 kW; LEICESTER, MA; Owner: BLOUNT MASSCOM, INC.)
- WTIC (1080 AM; 50 kW; HARTFORD, CT; Owner: INFINITY RADIO OPERATIONS INC.)
- WIZZ (1520 AM; daytime; 10 kW; GREENFIELD, MA; Owner: P. & M. RADIO, LLC)
- WSPR (1270 AM; 5 kW; SPRINGFIELD, MA; Owner: ANTONIO F. AND HELENA R. GOIS, TENANTS BY THE ENTIRETY)
- WALE (990 AM; 50 kW; GREENVILLE, RI; Owner: NORTH AMERICAN BROADCASTING CO., INC.)
- WRKO (680 AM; 50 kW; BOSTON, MA; Owner: ENTERCOM BOSTON LICENSE, LLC)
- WEEI (850 AM; 50 kW; BOSTON, MA; Owner: ENTERCOM BOSTON LICENSE, LLC)
Strongest FM radio stations in Northampton:
- WHYN-FM (93.1 FM; SPRINGFIELD, MA; Owner: CLEAR CHANNEL BROADCASTING LICENSES, INC.)
- WRNX (100.9 FM; AMHERST, MA; Owner: WESTERN MASSACHUSETTS RADIO COMPANY)
- WLZX (99.3 FM; NORTHAMPTON, MA; Owner: SAGA COMMUNICATIONS OF NEW ENGLAND, LLC)
- WEIB (106.3 FM; NORTHAMPTON, MA; Owner: CUTTING EDGE BROADCASTING, INC.)
- WFCR (88.5 FM; AMHERST, MA; Owner: UNIVERSITY OF MASSACHUSETTS)
- WOZQ (91.9 FM; NORTHAMPTON, MA; Owner: TRUSTEES OF THE SMITH COLLEGE)
- W246AM (97.1 FM; AMHERST, MA; Owner: GREAT NORTHERN RADIO, LLC)
- WAMH (89.3 FM; AMHERST, MA; Owner: TRUSTEES OF AMHERST COLLEGE)
- WAMC-FM (90.3 FM; ALBANY, NY; Owner: WAMC)
- WAQY (102.1 FM; SPRINGFIELD, MA; Owner: SAGA COMMUNICATIONS OF NEW ENGLAND, LLC)
- WCCH (103.5 FM; HOLYOKE, MA; Owner: HOLYOKE COMMUNITY COLLEGE)
- WPKX (97.9 FM; ENFIELD, CT; Owner: CAPSTAR TX LIMITED PARTNERSHIP)
- WPVQ (95.3 FM; GREENFIELD, MA; Owner: GREAT NORTHERN RADIO, L.L.C.)
- WEQX (102.7 FM; MANCHESTER, VT; Owner: NORTHSHIRE COMMUNICATIONS, INC.)
- WHAI (98.3 FM; GREENFIELD, MA; Owner: SAGA COMMUNICATIONS OF NEW ENGLAND, LLC)
- WJAN (95.1 FM; SUNDERLAND, VT; Owner: 6 JOHNSON ROAD LICENSES, INC.)
- WVAY (100.7 FM; WILMINGTON, VT; Owner: GREAT NORTHERN RADIO, L.L.C.)
- WRSI (93.9 FM; TURNERS FALLS, MA; Owner: GREAT NORTHERN RADIO, LLC)
- WGAJ (91.7 FM; DEERFIELD, MA; Owner: TRUATEES OF DEERFIELD ACADEMY)
- WAAF (107.3 FM; WORCESTER, MA; Owner: ENTERCOM BOSTON LICENSE, LLC)
TV broadcast stations around Northampton:
- WGGB-TV (Channel 40; SPRINGFIELD, MA; Owner: WGGB LICENSEE, LLC)
- WGBY-TV (Channel 57; SPRINGFIELD, MA; Owner: WGBH EDUCATIONAL FOUNDATION)
- WYDN (Channel 48; WORCESTER, MA; Owner: EDUCATIONAL PUBLIC TV CORPORATION)
- W67DF (Channel 67; SPRINGFIELD, MA; Owner: TRINITY BROADCASTING NETWORK)
- WWLP (Channel 22; SPRINGFIELD, MA; Owner: WWLP BROADCASTING, LLC)
- WTIC-TV (Channel 61; HARTFORD, CT; Owner: TRIBUNE TELEVISION COMPANY)
- W11BJ (Channel 11; HARTFORD, CT; Owner: COMMUNICATIONS SITE MANAGEMENT LLC)
- WUVN (Channel 18; HARTFORD, CT; Owner: ENTRAVISION HOLDINGS, LLC)
- WTXX (Channel 20; WATERBURY, CT; Owner: WTXX INC.)
- WUNI (Channel 27; WORCESTER, MA; Owner: ENTRAVISION HOLDINGS, LLC)
- WVIT (Channel 30; NEW BRITAIN, CT; Owner: OUTLET BROADCASTING, INC)
- WEDH (Channel 24; HARTFORD, CT; Owner: CONNECTICUT PUBLIC BROADCASTING, INC.)
- W35BK (Channel 35; PLAINFIELD, MA; Owner: LYDIA SYLVANE STOCKWELL)
- WDMR-LP (Channel 65; SPRINGFIELD, MA; Owner: ZGS HARTFORD, INC.)
- National Bridge Inventory (NBI) Statistics
- 50Number of bridges
- 568ft / 173mTotal length
- $155,853,000Total costs
- 616,594Total average daily traffic
- 39,502Total average daily truck traffic
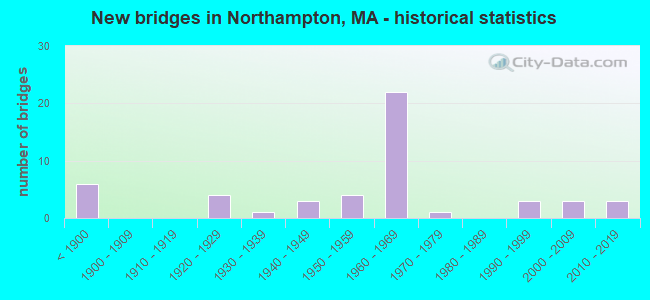
- New bridges - historical statistics
- 6Before 1900
- 41920-1929
- 11930-1939
- 31940-1949
- 41950-1959
- 221960-1969
- 11970-1979
- 31990-1999
- 32000-2009
- 32010-2019
FCC Registered Commercial Land Mobile Towers: 3 (See the full list of FCC Registered Commercial Land Mobile Towers in Northampton, MA)
FCC Registered Private Land Mobile Towers: 3 (See the full list of FCC Registered Private Land Mobile Towers)
FCC Registered Broadcast Land Mobile Towers: 22 (See the full list of FCC Registered Broadcast Land Mobile Towers)
FCC Registered Microwave Towers: 16 (See the full list of FCC Registered Microwave Towers in this town)
FCC Registered Paging Towers: 1 (See the full list of FCC Registered Paging Towers)
FCC Registered Maritime Coast & Aviation Ground Towers: 1 (See the full list of FCC Registered Maritime Coast & Aviation Ground Towers)
FCC Registered Amateur Radio Licenses: 58 (See the full list of FCC Registered Amateur Radio Licenses in Northampton)
FAA Registered Aircraft Manufacturers and Dealers: 3 (See the full list of FAA Registered Manufacturers and Dealers in Northampton)
FAA Registered Aircraft: 37 (See the full list of FAA Registered Aircraft)
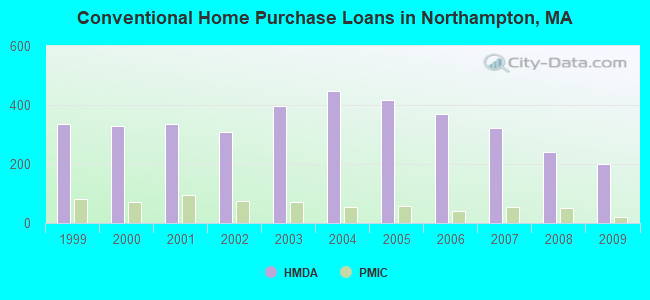
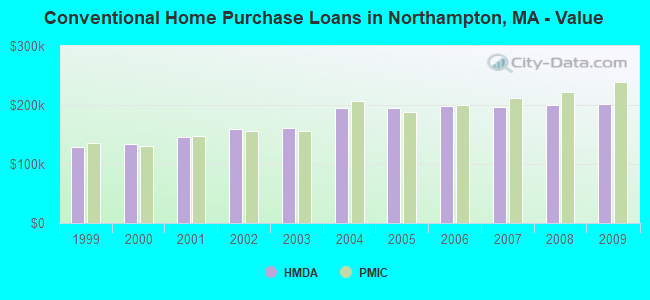
| Home Mortgage Disclosure Act Aggregated Statistics For Year 2009 (Based on 7 full tracts) | ||||||||||||
| A) FHA, FSA/RHS & VA Home Purchase Loans | B) Conventional Home Purchase Loans | C) Refinancings | D) Home Improvement Loans | E) Loans on Dwellings For 5+ Families | F) Non-occupant Loans on < 5 Family Dwellings (A B C & D) | |||||||
|---|---|---|---|---|---|---|---|---|---|---|---|---|
| Number | Average Value | Number | Average Value | Number | Average Value | Number | Average Value | Number | Average Value | Number | Average Value | |
| LOANS ORIGINATED | 34 | $212,265 | 200 | $201,435 | 576 | $206,832 | 94 | $116,138 | 9 | $804,000 | 46 | $212,543 |
| APPLICATIONS APPROVED, NOT ACCEPTED | 5 | $182,400 | 19 | $216,263 | 29 | $204,069 | 5 | $83,000 | 0 | $0 | 8 | $185,250 |
| APPLICATIONS DENIED | 5 | $242,200 | 16 | $192,188 | 126 | $215,286 | 13 | $127,769 | 2 | $839,000 | 7 | $198,714 |
| APPLICATIONS WITHDRAWN | 5 | $180,400 | 23 | $237,783 | 72 | $227,097 | 3 | $58,333 | 0 | $0 | 3 | $197,000 |
| FILES CLOSED FOR INCOMPLETENESS | 0 | $0 | 8 | $187,625 | 28 | $207,464 | 3 | $155,667 | 0 | $0 | 1 | $108,000 |
Detailed HMDA statistics for the following Tracts: 8216.01 , 8216.02, 8217.00, 8219.01, 8219.02, 8220.00, 8222.00
| Private Mortgage Insurance Companies Aggregated Statistics For Year 2009 (Based on 6 full tracts) | ||||
| A) Conventional Home Purchase Loans | B) Refinancings | |||
|---|---|---|---|---|
| Number | Average Value | Number | Average Value | |
| LOANS ORIGINATED | 20 | $239,700 | 9 | $267,778 |
| APPLICATIONS APPROVED, NOT ACCEPTED | 5 | $204,000 | 3 | $351,667 |
| APPLICATIONS DENIED | 0 | $0 | 2 | $198,500 |
| APPLICATIONS WITHDRAWN | 2 | $255,500 | 3 | $204,000 |
| FILES CLOSED FOR INCOMPLETENESS | 1 | $188,000 | 0 | $0 |
Detailed PMIC statistics for the following Tracts: 8216.01 , 8216.02, 8217.00, 8219.01, 8219.02, 8220.00, 8222.00
2002 - 2018 National Fire Incident Reporting System (NFIRS) incidents
- Fire incident types reported to NFIRS in Northampton, MA
- 53243.6%Structure Fires
- 36529.9%Outside Fires
- 20116.5%Mobile Property/Vehicle Fires
- 12310.1%Other
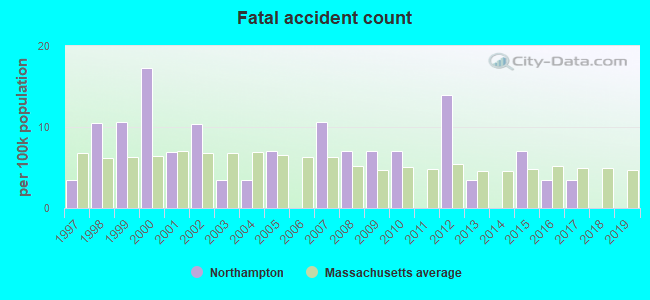
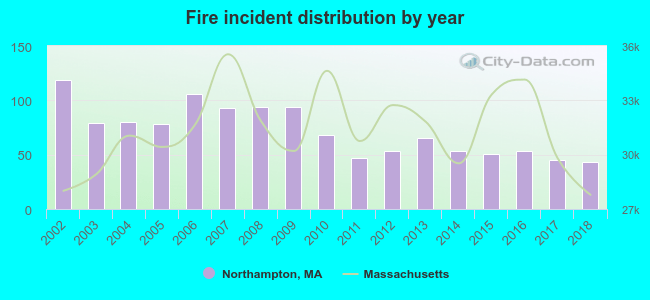 Based on the data from the years 2002 - 2018 the average number of fires per year is 72. The highest number of fire incidents - 119 took place in 2002, and the least - 43 in 2018. The data has a dropping trend.
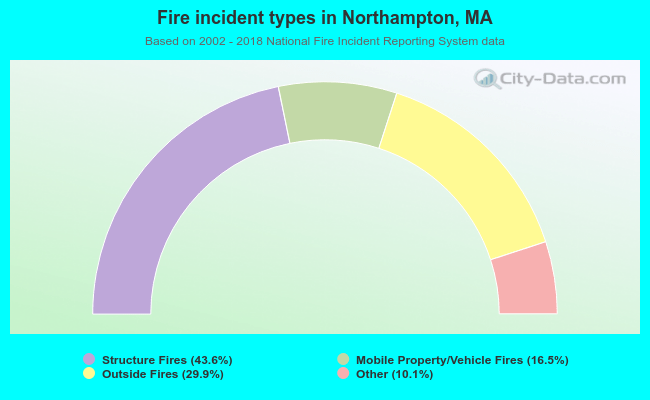 When looking into fire subcategories, the most reports belonged to: Structure Fires (43.6%), and Outside Fires (29.9%).
Fire-safe hotels and motels in Northampton, Massachusetts:
- The Clarion Hotel & Conference Center, 1 Atwood Dr, Northampton, Massachusetts 01060 , Phone: (413) 586-1211, Fax: (413) 586-0630
- Quality Inn & Suites, 117 Conz St, Northampton, Massachusetts 01060 , Phone: (413) 586-1500, Fax: (413) 586-6549
| Most common first names in Northampton, MA among deceased individuals | ||
| Name | Count | Lived (average) |
|---|---|---|
| John | 349 | 74.1 years |
| Mary | 345 | 82.1 years |
| William | 212 | 75.1 years |
| Joseph | 198 | 74.7 years |
| Helen | 180 | 79.3 years |
| Edward | 170 | 72.1 years |
| Charles | 135 | 74.9 years |
| Anna | 134 | 83.3 years |
| Margaret | 133 | 82.2 years |
| George | 125 | 74.3 years |
| Most common last names in Northampton, MA among deceased individuals | ||
| Last name | Count | Lived (average) |
|---|---|---|
| Smith | 72 | 77.4 years |
| Sullivan | 54 | 76.7 years |
| Miller | 41 | 74.5 years |
| Murphy | 40 | 75.9 years |
| Ryan | 35 | 77.7 years |
| Mccarthy | 30 | 76.6 years |
| Obrien | 27 | 77.6 years |
| Johnson | 27 | 80.2 years |
| Brown | 25 | 81.6 years |
| Clark | 24 | 72.8 years |
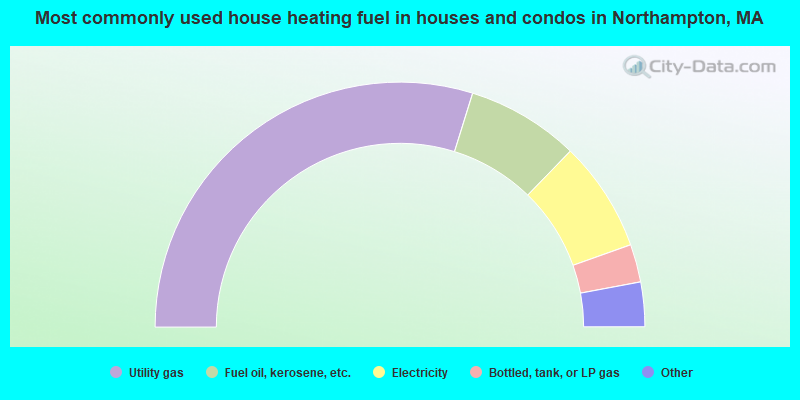
- 59.6%Utility gas
- 14.9%Fuel oil, kerosene, etc.
- 14.6%Electricity
- 5.0%Bottled, tank, or LP gas
- 2.4%Wood
- 2.1%Other fuel
- 1.0%Solar energy
- 0.2%Coal or coke
- 0.2%No fuel used
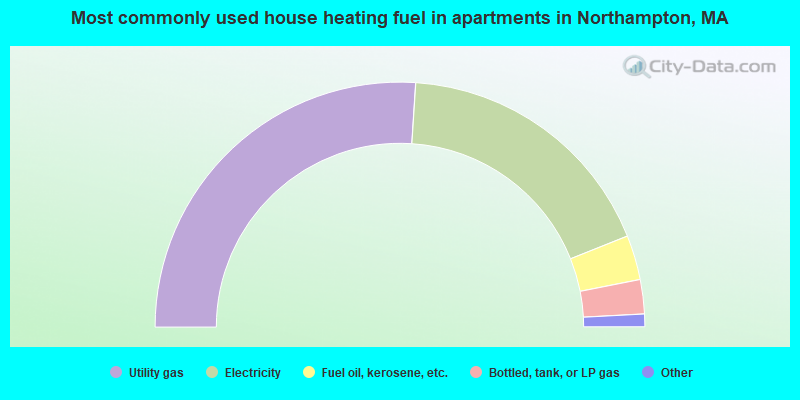
- 52.1%Utility gas
- 35.9%Electricity
- 5.9%Fuel oil, kerosene, etc.
- 4.5%Bottled, tank, or LP gas
- 0.8%Other fuel
- 0.5%Solar energy
- 0.4%No fuel used
Northampton compared to Massachusetts state average:
- Unemployed percentage significantly below state average.
- Black race population percentage below state average.
- Foreign-born population percentage below state average.
- Length of stay since moving in significantly above state average.
- Institutionalized population percentage above state average.
- Number of college students above state average.
- Percentage of population with a bachelor's degree or higher above state average.
Northampton on our top lists:
- #1 on the list of "Top 101 cities with the largest percentage of likely lesbian couples (counted as self-reported female-female unmarried-partner households) (population 5,000+)"
- #8 on the list of "Top 101 cities with the largest percentage of likely homosexual households (counted as self-reported same-sex unmarried-partner households) (population 5,000+)"
- #12 on the list of "Top 101 cities with the most full-time firefighters per 1000 residents (population 5,000+)"
- #21 on the list of "Top 101 cities with the largest positive percentage difference between never married females and males (15+ years) (with at least 1,000 females never married)"
- #27 on the list of "Top 100 cities with the largest percentage of females (pop. 5,000+)"
- #61 on the list of "Top 101 cities with largest percentage of males in occupations: education, training, and library occupations (population 5,000+)"
- #78 on the list of "Top 101 cities with the most full-time local library workers per 1000 residents (population 5,000+)"
- #81 on the list of "Top 101 cities with the biggest property tax revenues per resident (population 10,000+)"
- #96 on the list of "Top 101 cities with the most people taking a bicycle to work (population 5,000+)"
- #99 on the list of "Top 101 cities with the most full-time financial administration workers per 1000 residents (population 5,000+)"
- #2 on the list of "Top 101 counties with the lowest number of births per 1000 residents 2007-2013"
- #9 on the list of "Top 101 counties with the lowest Particulate Matter (PM10) Annual air pollution readings in 2012 (µg/m3)"
- #19 on the list of "Top 101 counties with the lowest average weight of females"
- #30 on the list of "Top 101 counties with highest percentage of residents voting for 3rd party candidates in the 2012 Presidential Election (pop. 50,000+)"
- #41 on the list of "Top 101 counties with the highest percentage of residents that exercised in the past month"

|
|
Total of 131 patent applications in 2008-2024.