Estimated zip code population in 2022: 960 Zip code population in 2010: 972 Zip code population in 2000: 1,030
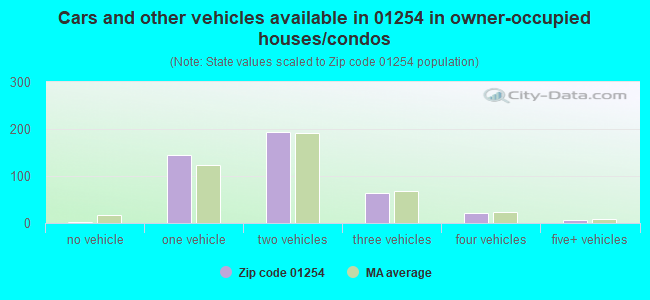
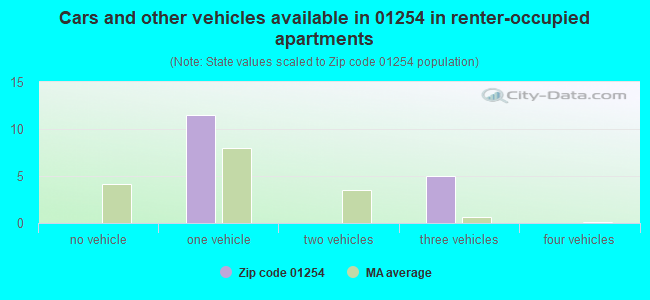
Houses and condos: 567 Renter-occupied apartments: 16
% of renters here:
4%
State:
38%
March 2022 cost of living index in zip code 01254: 90.7 (less than average, U.S. average is 100)
Land area: 14.6 sq. mi. Water area: 0.1 sq. mi.
Population density: 66 people per square mile
(very low).
OSM Map
Google Map
MSN Map
OSM Map
General Map
Google Map
MSN Map
OSM Map
Google Map
MSN Map
OSM Map
Google Map
MSN Map
Please wait while loading the map...
Real estate property taxes paid for housing units in 2022:
This zip code:
0.9% ($5,016)
Massachusetts:
1.0% ($5,536)
Median real estate property taxes paid for housing units with mortgages in 2022: $4,933 (0.8%) Median real estate property taxes paid for housing units with no mortgage in 2022: $5,128 (0.9%)
Business Search- 14 Million verified businesses
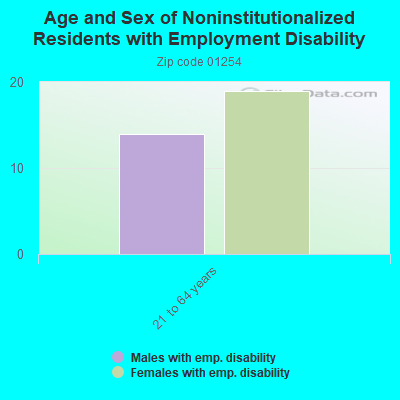
Males: 432
(45.0%)
Females: 528
(55.0%)
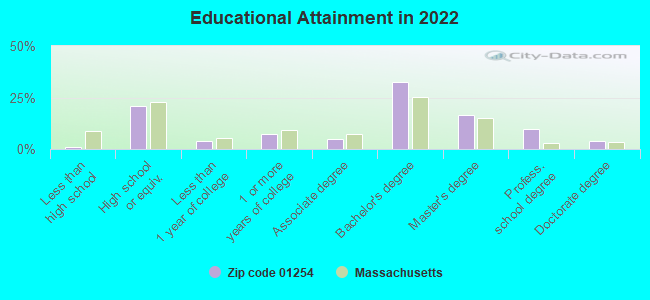
For population 25 years and over in 01254:
High school or higher: 99.4%
Bachelor's degree or higher: 62.9%
Graduate or professional degree: 30.3%
Unemployed: 1.3%
Mean travel time to work (commute): 19.5 minutes
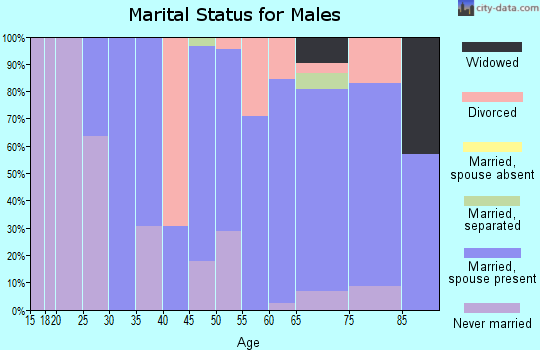
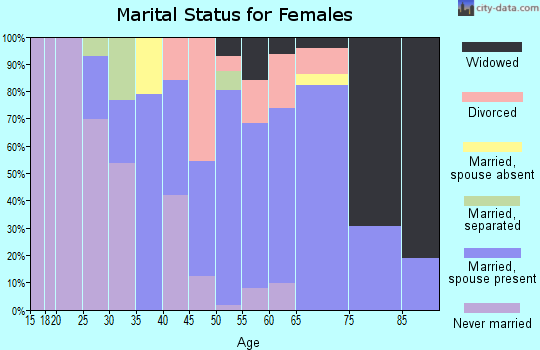
For population 15 years and over in 01254:
Never married: 17.7%
Now married: 68.2%
Separated: 1.7%
Widowed: 4.7%
Divorced: 7.8%
Zip code 01254 compared to state average:
Unemployed percentage significantly below state average.
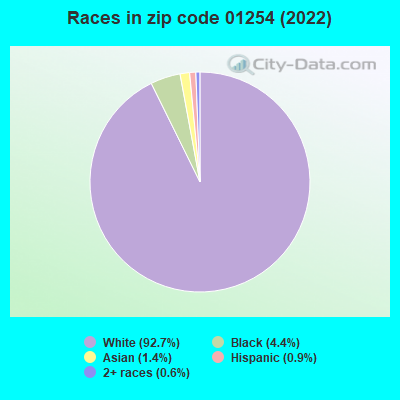
Hispanic race population percentage significantly below state average.
Median age significantly above state average.
Foreign-born population percentage significantly below state average.
Renting percentage significantly below state average.
Length of stay since moving in significantly above state average.
Number of rooms per house above state average.
Number of college students significantly below state average.
Percentage of population with a bachelor's degree or higher above state average.
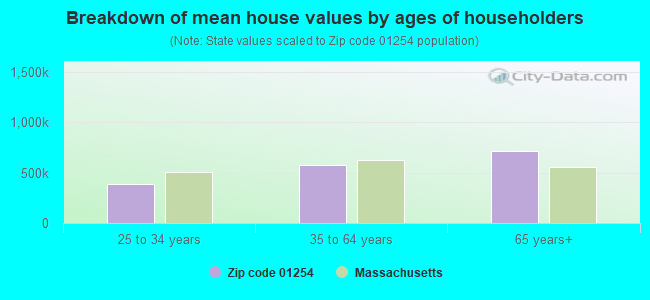
Estimated median house/condo value in 2022: $570,280
01254:
$570,280
Massachusetts:
$534,700
According to our research of Massachusetts and other state lists, there was 1 registered sex offender living in 01254 zip code as of April 27, 2024. The ratio of all residents to sex offenders in zip code 01254 is 999 to 1.
Median resident age:
This zip code:
62.6 years
Massachusetts median age:
40.3 years
Average household size:
This zip code:
2.1 people
Massachusetts:
2.4 people
Averages for the 2020 tax year for zip code 01254, filed in 2021:
Average Adjusted Gross Income (AGI) in 2020: $133,895 (Individual Income Tax Returns)
Here:
$133,895
State:
$105,130
Salary/wage: $81,557 (reported on 72.1% of returns)
Here:
$81,557
State:
$82,951
(% of AGI for various income ranges: 1128.3% for AGIs below $25k, 2892.2% for AGIs $25k-50k, 6852.5% for AGIs $50k-75k, 7285.0% for AGIs $75k-100k, 12164.3% for AGIs $100k-200k)
Taxable interest for individuals: $2,368 (reported on 55.7% of returns)
This zip code:
$2,368
Massachusetts:
$2,361
(% of AGI for various income ranges: 25.0% for AGIs below $25k, 32.2% for AGIs $25k-50k, 77.5% for AGIs $50k-75k, 87.5% for AGIs $75k-100k, 251.4% for AGIs $100k-200k)
Ordinary dividends: $15,154 (reported on 45.9% of returns)
Here:
$15,154
State:
$10,365
(% of AGI for various income ranges: 126.7% for AGIs below $25k, 196.7% for AGIs $25k-50k, 760.0% for AGIs $50k-75k, 262.5% for AGIs $75k-100k, 1830.0% for AGIs $100k-200k)
Net capital gain/loss in AGI: +$53,008 (reported on 41.0% of returns)
Here:
+$53,008
State:
+$48,178
(% of AGI for various income ranges: 156.7% for AGIs $25k-50k, 825.0% for AGIs $50k-75k, 82.5% for AGIs $75k-100k, 2091.4% for AGIs $100k-200k)
Profit/loss from business: +$28,347 (reported on 24.6% of returns)
Here:
+$28,347
State:
+$20,792
(% of AGI for various income ranges: 186.7% for AGIs below $25k, 315.6% for AGIs $25k-50k, 1255.0% for AGIs $50k-75k, 784.3% for AGIs $100k-200k)
Taxable individual retirement arrangement distribution: $19,817 (reported on 19.7% of returns)
01254:
$19,817
Massachusetts:
$22,790
(% of AGI for various income ranges: 283.3% for AGIs $25k-50k, 1027.5% for AGIs $50k-75k, 1551.4% for AGIs $100k-200k)
Self-employed (Keogh) retirement plans: $23,400 (reported on 3.3% of returns)
01254:
$23,400
Massachusetts:
$26,868
(% of AGI for various income ranges: 668.6% for AGIs $100k-200k)
Total itemized deductions: $58,356 (reported on 14.8% of returns)
Here:
$58,356
State:
$36,722
(% of AGI for various income ranges: 891.1% for AGIs $25k-50k, 967.1% for AGIs $100k-200k)
Charity contributions: $27,157 (reported on 11.5% of returns)
Here:
$27,157
State:
$12,529
(% of AGI for various income ranges: 447.5% for AGIs $75k-100k)
Taxes paid: $9,567 (reported on 14.8% of returns)
01254:
$9,567
State:
$8,782
(% of AGI for various income ranges: 250.0% for AGIs $25k-50k, 280.0% for AGIs $100k-200k)
Earned income credit: $1,233 (reported on 4.9% of returns)
Here:
$1,233
State:
$1,909
(% of AGI for various income ranges: 61.7% for AGIs below $25k)
Percentage of individuals using paid preparers for their 2020 taxes: 90.2%
Here:
90%
State:
92%
(% for various income ranges: 84.6% for AGIs below $25k, 92.3% for AGIs $25k-50k, 100.0% for AGIs $50k-75k, 83.3% for AGIs $75k-100k, 83.3% for AGIs $100k-200k, 100.0% for AGIs over 200k)
Averages for the 2012 tax year for zip code 01254, filed in 2013:
Average Adjusted Gross Income (AGI) in 2012: $132,135 (Individual Income Tax Returns)
Here:
$132,135
State:
$81,425
Salary/wage: $111,427 (reported on 76.2% of returns)
Here:
$111,427
State:
$64,752
(% of AGI for various income ranges: 58.8% for AGIs below $25k, 60.3% for AGIs $25k-50k, 58.3% for AGIs $50k-75k, 51.8% for AGIs $75k-100k, 54.3% for AGIs $100k-200k, 69.0% for AGIs over 200k)
Taxable interest for individuals: $1,895 (reported on 61.9% of returns)
This zip code:
$1,895
Massachusetts:
$2,136
(% of AGI for various income ranges: 3.8% for AGIs below $25k, 1.0% for AGIs $25k-50k, 2.0% for AGIs $50k-75k, 1.3% for AGIs $75k-100k, 1.3% for AGIs $100k-200k, 0.5% for AGIs over 200k)
Ordinary dividends: $16,041 (reported on 46.0% of returns)
Here:
$16,041
State:
$9,473
(% of AGI for various income ranges: 6.1% for AGIs below $25k, 2.7% for AGIs $25k-50k, 6.1% for AGIs $50k-75k, 2.6% for AGIs $75k-100k, 6.4% for AGIs $100k-200k, 5.8% for AGIs over 200k)
Net capital gain/loss in AGI: +$8,484 (reported on 39.7% of returns)
Here:
+$8,484
State:
+$31,437
(% of AGI for various income ranges: 1.4% for AGIs $50k-75k, 0.6% for AGIs $75k-100k, 4.2% for AGIs $100k-200k, 2.8% for AGIs over 200k)
Profit/loss from business: +$34,740 (reported on 23.8% of returns)
Here:
+$34,740
State:
+$20,662
(% of AGI for various income ranges: 7.8% for AGIs below $25k, 17.1% for AGIs $25k-50k, 10.1% for AGIs $75k-100k, 9.9% for AGIs $100k-200k, 4.7% for AGIs over 200k)
Taxable individual retirement arrangement distribution: $18,850 (reported on 19.0% of returns)
01254:
$18,850
Massachusetts:
$18,892
(% of AGI for various income ranges: 9.4% for AGIs below $25k, 4.7% for AGIs $25k-50k, 8.2% for AGIs $50k-75k, 10.7% for AGIs $100k-200k)
Self-employment retirement plans: $24,250 (reported on 3.2% of returns)
01254:
$24,250
Massachusetts:
$20,669
Total itemized deductions: $42,756 (18% of AGI, reported on 50.8% of returns)
Here:
$42,756
State:
$28,907
Here:
18.4% of AGI
State:
18.2% of AGI
(% of AGI for various income ranges: 26.3% for AGIs below $25k, 12.8% for AGIs $25k-50k, 16.3% for AGIs $50k-75k, 18.3% for AGIs $75k-100k, 17.6% for AGIs $100k-200k, 15.9% for AGIs over 200k)
Charity contributions: $8,338 (reported on 46.0% of returns)
Here:
$8,338
State:
$4,208
(% of AGI for various income ranges: 1.4% for AGIs below $25k, 1.1% for AGIs $25k-50k, 1.8% for AGIs $50k-75k, 2.0% for AGIs $75k-100k, 1.8% for AGIs $100k-200k, 3.6% for AGIs over 200k)
Taxes paid: $21,003 (reported on 50.8% of returns)
01254:
$21,003
State:
$13,303
(% of AGI for various income ranges: 6.1% for AGIs below $25k, 4.2% for AGIs $25k-50k, 6.3% for AGIs $50k-75k, 8.1% for AGIs $75k-100k, 8.3% for AGIs $100k-200k, 8.6% for AGIs over 200k)
Earned income credit: $925 (reported on 6.3% of returns)
Here:
$925
State:
$1,971
(% of AGI for various income ranges: 1.9% for AGIs below $25k)
Percentage of individuals using paid preparers for their 2012 taxes: 69.8%
Here:
70%
State:
56%
(% for various income ranges: 63.2% for AGIs below $25k, 66.7% for AGIs $25k-50k, 66.7% for AGIs $50k-75k, 66.7% for AGIs $75k-100k, 70.0% for AGIs $100k-200k, 100.0% for AGIs over 200k)
Averages for the 2004 tax year for zip code 01254, filed in 2005:
Average Adjusted Gross Income (AGI) in 2004: $103,725 (Individual Income Tax Returns)
Here:
$103,725
State:
$62,877
Salary/wage: $64,310 (reported on 75.8% of returns)
Here:
$64,310
State:
$52,969
(% of AGI for various income ranges: 121.4% for AGIs below $10k, 58.8% for AGIs $10k-25k, 60.0% for AGIs $25k-50k, 60.1% for AGIs $50k-75k, 56.0% for AGIs $75k-100k, 42.5% for AGIs over 100k)
Taxable interest for individuals: $2,857 (reported on 73.1% of returns)
This zip code:
$2,857
Massachusetts:
$1,945
(% of AGI for various income ranges: 8.0% for AGIs below $10k, 5.5% for AGIs $10k-25k, 2.8% for AGIs $25k-50k, 2.7% for AGIs $50k-75k, 4.3% for AGIs $75k-100k, 1.4% for AGIs over 100k)
Taxable dividends: $11,397 (reported on 50.2% of returns)
Here:
$11,397
State:
$5,323
(% of AGI for various income ranges: 7.0% for AGIs below $10k, 5.1% for AGIs $10k-25k, 5.1% for AGIs $25k-50k, 4.1% for AGIs $50k-75k, 5.5% for AGIs $75k-100k, 5.7% for AGIs over 100k)
Net capital gain/loss: +$43,281 (reported on 45.2% of returns)
Here:
+$43,281
State:
+$20,377
(% of AGI for various income ranges: -4.9% for AGIs below $10k, 4.0% for AGIs $10k-25k, 0.2% for AGIs $25k-50k, 0.7% for AGIs $50k-75k, 12.5% for AGIs $75k-100k, 23.8% for AGIs over 100k)
Profit/loss from business: +$27,395 (reported on 23.7% of returns)
Here:
+$27,395
State:
+$17,837
(% of AGI for various income ranges: -6.2% for AGIs below $10k, 6.8% for AGIs $10k-25k, 13.7% for AGIs $25k-50k, 8.6% for AGIs $50k-75k, 5.0% for AGIs $75k-100k, 5.6% for AGIs over 100k)
IRA payment deduction: $3,852 (reported on 4.3% of returns)
01254:
$3,852
Massachusetts:
$3,100
Self-employed pension: $12,429 (reported on 3.4% of returns)
Here:
$12,429
Massachusetts:
$14,516
Total itemized deductions: $31,508 (19% of AGI, reported on 47.5% of returns)
Here:
$31,508
State:
$22,573
Here:
18.6% of AGI
State:
19.5% of AGI
(% of AGI for various income ranges: 22.2% for AGIs $10k-25k, 15.6% for AGIs $25k-50k, 13.8% for AGIs $50k-75k, 16.8% for AGIs $75k-100k, 13.9% for AGIs over 100k)
Charity contributions deductions: $6,868 (4% of AGI, reported on 43.8% of returns)
Here:
$6,868
State:
$3,295
Here:
3.9% of AGI
State:
2.7% of AGI
(% of AGI for various income ranges: 2.0% for AGIs $10k-25k, 1.8% for AGIs $25k-50k, 2.1% for AGIs $50k-75k, 2.1% for AGIs $75k-100k, 3.2% for AGIs over 100k)
Total tax: $20,018 (reported on 82.4% of returns)
01254:
$20,018
State:
$11,494
(% of AGI for various income ranges: 5.2% for AGIs below $10k, 4.8% for AGIs $10k-25k, 8.7% for AGIs $25k-50k, 9.8% for AGIs $50k-75k, 10.5% for AGIs $75k-100k, 18.3% for AGIs over 100k)
Earned income credit: $1,290 (reported on 5.0% of returns)
Here:
$1,290
State:
$1,518
Percentage of individuals using paid preparers for their 2004 taxes: 65.9%
Here:
66%
State:
58%
(% for various income ranges: 54.6% for AGIs below $10k, 63.9% for AGIs $10k-25k, 59.6% for AGIs $25k-50k, 67.5% for AGIs $50k-75k, 71.7% for AGIs $75k-100k, 79.5% for AGIs over 100k)
Likely homosexual households (counted as self-reported same-sex unmarried-partner households)
Lesbian couples: 0.0% of all households
Gay men: 1.6% of all households
Household received Food Stamps/SNAP in the past 12 months: 21 Household did not receive Food Stamps/SNAP in the past 12 months: 418
Women who had a birth in the past 12 months: 3 (4 now married, 0 unmarried) Women who did not have a birth in the past 12 months: 131 (91 now married, 36 unmarried)
Housing units in zip code 01254 with a mortgage: 189 (41 second mortgage, 42 both second mortgage and home equity loan) Median monthly owner costs for units with a mortgage: $2,149 Median monthly owner costs for units without a mortgage: $888
Residents with income below the poverty level in 2022:
This zip code:
5.4%
Whole state:
10.4%
Residents with income below 50% of the poverty level in 2022:
This zip code:
2.6%
Whole state:
5.1%
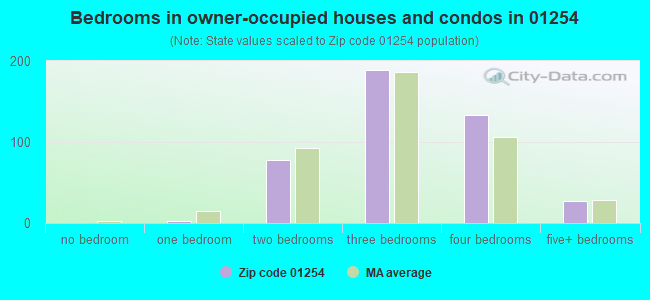
Median number of rooms in houses and condos:
Here:
7.1
State:
6.5
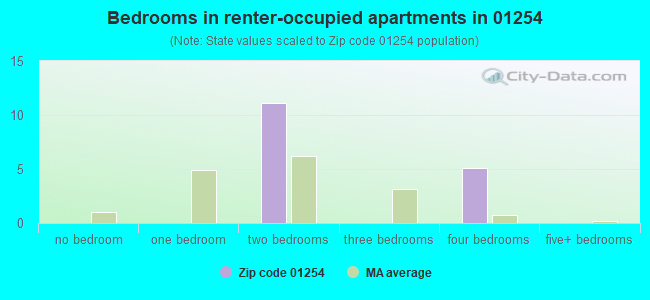
Median number of rooms in apartments:
Here:
4.2
State:
4.0
Notable locations in this zip code not listed on our city pages
Notable locations in zip code 01254: Hilltop Orchards (A), Richmond Fire Department Ambulance Service (B), Richmond Fire Department (C). Display/hide their locations on the map
Size of family households: 204 2-persons, 49 3-persons, 29 4-persons, 14 5-persons
Size of nonfamily households: 141 1-person, 12 2-persons
68 married couples with children.
2 single-parent households (2 women).
96.8% of residents of 01254 zip code speak English at home.
0.8% of residents speak Spanish at home (100% very well).
2.0% of residents speak other Indo-European language at home (63% very well, 37% well).
1.1% of residents speak Asian or Pacific Island language at home (20% very well, 80% well).
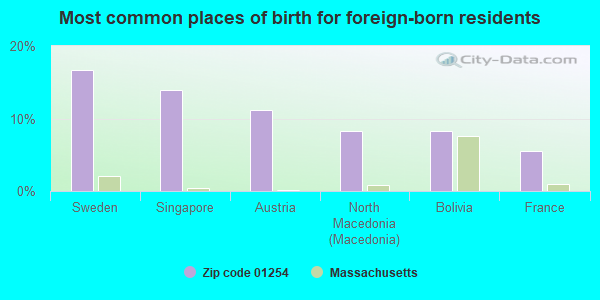
Foreign born population: 36 (3.8%) (50.5% of them are naturalized citizens)
This zip code:
3.8%
Whole state:
18.0%
17%Sweden
14%Singapore
11%Austria
8%North Macedonia (Macedonia)
8%Bolivia
6%France
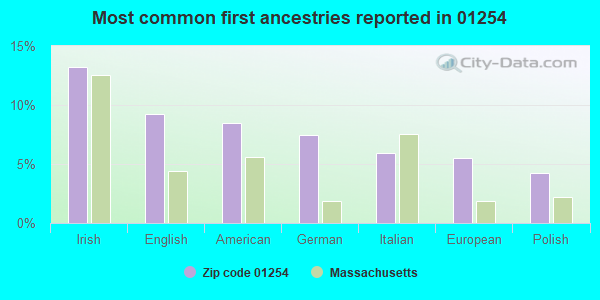
13%Irish
9%English
8%American
7%German
6%Italian
5%European
4%Polish
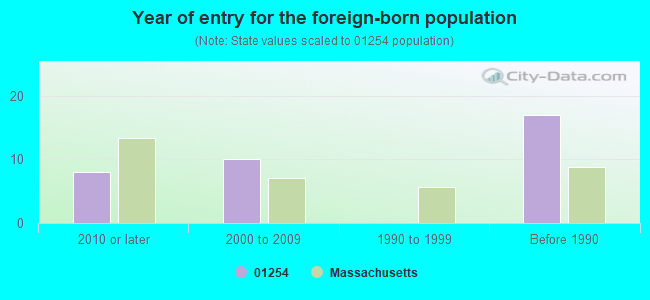
Year of entry for the foreign-born population
82010 or later
102000 to 2009
01990 to 1999
17Before 1990
Facilities with environmental interests located in this zip code:
RICHMOND CONSOLIDATED (1831 STATE RD in RICHMOND, MA)
(National Center for Education Statistics) - STATE ID-249005
GREEN MEADS FARM (RTE 41 in RICHMOND, MA)
(Resource Conservation and Recovery Act (tracking hazardous waste)) Organizations: GREEN MEADS FRAMS (CONTACT/OWNER)
RICHMOND (STATE ROAD in RICHMOND, MA)
AIR MINOR (AIRS/AFS) Business SIC classification: GENERAL GOVERNMENT
Housing units lacking complete plumbing facilities: 1.4% Housing units lacking complete kitchen facilities: 2.4%
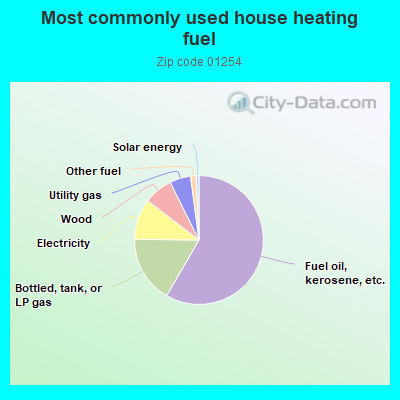
58.8%Fuel oil, kerosene, etc.
16.9%Bottled, tank, or LP gas
10.3%Electricity
7.3%Wood
5.3%Utility gas
1.4%Other fuel
0.7%Solar energy
Population in 1990: 1,134.
Place of birth for U.S.-born residents:
This state: 505
Northeast: 236
Midwest: 77
South: 101
West: 5
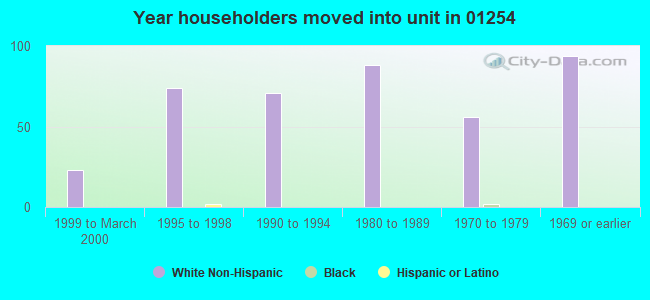
74% of the 01254 zip code residents lived in the same house 5 years ago. Out of people who lived in different houses, 71% lived in this county. Out of people who lived in different counties, 50% lived in Massachusetts.
95% of the 01254 zip code residents lived in the same house 1 year ago. Out of people who lived in different houses, 47% moved from this county. Out of people who lived in different houses, 16% moved from different state. Out of people who lived in different houses, 40% moved from abroad.
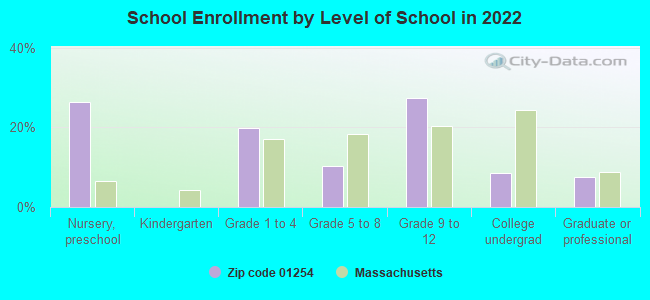
Private vs. public school enrollment:
Students in private schools in grades 1 to 8 (elementary and middle school): 4
Here:
13.7%
Massachusetts:
10.3%
Students in private schools in grades 9 to 12 (high school): 7
Here:
24.1%
Massachusetts:
12.3%
Students in private undergraduate colleges:
Here:
0.0%
Massachusetts:
51.2%
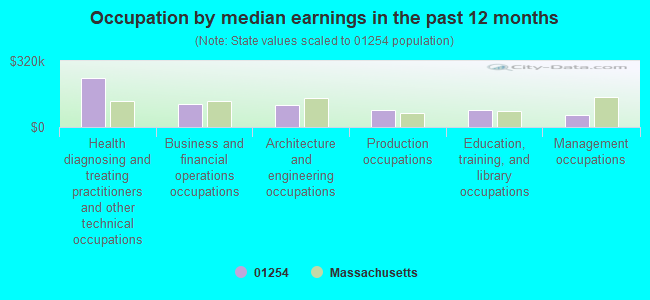
Occupation by median earnings in the past 12 months ($)
237,902Health diagnosing and treating practitioners and other technical occupations
113,578Business and financial operations occupations
108,719Architecture and engineering occupations
83,531Production occupations
82,474Education, training, and library occupations
56,679Management occupations
Top industries in this zip code by the number of employees in 2005:
Health Care and Social Assistance: Home Health Care Services (10-19 employees: 1 establishment)
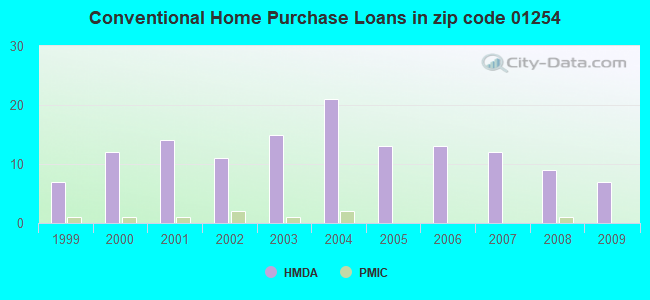
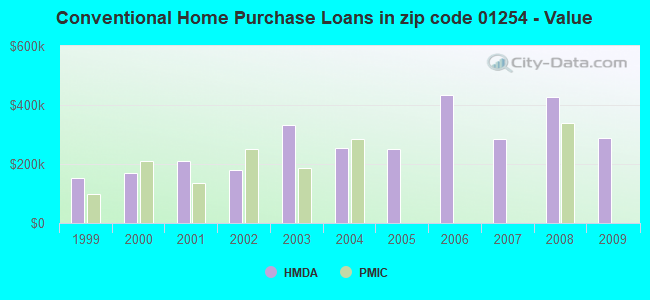
Detailed PMIC statistics for the following Tracts:9351.00
2002 - 2018 National Fire Incident Reporting System (NFIRS) incidents
Based on the data from the years 2002 - 2018 the average number of fire incidents per year is 11. The highest number of reported fire incidents - 20 took place in 2006, and the least - 3 in 2018. The data has a dropping trend.
When looking into fire subcategories, the most reports belonged to: Outside Fires (44.9%), and Structure Fires (43.3%).
Fire incident types reported to NFIRS in Zip Code 01254


 Nearest zip codes: 12029, 01266, 01260, 01240, 01262, 12125.


 Based on the data from the years 2002 - 2018 the average number of fire incidents per year is 11. The highest number of reported fire incidents - 20 took place in 2006, and the least - 3 in 2018. The data has a dropping trend.
 When looking into fire subcategories, the most reports belonged to: Outside Fires (44.9%), and Structure Fires (43.3%).