Estimated zip code population in 2022: 1,074 Zip code population in 2010: 1,373 Zip code population in 2000: 1,493
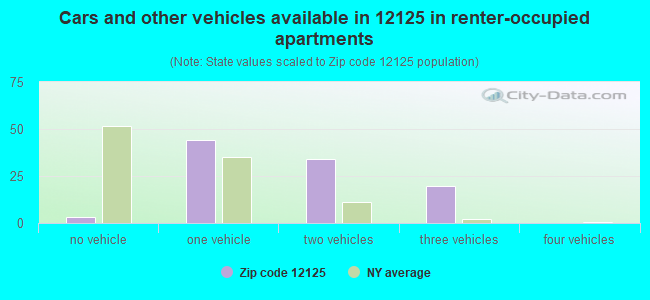
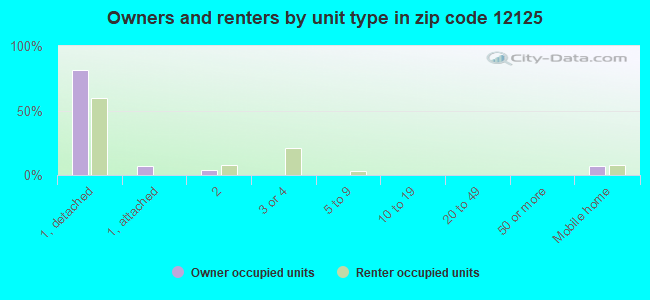
Houses and condos: 646 Renter-occupied apartments: 101
% of renters here:
23%
State:
46%
March 2022 cost of living index in zip code 12125: 95.6 (near average, U.S. average is 100)
Land area: 18.0 sq. mi. Water area: 0.0 sq. mi.
Population density: 60 people per square mile
(very low).
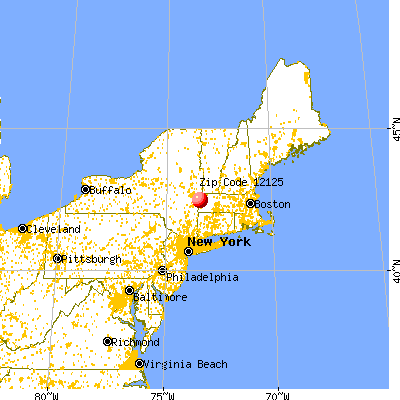
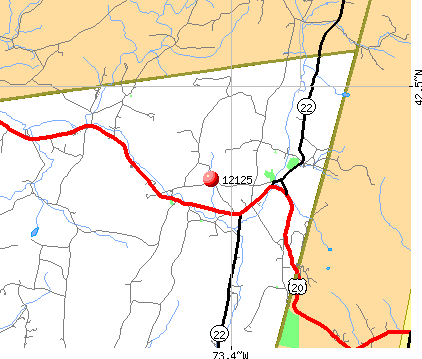
OSM Map
General Map
Google Map
MSN Map
OSM Map
General Map
Google Map
MSN Map
OSM Map
General Map
Google Map
MSN Map
OSM Map
General Map
Google Map
MSN Map
Please wait while loading the map...
Real estate property taxes paid for housing units in 2022:
This zip code:
1.5% ($3,773)
New York:
1.5% ($6,180)
Median real estate property taxes paid for housing units with mortgages in 2022: $3,255 Median real estate property taxes paid for housing units with no mortgage in 2022: $8,273
Business Search- 14 Million verified businesses
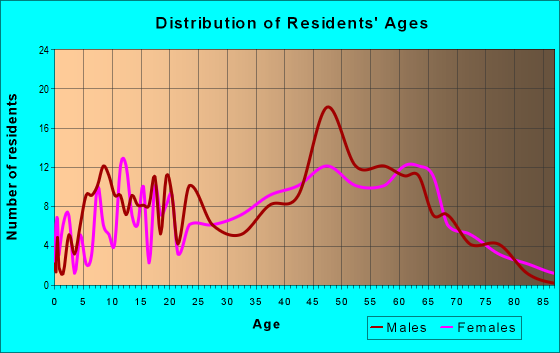
Males: 519
(48.4%)
Females: 554
(51.6%)
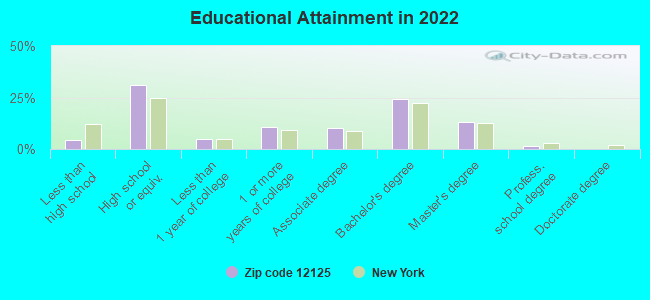
For population 25 years and over in 12125:
High school or higher: 95.1%
Bachelor's degree or higher: 38.5%
Graduate or professional degree: 14.4%
Unemployed: 2.2%
Mean travel time to work (commute): 27.3 minutes
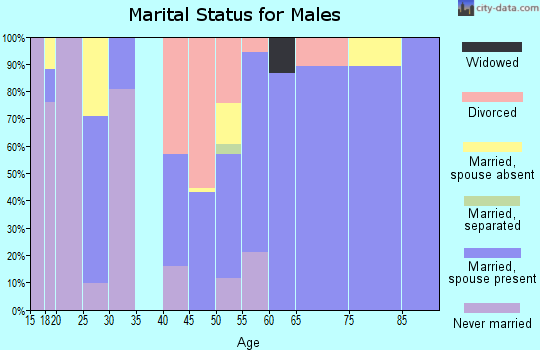
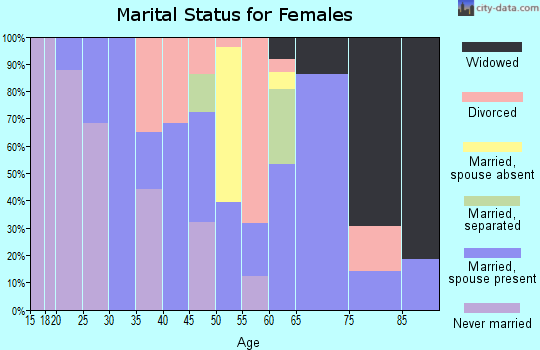
For population 15 years and over in 12125:
Never married: 27.2%
Now married: 48.7%
Separated: 5.6%
Widowed: 5.4%
Divorced: 13.1%
Zip code 12125 compared to state average:
Median house value below state average.
Unemployed percentage below state average.
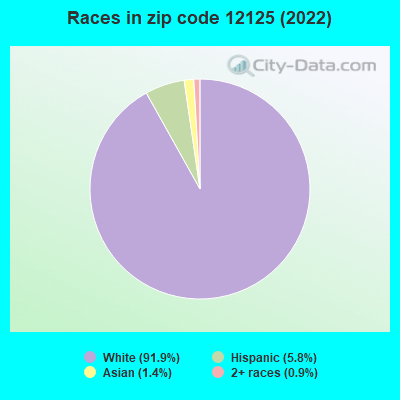
Black race population percentage significantly below state average.
Hispanic race population percentage significantly below state average.
Median age above state average.
Foreign-born population percentage significantly below state average.
Renting percentage below state average.
Length of stay since moving in significantly above state average.
Number of college students significantly below state average.
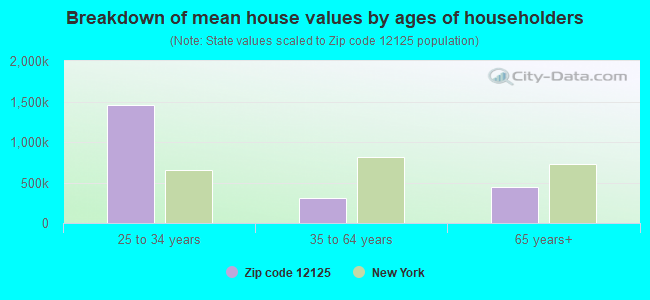
Estimated median house/condo value in 2022: $248,725
12125:
$248,725
New York:
$400,400
Median resident age:
This zip code:
44.5 years
New York median age:
40.0 years
Average household size:
This zip code:
2.2 people
New York:
2.5 people
Averages for the 2020 tax year for zip code 12125, filed in 2021:
Average Adjusted Gross Income (AGI) in 2020: $63,873 (Individual Income Tax Returns)
Here:
$63,873
State:
$90,930
Salary/wage: $54,919 (reported on 79.5% of returns)
Here:
$54,919
State:
$72,104
(% of AGI for various income ranges: 1098.7% for AGIs below $25k, 3495.3% for AGIs $25k-50k, 8390.0% for AGIs $50k-75k, 9040.0% for AGIs $75k-100k, 12956.0% for AGIs $100k-200k)
Taxable interest for individuals: $561 (reported on 29.5% of returns)
This zip code:
$561
New York:
$3,075
(% of AGI for various income ranges: 7.3% for AGIs below $25k, 10.0% for AGIs $25k-50k, 38.6% for AGIs $50k-75k, 38.0% for AGIs $75k-100k, 64.0% for AGIs $100k-200k)
Ordinary dividends: $8,520 (reported on 19.2% of returns)
Here:
$8,520
State:
$11,095
(% of AGI for various income ranges: 71.3% for AGIs below $25k, 25.3% for AGIs $25k-50k, 161.4% for AGIs $50k-75k, 2020.0% for AGIs $100k-200k)
Net capital gain/loss in AGI: +$16,609 (reported on 14.1% of returns)
Here:
+$16,609
State:
+$44,925
(% of AGI for various income ranges: 10.7% for AGIs below $25k, 29.5% for AGIs $25k-50k, 27.1% for AGIs $50k-75k, 1360.0% for AGIs $100k-200k)
Profit/loss from business: +$8,900 (reported on 15.4% of returns)
Here:
+$8,900
State:
+$14,940
(% of AGI for various income ranges: 104.7% for AGIs below $25k, 203.2% for AGIs $25k-50k, 345.7% for AGIs $50k-75k, 566.0% for AGIs $100k-200k)
Taxable individual retirement arrangement distribution: $23,083 (reported on 7.7% of returns)
12125:
$23,083
New York:
$19,609
(% of AGI for various income ranges: 225.3% for AGIs $25k-50k, 1914.0% for AGIs $100k-200k)
Total itemized deductions: $35,150 (reported on 5.1% of returns)
Here:
$35,150
State:
$39,326
(% of AGI for various income ranges: 318.7% for AGIs below $25k, 1856.0% for AGIs $100k-200k)
Charity contributions: $11,200 (reported on 3.8% of returns)
Here:
$11,200
State:
$15,420
(% of AGI for various income ranges: 672.0% for AGIs $100k-200k)
Taxes paid: $9,525 (reported on 5.1% of returns)
12125:
$9,525
State:
$9,183
(% of AGI for various income ranges: 762.0% for AGIs $100k-200k)
Earned income credit: $2,042 (reported on 15.4% of returns)
Here:
$2,042
State:
$2,138
(% of AGI for various income ranges: 90.7% for AGIs below $25k, 57.4% for AGIs $25k-50k)
Percentage of individuals using paid preparers for their 2020 taxes: 92.3%
Here:
92%
State:
95%
(% for various income ranges: 91.3% for AGIs below $25k, 91.7% for AGIs $25k-50k, 91.7% for AGIs $50k-75k, 87.5% for AGIs $75k-100k, 100.0% for AGIs $100k-200k, 100.0% for AGIs over 200k)
Averages for the 2012 tax year for zip code 12125, filed in 2013:
Average Adjusted Gross Income (AGI) in 2012: $54,500 (Individual Income Tax Returns)
Here:
$54,500
State:
$77,088
Salary/wage: $41,471 (reported on 83.8% of returns)
Here:
$41,471
State:
$60,593
(% of AGI for various income ranges: 71.0% for AGIs below $25k, 77.8% for AGIs $25k-50k, 78.2% for AGIs $50k-75k, 71.9% for AGIs $75k-100k, 49.6% for AGIs $100k-200k)
Taxable interest for individuals: $946 (reported on 35.1% of returns)
This zip code:
$946
New York:
$3,125
(% of AGI for various income ranges: 0.4% for AGIs below $25k, 0.6% for AGIs $25k-50k, 0.5% for AGIs $50k-75k, 0.4% for AGIs $75k-100k, 0.8% for AGIs $100k-200k)
Ordinary dividends: $8,473 (reported on 20.3% of returns)
Here:
$8,473
State:
$10,299
(% of AGI for various income ranges: 2.0% for AGIs below $25k, 1.0% for AGIs $25k-50k, 0.9% for AGIs $50k-75k, 1.8% for AGIs $75k-100k, 5.4% for AGIs $100k-200k)
Net capital gain/loss in AGI: +$1,480 (reported on 13.5% of returns)
Here:
+$1,480
State:
+$42,474
(% of AGI for various income ranges: 0.1% for AGIs $50k-75k, 1.0% for AGIs $100k-200k)
Profit/loss from business: +$7,940 (reported on 20.3% of returns)
Here:
+$7,940
State:
+$16,168
(% of AGI for various income ranges: 9.8% for AGIs below $25k, 3.0% for AGIs $25k-50k, 3.4% for AGIs $100k-200k)
Taxable individual retirement arrangement distribution: $9,233 (reported on 8.1% of returns)
12125:
$9,233
New York:
$17,621
Total itemized deductions: $25,035 (21% of AGI, reported on 27.0% of returns)
Here:
$25,035
State:
$34,985
Here:
20.7% of AGI
State:
21.3% of AGI
(% of AGI for various income ranges: 8.1% for AGIs below $25k, 8.1% for AGIs $25k-50k, 11.0% for AGIs $50k-75k, 15.3% for AGIs $75k-100k, 14.8% for AGIs $100k-200k)
Charity contributions: $2,324 (reported on 23.0% of returns)
Here:
$2,324
State:
$5,572
(% of AGI for various income ranges: 1.0% for AGIs $25k-50k, 1.0% for AGIs $50k-75k, 1.2% for AGIs $75k-100k, 1.1% for AGIs $100k-200k)
Taxes paid: $13,450 (reported on 27.0% of returns)
12125:
$13,450
State:
$18,656
(% of AGI for various income ranges: 2.1% for AGIs below $25k, 2.9% for AGIs $25k-50k, 5.0% for AGIs $50k-75k, 8.9% for AGIs $75k-100k, 9.1% for AGIs $100k-200k)
Earned income credit: $1,869 (reported on 17.6% of returns)
Here:
$1,869
State:
$2,230
(% of AGI for various income ranges: 5.1% for AGIs below $25k, 0.7% for AGIs $25k-50k)
Percentage of individuals using paid preparers for their 2012 taxes: 60.8%
Here:
61%
State:
66%
(% for various income ranges: 53.3% for AGIs below $25k, 57.1% for AGIs $25k-50k, 70.0% for AGIs $50k-75k, 80.0% for AGIs $75k-100k, 75.0% for AGIs $100k-200k)
Averages for the 2004 tax year for zip code 12125, filed in 2005:
Average Adjusted Gross Income (AGI) in 2004: $43,712 (Individual Income Tax Returns)
Here:
$43,712
State:
$59,519
Salary/wage: $38,085 (reported on 81.4% of returns)
Here:
$38,085
State:
$50,673
(% of AGI for various income ranges: 102.4% for AGIs below $10k, 71.7% for AGIs $10k-25k, 76.8% for AGIs $25k-50k, 80.4% for AGIs $50k-75k, 76.9% for AGIs $75k-100k, 55.8% for AGIs over 100k)
Taxable interest for individuals: $1,533 (reported on 52.9% of returns)
This zip code:
$1,533
New York:
$2,377
(% of AGI for various income ranges: 3.7% for AGIs below $10k, 4.3% for AGIs $10k-25k, 1.4% for AGIs $25k-50k, 1.7% for AGIs $50k-75k, 0.9% for AGIs $75k-100k, 1.9% for AGIs over 100k)
Taxable dividends: $5,096 (reported on 28.2% of returns)
Here:
$5,096
State:
$5,394
(% of AGI for various income ranges: 5.3% for AGIs below $10k, 2.3% for AGIs $10k-25k, 2.9% for AGIs $25k-50k, 1.6% for AGIs $50k-75k, 1.8% for AGIs $75k-100k, 5.6% for AGIs over 100k)
Net capital gain/loss: +$13,916 (reported on 20.9% of returns)
Here:
+$13,916
State:
+$23,581
(% of AGI for various income ranges: -1.6% for AGIs below $10k, 0.4% for AGIs $10k-25k, 1.9% for AGIs $25k-50k, 4.1% for AGIs $50k-75k, -0.3% for AGIs $75k-100k, 17.5% for AGIs over 100k)
Profit/loss from business: +$9,400 (reported on 18.3% of returns)
Here:
+$9,400
State:
+$13,809
(% of AGI for various income ranges: 9.1% for AGIs below $10k, 6.0% for AGIs $10k-25k, 4.7% for AGIs $25k-50k, 1.4% for AGIs $50k-75k, 6.0% for AGIs over 100k)
IRA payment deduction: $2,571 (reported on 2.8% of returns)
12125:
$2,571
New York:
$3,115
Total itemized deductions: $17,891 (21% of AGI, reported on 31.2% of returns)
Here:
$17,891
State:
$25,864
Here:
21.2% of AGI
State:
21.9% of AGI
(% of AGI for various income ranges: 8.5% for AGIs $10k-25k, 10.6% for AGIs $25k-50k, 14.2% for AGIs $50k-75k, 15.0% for AGIs $75k-100k, 14.4% for AGIs over 100k)
Charity contributions deductions: $2,291 (3% of AGI, reported on 26.6% of returns)
Here:
$2,291
State:
$4,439
Here:
2.6% of AGI
State:
3.6% of AGI
(% of AGI for various income ranges: 0.5% for AGIs $10k-25k, 0.6% for AGIs $25k-50k, 1.6% for AGIs $50k-75k, 1.4% for AGIs $75k-100k, 2.2% for AGIs over 100k)
Total tax: $6,244 (reported on 80.2% of returns)
12125:
$6,244
State:
$11,730
(% of AGI for various income ranges: 3.7% for AGIs below $10k, 5.1% for AGIs $10k-25k, 7.4% for AGIs $25k-50k, 8.9% for AGIs $50k-75k, 10.4% for AGIs $75k-100k, 18.9% for AGIs over 100k)
Earned income credit: $1,551 (reported on 13.3% of returns)
Here:
$1,551
State:
$1,757
Percentage of individuals using paid preparers for their 2004 taxes: 63.5%
Here:
64%
State:
67%
(% for various income ranges: 54.7% for AGIs below $10k, 64.4% for AGIs $10k-25k, 61.1% for AGIs $25k-50k, 71.3% for AGIs $50k-75k, 62.5% for AGIs $75k-100k, 77.4% for AGIs over 100k)
Household received Food Stamps/SNAP in the past 12 months: 72 Household did not receive Food Stamps/SNAP in the past 12 months: 364
Women who had a birth in the past 12 months: 44 (34 now married, 10 unmarried) Women who did not have a birth in the past 12 months: 185 (52 now married, 134 unmarried)
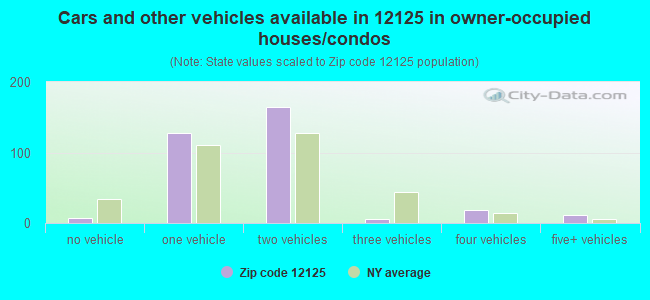
Housing units in zip code 12125 with a mortgage: 252 (20 second mortgage, 20 both second mortgage and home equity loan) Median monthly owner costs for units with a mortgage: $1,390 Median monthly owner costs for units without a mortgage: $980
Residents with income below the poverty level in 2022:
This zip code:
14.6%
Whole state:
14.3%
Residents with income below 50% of the poverty level in 2022:
This zip code:
9.6%
Whole state:
6.8%
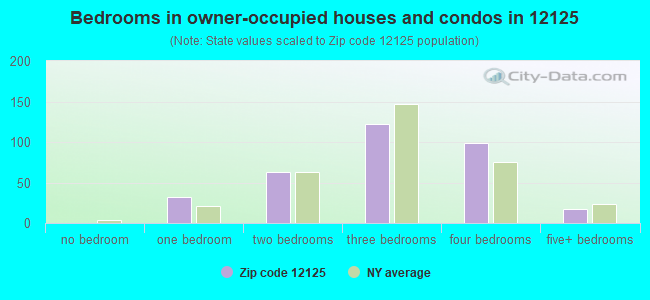
Median number of rooms in houses and condos:
Here:
5.4
State:
6.3
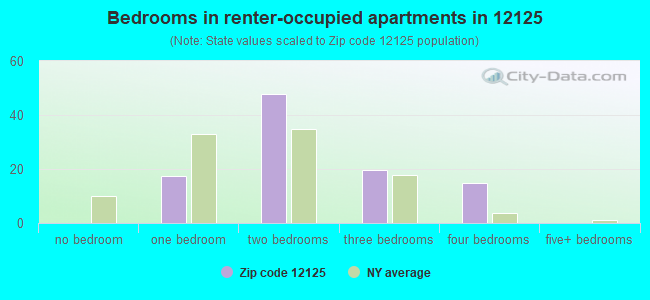
Median number of rooms in apartments:
Here:
4.9
State:
3.8
Notable locations in this zip code not listed on our city pages
Cemeteries: Immaculate Conception Cemetery (1), Mott Cemetery (2), Cornwall-Tilden Cemetery (3), Cemetery of the Evergreens (4). Display/hide their locations on the map
In group quarters: 138 (-1 institutionalized population)
Size of family households: 144 2-persons, 34 3-persons, 40 4-persons, 5 5-persons, 12 7-or-more-persons
Size of nonfamily households: 150 1-person, 48 2-persons, 6 4-persons
63 married couples with children.
52 single-parent households (19 men, 33 women).
94.1% of residents of 12125 zip code speak English at home.
1.9% of residents speak Spanish at home (100% not at all).
3.5% of residents speak other Indo-European language at home (14% very well, 58% well, 28% not well).
0.3% of residents speak Asian or Pacific Island language at home (100% very well).
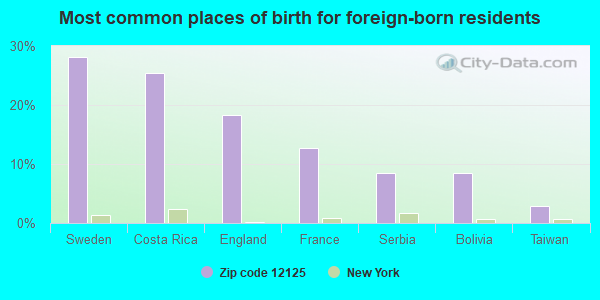
Foreign born population: 70 (6.5%) (30.2% of them are naturalized citizens)
This zip code:
6.5%
Whole state:
22.7%
28%Sweden
25%Costa Rica
18%England
13%France
8%Serbia
8%Bolivia
3%Taiwan
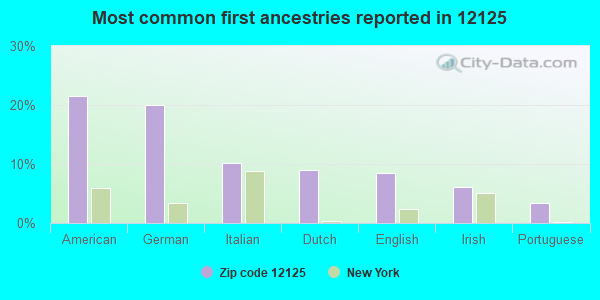
22%American
20%German
10%Italian
9%Dutch
8%English
6%Irish
3%Portuguese
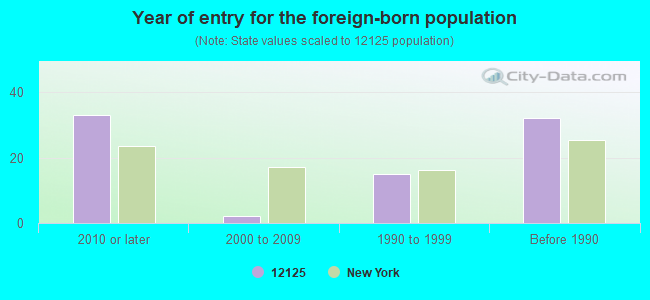
Year of entry for the foreign-born population
332010 or later
22000 to 2009
151990 to 1999
32Before 1990
Facilities with environmental interests located in this zip code:
COLUMBIA COUNTY OF DPW BIN 3222830 (ADAMS CROSSING RD OVER in NEW LEBANON, NY)
(Resource Conservation and Recovery Act (tracking hazardous waste)) Organizations: COLUMBIA CO DEPT OF PUBLIC WKS (CONTACT/OWNER)
COLUMBIA COUNTY OF DPW BIN 3222880 (CEMETERY RD OVER WYOMANOCK CRK in NEW LEBANON, NY)
(Resource Conservation and Recovery Act (tracking hazardous waste)) Organizations: COLUMBIA CO DEPT OF PUBLIC WKS (CONTACT/OWNER)
AMERADA HESS STATION 32421 (14590 RTE 22 AT RTE 20 in NEW LEBANON, NY)
Conditionally Exempt Small Quantity Generators, less than 100 kg/month of hazardous waste (Resource Conservation and Recovery Act (tracking hazardous waste)) - notification Organizations: AMERADA HESS CORP (CONTACT/OWNER)
BERKSHIRE CV JOINTS INC (501 RTE 20 in NEW LEBANON, NY)
Conditionally Exempt Small Quantity Generators, less than 100 kg/month of hazardous waste (Resource Conservation and Recovery Act (tracking hazardous waste)) - notification Organizations: WARD HATCH REALTY (CONTACT/OWNER)
COLUMBIA COUNTY OF DPW BIN 3222890 (OLD POST RD OVER WYOMANOCK CRK in NEW LEBANON, NY)
Small Quantity Generators, between 100 kg and 1000 kg of hazardous waste/month (Resource Conservation and Recovery Act (tracking hazardous waste)) - notification Organizations: COLUMBIA COUNTY DEPT OF PUBLIC WORKS (CONTACT/OWNER)
Housing units lacking complete plumbing facilities: 7.6% Housing units lacking complete kitchen facilities: 5.8%
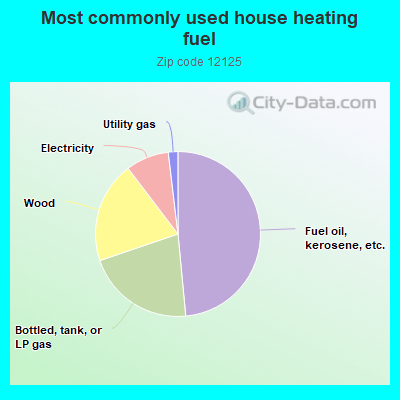
48.8%Fuel oil, kerosene, etc.
21.4%Bottled, tank, or LP gas
20.0%Wood
8.5%Electricity
1.9%Utility gas
Population in 1990: 557. Population change in the 1990s: +936 (+168.0%).
Place of birth for U.S.-born residents:
This state: 482
Northeast: 428
Midwest: 14
South: 41
West: 26
57% of the 12125 zip code residents lived in the same house 5 years ago. Out of people who lived in different houses, 32% lived in this county. Out of people who lived in different counties, 50% lived in New York.
93% of the 12125 zip code residents lived in the same house 1 year ago. Out of people who lived in different houses, 46% moved from this county. Out of people who lived in different houses, 11% moved from different county within same state. Out of people who lived in different houses, 41% moved from different state.
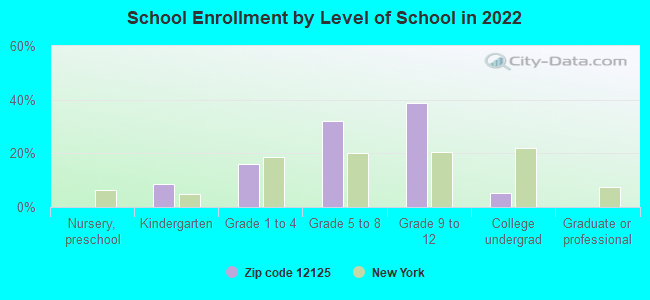
Private vs. public school enrollment:
Students in private schools in grades 1 to 8 (elementary and middle school):
Here:
0.0%
New York:
15.6%
Students in private schools in grades 9 to 12 (high school): 17
Here:
37.8%
New York:
15.0%
Students in private undergraduate colleges: 6
Here:
100.0%
New York:
39.2%
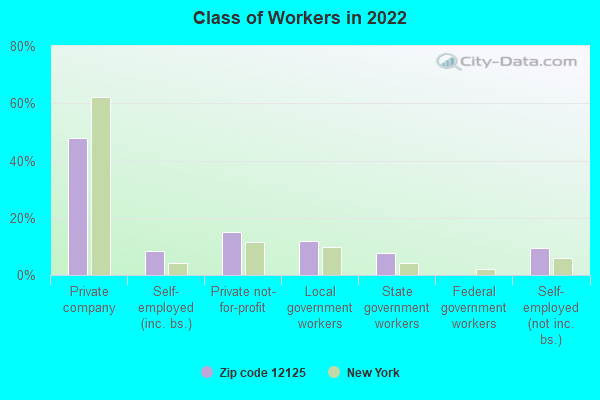
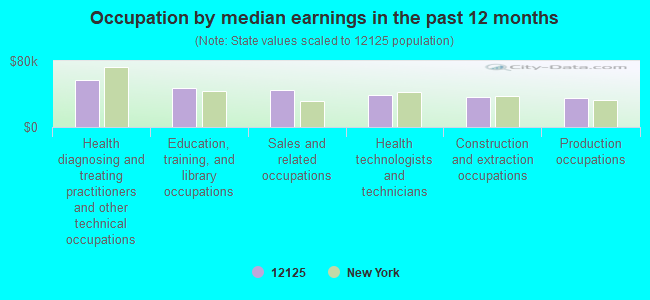
Occupation by median earnings in the past 12 months ($)
57,571Health diagnosing and treating practitioners and other technical occupations
47,753Education, training, and library occupations
44,750Sales and related occupations
38,616Health technologists and technicians
35,982Construction and extraction occupations
35,115Production occupations
Top industries in this zip code by the number of employees in 2005:
Educational Services: Elementary and Secondary Schools (50-99: 1, 10-19: 1)
Accommodation and Food Services: Limited-Service Restaurants (20-49: 1, 1-4: 1)
Other Services (except Public Administration): Religious Organizations (10-19: 1, 1-4: 2)
Accommodation and Food Services: Food Service Contractors (10-19: 1)
Professional, Scientific, and Technical Services: Engineering Services (10-19: 1)
People in group quarters in 2010:
51 people in workers' group living quarters and job corps centers
29 people in other noninstitutional facilities
People in group quarters in 2000:
96 people in unknown juvenile institutions
16 people in religious group quarters
3 people in other nonhousehold living situations
2002 - 2018 National Fire Incident Reporting System (NFIRS) incidents
Based on the data from the years 2002 - 2018 the average number of fires per year is 10. The highest number of fire incidents - 18 took place in 2009, and the least - 1 in 2002. The data has a rising trend.
When looking into fire subcategories, the most incidents belonged to: Structure Fires (58.9%), and Outside Fires (30.7%).
Fire incident types reported to NFIRS in Zip Code 12125


 Nearest zip codes: 12029, 12195, 12168, 01254, 12062, 12169.
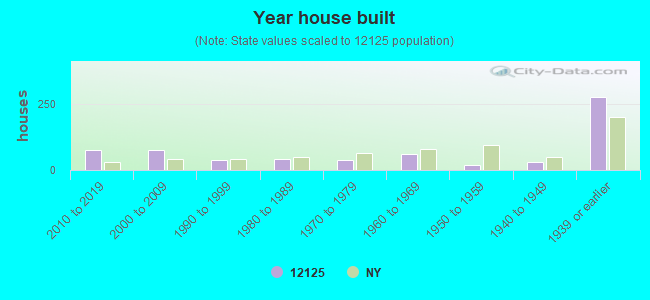


 Based on the data from the years 2002 - 2018 the average number of fires per year is 10. The highest number of fire incidents - 18 took place in 2009, and the least - 1 in 2002. The data has a rising trend.
 When looking into fire subcategories, the most incidents belonged to: Structure Fires (58.9%), and Outside Fires (30.7%).