Estimated zip code population in 2022: 1,176 Zip code population in 2010: 1,277 Zip code population in 2000: 1,171
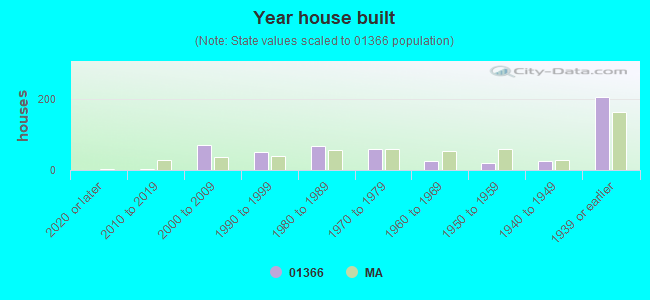
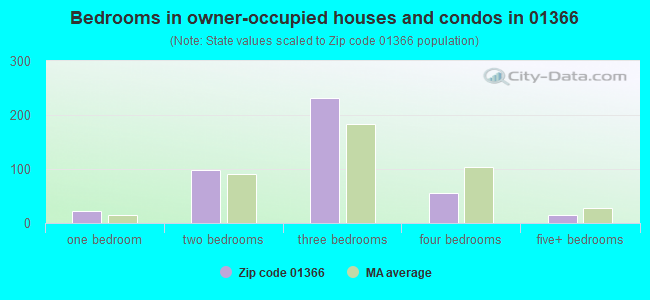
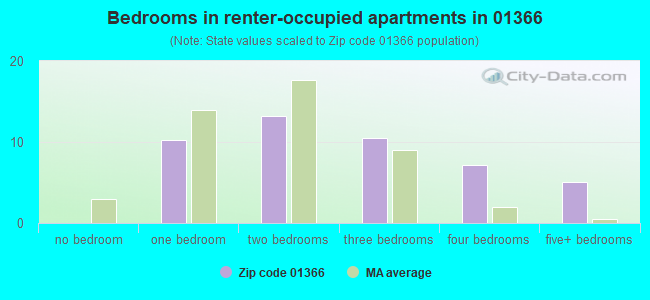
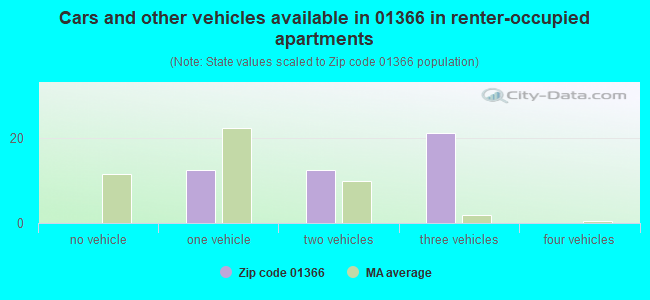
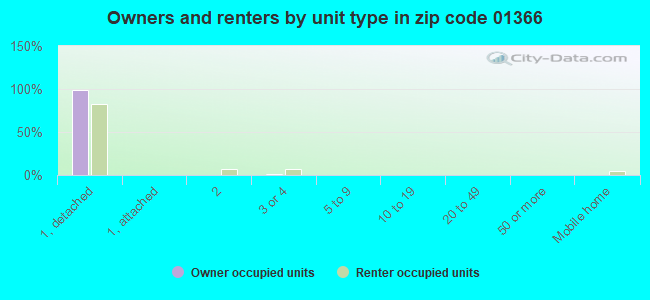
Houses and condos: 535 Renter-occupied apartments: 46
% of renters here:
10%
State:
38%
March 2022 cost of living index in zip code 01366: 110.5 (more than average, U.S. average is 100)
Land area: 40.4 sq. mi. Water area: 0.6 sq. mi.
Population density: 29 people per square mile
(very low).
OSM Map
Google Map
MSN Map
OSM Map
General Map
Google Map
MSN Map
OSM Map
Google Map
MSN Map
OSM Map
Google Map
MSN Map
Please wait while loading the map...
Real estate property taxes paid for housing units in 2022:
This zip code:
1.1% ($4,298)
Massachusetts:
1.0% ($5,536)
Median real estate property taxes paid for housing units with mortgages in 2022: $4,216 (1.1%) Median real estate property taxes paid for housing units with no mortgage in 2022: $4,373 (1.2%)
Estimated median house/condo value in 2022: $382,323
01366:
$382,323
Massachusetts:
$534,700
Median resident age:
This zip code:
52.7 years
Massachusetts median age:
40.3 years
Average household size:
This zip code:
2.3 people
Massachusetts:
2.4 people
Averages for the 2020 tax year for zip code 01366, filed in 2021:
Average Adjusted Gross Income (AGI) in 2020: $83,532 (Individual Income Tax Returns)
Here:
$83,532
State:
$105,130
Salary/wage: $74,114 (reported on 75.4% of returns)
Here:
$74,114
State:
$82,951
(% of AGI for various income ranges: 937.0% for AGIs below $25k, 3615.0% for AGIs $25k-50k, 6624.0% for AGIs $50k-75k, 10278.0% for AGIs $75k-100k, 15170.0% for AGIs $100k-200k)
Taxable interest for individuals: $770 (reported on 50.8% of returns)
This zip code:
$770
Massachusetts:
$2,361
(% of AGI for various income ranges: 20.0% for AGIs below $25k, 23.8% for AGIs $25k-50k, 54.0% for AGIs $50k-75k, 74.0% for AGIs $75k-100k, 75.6% for AGIs $100k-200k)
Ordinary dividends: $6,144 (reported on 27.7% of returns)
Here:
$6,144
State:
$10,365
(% of AGI for various income ranges: 100.0% for AGIs below $25k, 22.5% for AGIs $25k-50k, 430.0% for AGIs $50k-75k, 238.9% for AGIs $100k-200k)
Net capital gain/loss in AGI: +$9,612 (reported on 26.2% of returns)
Here:
+$9,612
State:
+$48,178
(% of AGI for various income ranges: 20.0% for AGIs below $25k, 258.0% for AGIs $50k-75k, 604.4% for AGIs $100k-200k)
Profit/loss from business: +$20,817 (reported on 18.5% of returns)
Here:
+$20,817
State:
+$20,792
(% of AGI for various income ranges: 171.0% for AGIs below $25k, 365.0% for AGIs $25k-50k, 520.0% for AGIs $50k-75k, 1972.2% for AGIs $100k-200k)
Taxable individual retirement arrangement distribution: $16,914 (reported on 10.8% of returns)
01366:
$16,914
Massachusetts:
$22,790
(% of AGI for various income ranges: 182.0% for AGIs below $25k, 454.0% for AGIs $50k-75k, 861.1% for AGIs $100k-200k)
Total itemized deductions: $26,400 (reported on 9.2% of returns)
Here:
$26,400
State:
$36,722
(% of AGI for various income ranges: 1136.0% for AGIs $50k-75k, 1128.9% for AGIs $100k-200k)
Charity contributions: $6,975 (reported on 6.2% of returns)
Here:
$6,975
State:
$12,529
(% of AGI for various income ranges: 310.0% for AGIs $100k-200k)
Taxes paid: $8,583 (reported on 9.2% of returns)
01366:
$8,583
State:
$8,782
(% of AGI for various income ranges: 408.0% for AGIs $50k-75k, 345.6% for AGIs $100k-200k)
Earned income credit: $1,640 (reported on 7.7% of returns)
Here:
$1,640
State:
$1,909
(% of AGI for various income ranges: 82.0% for AGIs below $25k)
Percentage of individuals using paid preparers for their 2020 taxes: 92.3%
Here:
92%
State:
92%
(% for various income ranges: 88.9% for AGIs below $25k, 91.7% for AGIs $25k-50k, 100.0% for AGIs $50k-75k, 87.5% for AGIs $75k-100k, 92.9% for AGIs $100k-200k, 100.0% for AGIs over 200k)
Averages for the 2012 tax year for zip code 01366, filed in 2013:
Average Adjusted Gross Income (AGI) in 2012: $65,738 (Individual Income Tax Returns)
Here:
$65,738
State:
$81,425
Salary/wage: $55,977 (reported on 81.0% of returns)
Here:
$55,977
State:
$64,752
(% of AGI for various income ranges: 63.8% for AGIs below $25k, 68.3% for AGIs $25k-50k, 66.3% for AGIs $50k-75k, 68.8% for AGIs $75k-100k, 70.5% for AGIs $100k-200k)
Taxable interest for individuals: $643 (reported on 51.7% of returns)
This zip code:
$643
Massachusetts:
$2,136
(% of AGI for various income ranges: 1.7% for AGIs below $25k, 0.8% for AGIs $25k-50k, 0.7% for AGIs $50k-75k, 0.2% for AGIs $75k-100k, 0.3% for AGIs $100k-200k)
Ordinary dividends: $5,044 (reported on 27.6% of returns)
Here:
$5,044
State:
$9,473
(% of AGI for various income ranges: 3.9% for AGIs below $25k, 4.6% for AGIs $25k-50k, 2.7% for AGIs $50k-75k, 1.7% for AGIs $100k-200k)
Net capital gain/loss in AGI: +$2,679 (reported on 24.1% of returns)
Here:
+$2,679
State:
+$31,437
(% of AGI for various income ranges: 0.7% for AGIs $25k-50k, 2.5% for AGIs $50k-75k, 0.9% for AGIs $100k-200k)
Profit/loss from business: +$15,057 (reported on 24.1% of returns)
Here:
+$15,057
State:
+$20,662
(% of AGI for various income ranges: 16.4% for AGIs below $25k, 5.0% for AGIs $25k-50k, 11.2% for AGIs $50k-75k, 4.1% for AGIs $100k-200k)
Taxable individual retirement arrangement distribution: $10,638 (reported on 13.8% of returns)
01366:
$10,638
Massachusetts:
$18,892
Total itemized deductions: $21,535 (22% of AGI, reported on 44.8% of returns)
Here:
$21,535
State:
$28,907
Here:
21.6% of AGI
State:
18.2% of AGI
(% of AGI for various income ranges: 23.6% for AGIs below $25k, 11.2% for AGIs $25k-50k, 14.6% for AGIs $50k-75k, 14.9% for AGIs $75k-100k, 14.6% for AGIs $100k-200k)
Charity contributions: $2,076 (reported on 36.2% of returns)
Here:
$2,076
State:
$4,208
(% of AGI for various income ranges: 1.6% for AGIs $25k-50k, 0.6% for AGIs $50k-75k, 0.9% for AGIs $75k-100k, 1.4% for AGIs $100k-200k)
Taxes paid: $10,168 (reported on 43.1% of returns)
01366:
$10,168
State:
$13,303
(% of AGI for various income ranges: 4.6% for AGIs below $25k, 4.7% for AGIs $25k-50k, 6.1% for AGIs $50k-75k, 6.1% for AGIs $75k-100k, 7.6% for AGIs $100k-200k)
Earned income credit: $1,760 (reported on 8.6% of returns)
Here:
$1,760
State:
$1,971
(% of AGI for various income ranges: 4.1% for AGIs below $25k)
Percentage of individuals using paid preparers for their 2012 taxes: 56.9%
Here:
57%
State:
56%
(% for various income ranges: 50.0% for AGIs below $25k, 53.8% for AGIs $25k-50k, 60.0% for AGIs $50k-75k, 60.0% for AGIs $75k-100k, 66.7% for AGIs $100k-200k)
Averages for the 2004 tax year for zip code 01366, filed in 2005:
Average Adjusted Gross Income (AGI) in 2004: $48,754 (Individual Income Tax Returns)
Here:
$48,754
State:
$62,877
Salary/wage: $42,747 (reported on 77.8% of returns)
Here:
$42,747
State:
$52,969
(% of AGI for various income ranges: 84.1% for AGIs below $10k, 54.5% for AGIs $10k-25k, 71.1% for AGIs $25k-50k, 71.6% for AGIs $50k-75k, 71.1% for AGIs $75k-100k, 64.5% for AGIs over 100k)
Taxable interest for individuals: $965 (reported on 67.6% of returns)
This zip code:
$965
Massachusetts:
$1,945
(% of AGI for various income ranges: 5.9% for AGIs below $10k, 4.6% for AGIs $10k-25k, 1.4% for AGIs $25k-50k, 0.8% for AGIs $50k-75k, 1.2% for AGIs $75k-100k, 0.9% for AGIs over 100k)
Taxable dividends: $2,659 (reported on 35.8% of returns)
Here:
$2,659
State:
$5,323
(% of AGI for various income ranges: 5.6% for AGIs below $10k, 5.4% for AGIs $10k-25k, 1.4% for AGIs $25k-50k, 3.1% for AGIs $50k-75k, 2.2% for AGIs $75k-100k, 0.4% for AGIs over 100k)
Net capital gain/loss: +$10,123 (reported on 27.5% of returns)
Here:
+$10,123
State:
+$20,377
(% of AGI for various income ranges: -2.4% for AGIs below $10k, -1.5% for AGIs $10k-25k, 0.3% for AGIs $25k-50k, 2.0% for AGIs $50k-75k, 6.6% for AGIs $75k-100k, 12.9% for AGIs over 100k)
Profit/loss from business: +$15,808 (reported on 24.7% of returns)
Here:
+$15,808
State:
+$17,837
(% of AGI for various income ranges: 12.0% for AGIs below $10k, 8.0% for AGIs $10k-25k, 10.4% for AGIs $25k-50k, 3.8% for AGIs $50k-75k, 9.6% for AGIs $75k-100k, 8.6% for AGIs over 100k)
IRA payment deduction: $2,765 (reported on 2.9% of returns)
01366:
$2,765
Massachusetts:
$3,100
Total itemized deductions: $17,836 (25% of AGI, reported on 46.6% of returns)
Here:
$17,836
State:
$22,573
Here:
24.5% of AGI
State:
19.5% of AGI
(% of AGI for various income ranges: 23.5% for AGIs $10k-25k, 16.9% for AGIs $25k-50k, 15.8% for AGIs $50k-75k, 20.6% for AGIs $75k-100k, 15.4% for AGIs over 100k)
Charity contributions deductions: $2,252 (3% of AGI, reported on 42.4% of returns)
Here:
$2,252
State:
$3,295
Here:
3.0% of AGI
State:
2.7% of AGI
(% of AGI for various income ranges: 2.1% for AGIs $10k-25k, 1.3% for AGIs $25k-50k, 2.0% for AGIs $50k-75k, 2.7% for AGIs $75k-100k, 1.9% for AGIs over 100k)
Total tax: $6,262 (reported on 83.4% of returns)
01366:
$6,262
State:
$11,494
(% of AGI for various income ranges: 2.7% for AGIs below $10k, 6.1% for AGIs $10k-25k, 7.6% for AGIs $25k-50k, 8.7% for AGIs $50k-75k, 9.4% for AGIs $75k-100k, 16.2% for AGIs over 100k)
Earned income credit: $977 (reported on 7.3% of returns)
Here:
$977
State:
$1,518
Percentage of individuals using paid preparers for their 2004 taxes: 59.0%
Here:
59%
State:
58%
(% for various income ranges: 48.1% for AGIs below $10k, 57.3% for AGIs $10k-25k, 63.7% for AGIs $25k-50k, 59.8% for AGIs $50k-75k, 62.9% for AGIs $75k-100k, 64.4% for AGIs over 100k)
Churches in zip code 01366 include: Sisters of the Assumption Church (A), Saint Peters Church (B), Petersham Congregational Church (C). Display/hide their locations on the map
Cemeteries: Northwest Cemetery (1), Williams Cemetery (2), West Street Cemetery (3), Ledgeville Cemetery (4), East Street Cemetery (5), Nichewaug Cemetery (6), Coolidge Cemetery (7). Display/hide their locations on the map
Lakes, reservoirs, and swamps: Dead Pond (A), Riceville Pond (B), Davenport Pond (C), Connor Pond (D), Carter Pond (E), Brown Pond (F), Harvard Pond (G), Gauco Pond (H). Display/hide their locations on the map
Streams, rivers, and creeks: Moccasin Brook (A), Nelson Brook (B), Rutland Brook (C), Silver Brook (D), Stony Brook (E), Lorinda Brook (F). Display/hide their locations on the map
In group quarters: 76 (-1 institutionalized population)
Size of family households: 163 2-persons, 58 3-persons, 61 4-persons, 11 5-persons, 12 6-persons
Size of nonfamily households: 130 1-person, 33 2-persons
111 married couples with children.
2 single-parent households (2 women).
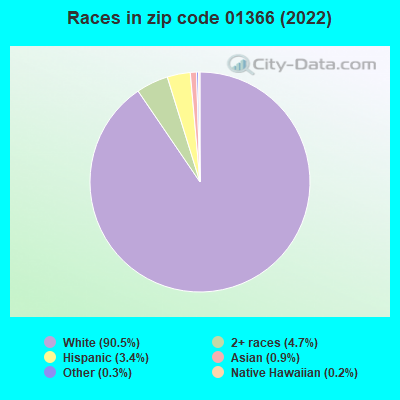
96.8% of residents of 01366 zip code speak English at home.
0.4% of residents speak Spanish at home (100% not well).
1.6% of residents speak other Indo-European language at home (28% very well, 72% well).
1.0% of residents speak Asian or Pacific Island language at home (50% very well, 50% well).
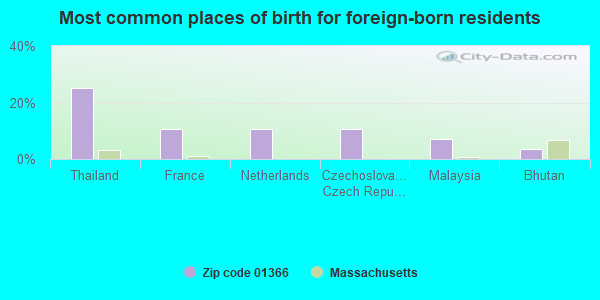
Foreign born population: 28 (2.5%) (93.0% of them are naturalized citizens)
This zip code:
2.5%
Whole state:
18.0%
25%Thailand
11%France
11%Netherlands
11%Czechoslovakia (includes Czech Republic and Slovakia)
7%Malaysia
4%Bhutan
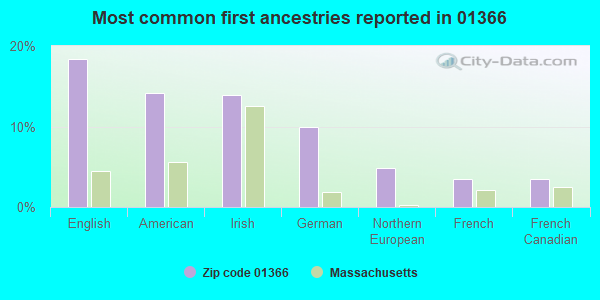
18%English
14%American
14%Irish
10%German
5%Northern European
3%French
3%French Canadian
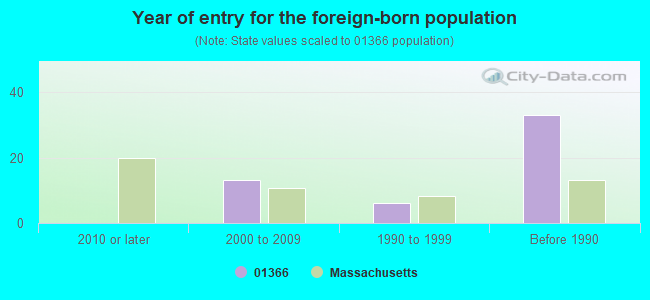
Year of entry for the foreign-born population
02010 or later
132000 to 2009
61990 to 1999
33Before 1990
Facilities with environmental interests located in this zip code:
PETERSHAM CENTER (2 SPRING STREET in PETERSHAM, MA)
(National Center for Education Statistics) - STATE ID-234005
PETERSHAM (PETERSHAM in PETERSHAM, MA)
AIR MINOR (AIRS/AFS) Business SIC classification: GENERAL GOVERNMENT
THE GARAGE (1 BARRE RD in PETERSHAM, MA)
Small Quantity Generators, between 100 kg and 1000 kg of hazardous waste/month (Resource Conservation and Recovery Act (tracking hazardous waste)) - notification Business NAICS classification: GENERAL AUTOMOTIVE REPAIR. Organizations: TODD COOMBS/KEVIN SHORTIS (CONTACT/OWNER)
GEORGES AUTO BODY (JCT 122 AND 32 in PETERSHAM, MA)
(Resource Conservation and Recovery Act (tracking hazardous waste))
HARVARD UNIVERSITY (HARVARD FOREST in PETERSHAM, MA)
Small Quantity Generators, between 100 kg and 1000 kg of hazardous waste/month (Resource Conservation and Recovery Act (tracking hazardous waste)) - notification Organizations: HARVARD FOREST (CONTACT/OPERATOR)
, PRESIDENT & FELLOWS OF HARVARD UNIV (CONTACT/OWNER)
Housing units lacking complete plumbing facilities: 2.0% Housing units lacking complete kitchen facilities: 1.9%
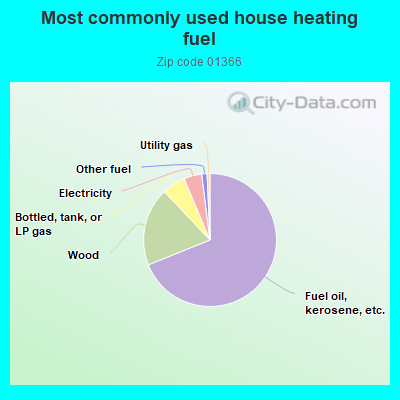
69.4%Fuel oil, kerosene, etc.
19.2%Wood
5.7%Bottled, tank, or LP gas
4.4%Electricity
1.3%Other fuel
0.7%Utility gas
Population in 1990: 1,131. Population change in the 1990s: +40 (+3.5%).
Place of birth for U.S.-born residents:
This state: 843
Northeast: 172
Midwest: 41
South: 31
West: 25
68% of the 01366 zip code residents lived in the same house 5 years ago. Out of people who lived in different houses, 32% lived in this county. Out of people who lived in different counties, 50% lived in Massachusetts.
93% of the 01366 zip code residents lived in the same house 1 year ago. Out of people who lived in different houses, 60% moved from this county. Out of people who lived in different houses, 27% moved from different county within same state. Out of people who lived in different houses, 7% moved from abroad.
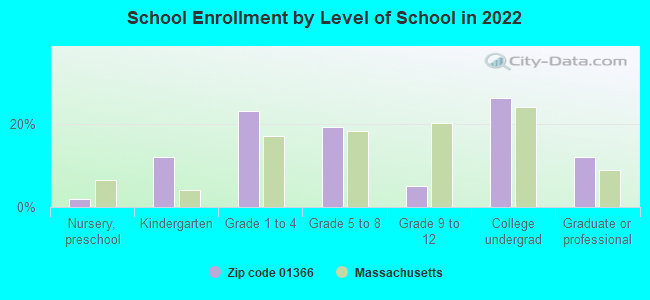
Private vs. public school enrollment:
Students in private schools in grades 1 to 8 (elementary and middle school): 9
Here:
10.3%
Massachusetts:
10.3%
Students in private schools in grades 9 to 12 (high school):
Here:
0.0%
Massachusetts:
12.3%
Students in private undergraduate colleges: 22
Here:
38.6%
Massachusetts:
51.2%
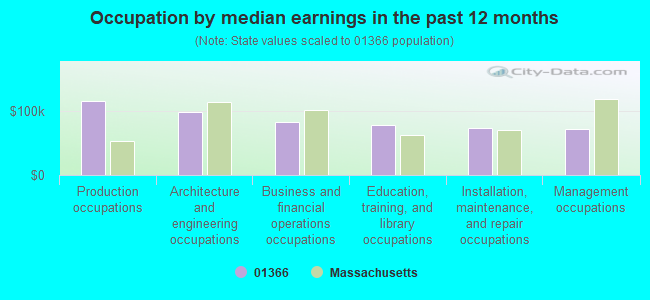
Occupation by median earnings in the past 12 months ($)
114,852Production occupations
98,909Architecture and engineering occupations
83,125Business and financial operations occupations
77,987Education, training, and library occupations
72,813Installation, maintenance, and repair occupations
71,370Management occupations
Top industries in this zip code by the number of employees in 2005:
Other Services (except Public Administration): Religious Organizations (20-49 employees: 1 establishment, 1-4 employees: 1 establishment)
Professional, Scientific, and Technical Services: Surveying and Mapping (except Geophysical) Services (5-9: 1)
Accommodation and Food Services: Bed-and-Breakfast Inns (1-4: 2)
Administrative and Support and Waste Management and Remediation Services: Packaging and Labeling Services (1-4: 1)
Professional, Scientific, and Technical Services: Tax Preparation Services (1-4: 1)
Health Care and Social Assistance: Offices of Chiropractors (1-4: 1)
Arts, Entertainment, and Recreation: Golf Courses and Country Clubs (1-4: 1)
People in group quarters in 2010:
38 people in other noninstitutional facilities
People in group quarters in 2000:
69 people in religious group quarters
18 people in college dormitories (includes college quarters off campus)
6 people in other nonhousehold living situations
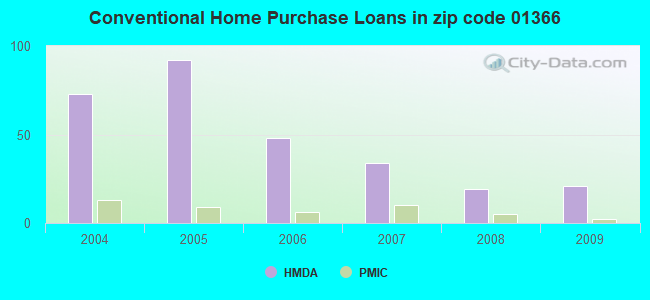
Home Mortgage Disclosure Act Aggregated Statistics For Year 2009 (Based on 12 partial tracts)
A) FHA, FSA/RHS & VA Home Purchase Loans
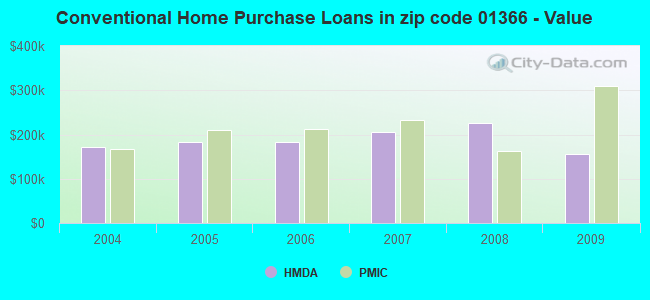
B) Conventional Home Purchase Loans
C) Refinancings
D) Home Improvement Loans
F) Non-occupant Loans on < 5 Family Dwellings (A B C & D)
Number
Average Value
Number
Average Value
Number
Average Value
Number
Average Value
Number
Average Value
LOANS ORIGINATED
9
$162,852
21
$155,990
95
$175,869
16
$53,109
5
$219,680
APPLICATIONS APPROVED, NOT ACCEPTED
0
$0
0
$0
3
$254,353
0
$0
0
$0
APPLICATIONS DENIED
1
$126,610
1
$223,560
23
$167,420
2
$114,060
1
$223,560
APPLICATIONS WITHDRAWN
0
$0
5
$236,332
17
$201,886
1
$11,410
2
$193,330
FILES CLOSED FOR INCOMPLETENESS
0
$0
0
$0
8
$162,964
0
$0
0
$0
Aggregated Statistics For Year 2008 (Based on 12 partial tracts)
A) FHA, FSA/RHS & VA Home Purchase Loans
B) Conventional Home Purchase Loans
C) Refinancings
D) Home Improvement Loans
F) Non-occupant Loans on < 5 Family Dwellings (A B C & D)
G) Loans On Manufactured Home Dwelling (A B C & D)
Number
Average Value
Number
Average Value
Number
Average Value
Number
Average Value
Number
Average Value
Number
Average Value
LOANS ORIGINATED
6
$156,832
19
$225,118
43
$194,008
13
$49,309
3
$247,130
0
$0
APPLICATIONS APPROVED, NOT ACCEPTED
1
$110,640
2
$250,930
8
$168,239
0
$0
1
$240,670
0
$0
APPLICATIONS DENIED
1
$164,250
9
$178,060
35
$205,275
5
$75,736
2
$242,950
1
$102,650
APPLICATIONS WITHDRAWN
1
$112,920
3
$202,267
17
$218,660
0
$0
1
$223,560
0
$0
FILES CLOSED FOR INCOMPLETENESS
0
$0
0
$0
6
$242,187
0
$0
1
$233,820
0
$0
Aggregated Statistics For Year 2007 (Based on 12 partial tracts)
A) FHA, FSA/RHS & VA Home Purchase Loans
B) Conventional Home Purchase Loans
C) Refinancings
D) Home Improvement Loans
F) Non-occupant Loans on < 5 Family Dwellings (A B C & D)
Number
Average Value
Number
Average Value
Number
Average Value
Number
Average Value
Number
Average Value
LOANS ORIGINATED
2
$171,660
34
$206,616
76
$159,834
39
$66,769
3
$245,230
APPLICATIONS APPROVED, NOT ACCEPTED
0
$0
1
$136,870
21
$150,450
2
$186,490
3
$246,370
APPLICATIONS DENIED
0
$0
6
$166,718
71
$221,549
16
$103,866
9
$194,282
APPLICATIONS WITHDRAWN
0
$0
1
$164,250
21
$174,186
2
$74,140
0
$0
FILES CLOSED FOR INCOMPLETENESS
0
$0
0
$0
10
$285,720
1
$90,110
0
$0
Aggregated Statistics For Year 2006 (Based on 12 partial tracts)
A) FHA, FSA/RHS & VA Home Purchase Loans
B) Conventional Home Purchase Loans
C) Refinancings
D) Home Improvement Loans
F) Non-occupant Loans on < 5 Family Dwellings (A B C & D)
Number
Average Value
Number
Average Value
Number
Average Value
Number
Average Value
Number
Average Value
LOANS ORIGINATED
1
$207,590
48
$182,377
90
$168,974
22
$89,019
6
$242,948
APPLICATIONS APPROVED, NOT ACCEPTED
0
$0
2
$290,285
13
$121,079
6
$33,077
0
$0
APPLICATIONS DENIED
0
$0
8
$153,125
63
$176,358
14
$91,981
2
$136,870
APPLICATIONS WITHDRAWN
0
$0
3
$191,240
43
$161,063
8
$130,456
1
$163,110
FILES CLOSED FOR INCOMPLETENESS
0
$0
2
$201,315
9
$200,999
0
$0
0
$0
Aggregated Statistics For Year 2005 (Based on 12 partial tracts)
A) FHA, FSA/RHS & VA Home Purchase Loans
B) Conventional Home Purchase Loans
C) Refinancings
D) Home Improvement Loans
E) Loans on Dwellings For 5+ Families
F) Non-occupant Loans on < 5 Family Dwellings (A B C & D)
G) Loans On Manufactured Home Dwelling (A B C & D)
Number
Average Value
Number
Average Value
Number
Average Value
Number
Average Value
Number
Average Value
Number
Average Value
Number
Average Value
LOANS ORIGINATED
2
$215,005
92
$182,756
116
$172,663
35
$72,379
1
$280,590
10
$216,258
0
$0
APPLICATIONS APPROVED, NOT ACCEPTED
0
$0
10
$186,146
14
$190,480
2
$29,655
0
$0
1
$285,150
0
$0
APPLICATIONS DENIED
0
$0
19
$158,964
54
$166,929
15
$84,937
0
$0
2
$196,755
1
$285,150
APPLICATIONS WITHDRAWN
0
$0
16
$155,692
40
$157,289
8
$138,012
0
$0
2
$277,165
0
$0
FILES CLOSED FOR INCOMPLETENESS
0
$0
3
$231,543
33
$177,968
1
$579,420
0
$0
1
$323,930
0
$0
Aggregated Statistics For Year 2004 (Based on 12 partial tracts)
A) FHA, FSA/RHS & VA Home Purchase Loans
B) Conventional Home Purchase Loans
C) Refinancings
D) Home Improvement Loans
F) Non-occupant Loans on < 5 Family Dwellings (A B C & D)
G) Loans On Manufactured Home Dwelling (A B C & D)


 Nearest zip codes: 01331, 01037, 01005, 01094, 01074, 01355.