Estimated zip code population in 2022: 1,008 Zip code population in 2010: 878 Zip code population in 2000: 873
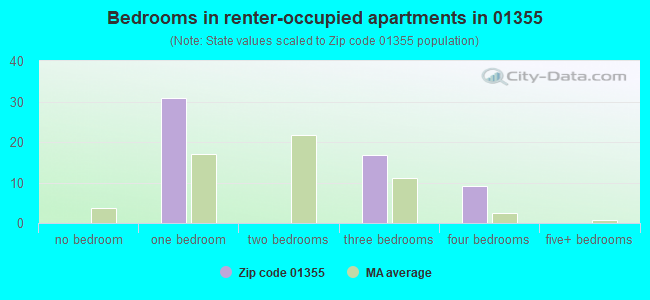
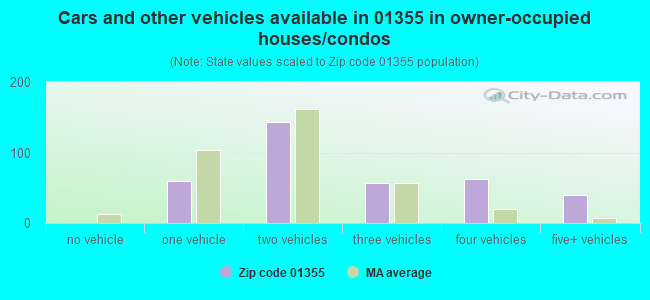
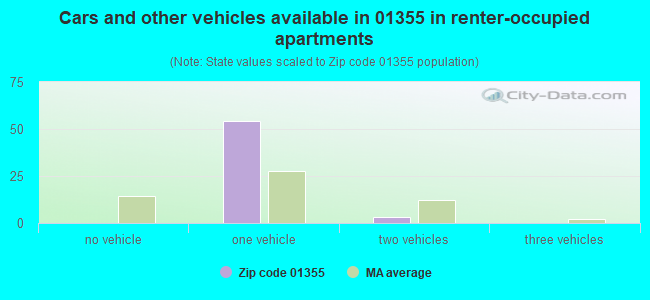
Houses and condos: 481 Renter-occupied apartments: 56
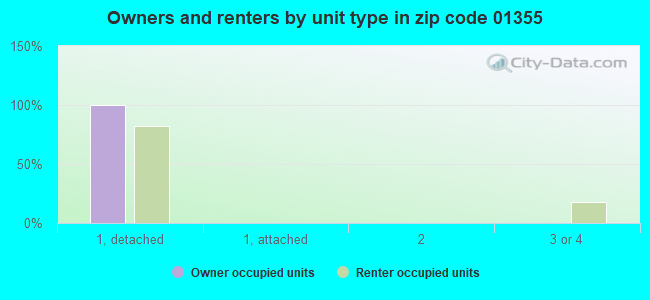
% of renters here:
13%
State:
38%
March 2022 cost of living index in zip code 01355: 87.9 (less than average, U.S. average is 100)
Land area: 47.4 sq. mi. Water area: 13.8 sq. mi.
Population density: 21 people per square mile
(very low).
OSM Map
Google Map
MSN Map
OSM Map
General Map
Google Map
MSN Map
OSM Map
Google Map
MSN Map
OSM Map
Google Map
MSN Map
Please wait while loading the map...
Real estate property taxes paid for housing units in 2022:
This zip code:
1.2% ($4,218)
Massachusetts:
1.0% ($5,536)
Median real estate property taxes paid for housing units with mortgages in 2022: $4,095 (1.1%) Median real estate property taxes paid for housing units with no mortgage in 2022: $4,481 (1.2%)
Business Search- 14 Million verified businesses
Males: 558
(55.3%)
Females: 450
(44.7%)
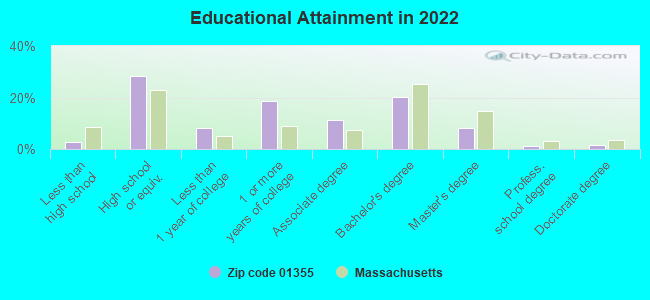
For population 25 years and over in 01355:
High school or higher: 96.4%
Bachelor's degree or higher: 30.8%
Graduate or professional degree: 10.7%
Unemployed: 1.4%
Mean travel time to work (commute): 26.8 minutes
For population 15 years and over in 01355:
Never married: 24.1%
Now married: 62.6%
Separated: 0.0%
Widowed: 2.6%
Divorced: 10.8%
Zip code 01355 compared to state average:
Unemployed percentage below state average.
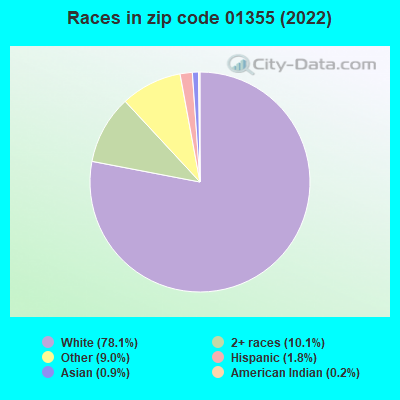
Black race population percentage significantly below state average.
Hispanic race population percentage significantly below state average.
Median age significantly above state average.
Foreign-born population percentage significantly below state average.
Renting percentage significantly below state average.
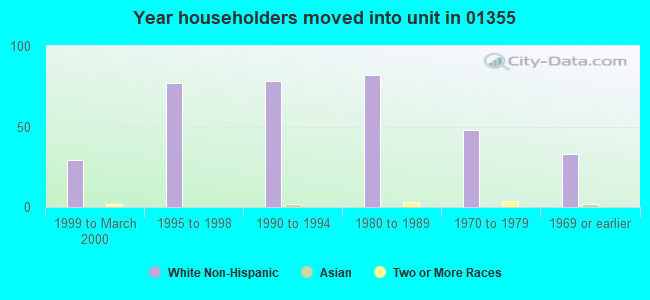
Length of stay since moving in significantly above state average.
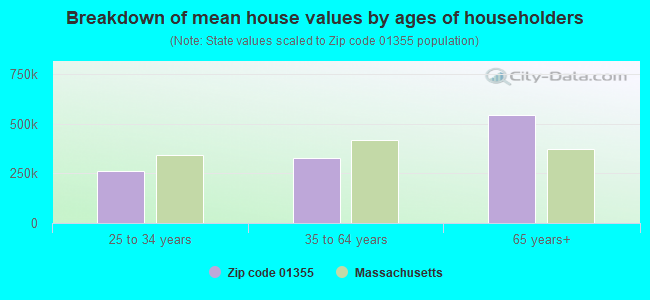
Estimated median house/condo value in 2022: $363,870
01355:
$363,870
Massachusetts:
$534,700
Median resident age:
This zip code:
56.3 years
Massachusetts median age:
40.3 years
Average household size:
This zip code:
2.4 people
Massachusetts:
2.4 people
Averages for the 2020 tax year for zip code 01355, filed in 2021:
Average Adjusted Gross Income (AGI) in 2020: $68,290 (Individual Income Tax Returns)
Here:
$68,290
State:
$105,130
Salary/wage: $55,413 (reported on 76.0% of returns)
Here:
$55,413
State:
$82,951
(% of AGI for various income ranges: 1062.5% for AGIs below $25k, 3245.7% for AGIs $25k-50k, 7354.0% for AGIs $50k-75k, 12063.3% for AGIs $75k-100k, 12675.0% for AGIs $100k-200k)
Taxable interest for individuals: $604 (reported on 48.0% of returns)
This zip code:
$604
Massachusetts:
$2,361
(% of AGI for various income ranges: 11.2% for AGIs below $25k, 52.9% for AGIs $25k-50k, 28.0% for AGIs $50k-75k, 43.3% for AGIs $75k-100k, 120.0% for AGIs $100k-200k)
Ordinary dividends: $3,667 (reported on 24.0% of returns)
Here:
$3,667
State:
$10,365
(% of AGI for various income ranges: 164.3% for AGIs $25k-50k, 268.0% for AGIs $50k-75k, 318.3% for AGIs $100k-200k)
Net capital gain/loss in AGI: +$3,400 (reported on 18.0% of returns)
Here:
+$3,400
State:
+$48,178
(% of AGI for various income ranges: 32.9% for AGIs $25k-50k, 138.0% for AGIs $50k-75k, 356.7% for AGIs $100k-200k)
Profit/loss from business: +$13,944 (reported on 18.0% of returns)
Here:
+$13,944
State:
+$20,792
(% of AGI for various income ranges: 155.0% for AGIs below $25k, 530.0% for AGIs $25k-50k, 1266.7% for AGIs $100k-200k)
Taxable individual retirement arrangement distribution: $15,900 (reported on 10.0% of returns)
01355:
$15,900
Massachusetts:
$22,790
(% of AGI for various income ranges: 257.1% for AGIs $25k-50k, 2050.0% for AGIs $75k-100k)
Total itemized deductions: $18,533 (reported on 6.0% of returns)
Here:
$18,533
State:
$36,722
(% of AGI for various income ranges: 1112.0% for AGIs $50k-75k)
Taxes paid: $6,967 (reported on 6.0% of returns)
01355:
$6,967
State:
$8,782
(% of AGI for various income ranges: 418.0% for AGIs $50k-75k)
Earned income credit: $1,600 (reported on 8.0% of returns)
Here:
$1,600
State:
$1,909
(% of AGI for various income ranges: 80.0% for AGIs below $25k)
Percentage of individuals using paid preparers for their 2020 taxes: 88.0%
Here:
88%
State:
92%
(% for various income ranges: 78.6% for AGIs below $25k, 90.9% for AGIs $25k-50k, 87.5% for AGIs $50k-75k, 83.3% for AGIs $75k-100k, 100.0% for AGIs $100k-200k, 100.0% for AGIs over 200k)
Averages for the 2012 tax year for zip code 01355, filed in 2013:
Average Adjusted Gross Income (AGI) in 2012: $57,191 (Individual Income Tax Returns)
Here:
$57,191
State:
$81,425
Salary/wage: $48,264 (reported on 86.7% of returns)
Here:
$48,264
State:
$64,752
(% of AGI for various income ranges: 60.8% for AGIs below $25k, 78.1% for AGIs $25k-50k, 79.5% for AGIs $50k-75k, 70.7% for AGIs $75k-100k, 71.0% for AGIs $100k-200k)
Taxable interest for individuals: $730 (reported on 44.4% of returns)
This zip code:
$730
Massachusetts:
$2,136
(% of AGI for various income ranges: 2.7% for AGIs below $25k, 0.5% for AGIs $25k-50k, 0.5% for AGIs $75k-100k, 0.5% for AGIs $100k-200k)
Ordinary dividends: $1,358 (reported on 26.7% of returns)
Here:
$1,358
State:
$9,473
(% of AGI for various income ranges: 1.9% for AGIs below $25k, 0.6% for AGIs $25k-50k, 0.8% for AGIs $50k-75k, 0.7% for AGIs $100k-200k)
Net capital gain/loss in AGI: +$1,929 (reported on 15.6% of returns)
Here:
+$1,929
State:
+$31,437
Profit/loss from business: +$11,950 (reported on 22.2% of returns)
Here:
+$11,950
State:
+$20,662
(% of AGI for various income ranges: 15.8% for AGIs below $25k, 9.8% for AGIs $25k-50k, 10.3% for AGIs $75k-100k)
Taxable individual retirement arrangement distribution: $9,775 (reported on 8.9% of returns)
01355:
$9,775
Massachusetts:
$18,892
Total itemized deductions: $16,748 (22% of AGI, reported on 46.7% of returns)
Here:
$16,748
State:
$28,907
Here:
21.6% of AGI
State:
18.2% of AGI
(% of AGI for various income ranges: 14.3% for AGIs below $25k, 12.3% for AGIs $25k-50k, 13.9% for AGIs $50k-75k, 14.9% for AGIs $75k-100k, 13.3% for AGIs $100k-200k)
Charity contributions: $1,513 (reported on 33.3% of returns)
Here:
$1,513
State:
$4,208
(% of AGI for various income ranges: 0.7% for AGIs $25k-50k, 0.5% for AGIs $50k-75k, 1.3% for AGIs $75k-100k, 1.1% for AGIs $100k-200k)
Taxes paid: $7,505 (reported on 46.7% of returns)
01355:
$7,505
State:
$13,303
(% of AGI for various income ranges: 7.3% for AGIs $25k-50k, 5.5% for AGIs $50k-75k, 6.2% for AGIs $75k-100k, 7.1% for AGIs $100k-200k)
Earned income credit: $2,000 (reported on 13.3% of returns)
Here:
$2,000
State:
$1,971
(% of AGI for various income ranges: 6.7% for AGIs below $25k)
Percentage of individuals using paid preparers for their 2012 taxes: 51.1%
Here:
51%
State:
56%
(% for various income ranges: 42.9% for AGIs below $25k, 50.0% for AGIs $25k-50k, 55.6% for AGIs $50k-75k, 66.7% for AGIs $75k-100k, 50.0% for AGIs $100k-200k)
Averages for the 2004 tax year for zip code 01355, filed in 2005:
Average Adjusted Gross Income (AGI) in 2004: $44,614 (Individual Income Tax Returns)
Here:
$44,614
State:
$62,877
Salary/wage: $41,157 (reported on 85.6% of returns)
Here:
$41,157
State:
$52,969
(% of AGI for various income ranges: 107.1% for AGIs below $10k, 61.5% for AGIs $10k-25k, 80.5% for AGIs $25k-50k, 84.1% for AGIs $50k-75k, 81.1% for AGIs $75k-100k, 75.2% for AGIs over 100k)
Taxable interest for individuals: $471 (reported on 58.2% of returns)
This zip code:
$471
Massachusetts:
$1,945
(% of AGI for various income ranges: 8.0% for AGIs below $10k, 0.8% for AGIs $10k-25k, 0.7% for AGIs $25k-50k, 0.3% for AGIs $50k-75k, 0.6% for AGIs $75k-100k, 0.4% for AGIs over 100k)
Taxable dividends: $1,674 (reported on 32.2% of returns)
Here:
$1,674
State:
$5,323
(% of AGI for various income ranges: 12.8% for AGIs below $10k, 1.2% for AGIs $10k-25k, 1.2% for AGIs $25k-50k, 1.0% for AGIs $50k-75k, 1.0% for AGIs $75k-100k, 1.0% for AGIs over 100k)
Net capital gain/loss: +$3,919 (reported on 19.6% of returns)
Here:
+$3,919
State:
+$20,377
(% of AGI for various income ranges: -3.5% for AGIs below $10k, 0.3% for AGIs $10k-25k, -0.4% for AGIs $25k-50k, 6.8% for AGIs $75k-100k, 1.0% for AGIs over 100k)
Profit/loss from business: +$15,122 (reported on 22.4% of returns)
Here:
+$15,122
State:
+$17,837
(% of AGI for various income ranges: 25.7% for AGIs below $10k, 10.0% for AGIs $10k-25k, 6.2% for AGIs $25k-50k, 3.7% for AGIs $50k-75k, 0.5% for AGIs $75k-100k, 18.2% for AGIs over 100k)
IRA payment deduction: $1,900 (reported on 4.6% of returns)
01355:
$1,900
Massachusetts:
$3,100
Total itemized deductions: $14,376 (22% of AGI, reported on 46.1% of returns)
Here:
$14,376
State:
$22,573
Here:
22.1% of AGI
State:
19.5% of AGI
(% of AGI for various income ranges: 17.7% for AGIs $10k-25k, 15.7% for AGIs $25k-50k, 15.5% for AGIs $50k-75k, 13.9% for AGIs $75k-100k, 14.2% for AGIs over 100k)
Charity contributions deductions: $1,412 (2% of AGI, reported on 40.4% of returns)
Here:
$1,412
State:
$3,295
Here:
2.1% of AGI
State:
2.7% of AGI
(% of AGI for various income ranges: 1.6% for AGIs $10k-25k, 1.0% for AGIs $25k-50k, 1.4% for AGIs $50k-75k, 1.0% for AGIs $75k-100k, 1.7% for AGIs over 100k)
Total tax: $5,556 (reported on 82.2% of returns)
01355:
$5,556
State:
$11,494
(% of AGI for various income ranges: 4.9% for AGIs below $10k, 5.7% for AGIs $10k-25k, 6.9% for AGIs $25k-50k, 9.2% for AGIs $50k-75k, 10.3% for AGIs $75k-100k, 16.3% for AGIs over 100k)
Earned income credit: $1,289 (reported on 8.7% of returns)
Here:
$1,289
State:
$1,518
Percentage of individuals using paid preparers for their 2004 taxes: 49.3%
Here:
49%
State:
58%
(% for various income ranges: 36.0% for AGIs below $10k, 52.4% for AGIs $10k-25k, 53.6% for AGIs $25k-50k, 48.5% for AGIs $50k-75k, 49.1% for AGIs $75k-100k, 57.6% for AGIs over 100k)
Notable locations in zip code 01355: Hamilton Orchards (A), New Salem Fire Department (B), New Salem Public Library (C). Display/hide their locations on the map
Lakes and swamps: Thompson Pond (A), Russ Pond (B), Nance Lake (C), Hackmetack Pond (D), Gibbs Pond (E), Flask Pond (F), Dead Pond (G), Davis Pond (H). Display/hide their locations on the map
Streams, rivers, and creeks: Underhill Brook (A), Bow Brook (B), Giles Brook (C), Hop Brook (D), Manning Brook (E), McIver Brook (F), Moosehorn Brook (G), Spriggy Brook (H), Willow Brook (I). Display/hide their locations on the map
Size of family households: 220 2-persons, 39 3-persons, 51 4-persons, 18 5-persons, 4 6-persons
Size of nonfamily households: 70 1-person, 14 2-persons
84 married couples with children.
22 single-parent households (3 men, 19 women).
96.0% of residents of 01355 zip code speak English at home.
1.3% of residents speak Spanish at home (69% very well, 31% well).
0.7% of residents speak other Indo-European language at home (100% very well).
1.0% of residents speak Asian or Pacific Island language at home (100% very well).
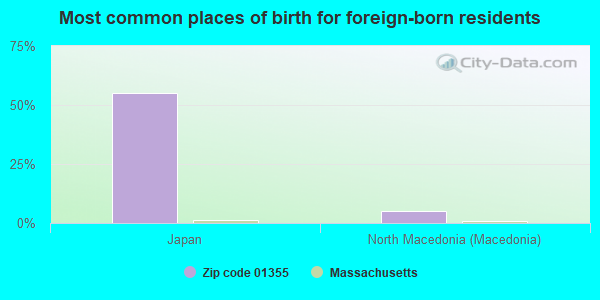
Foreign born population: 20 (2.0%) (35.4% of them are naturalized citizens)
This zip code:
2.0%
Whole state:
18.0%
55%Japan
5%North Macedonia (Macedonia)
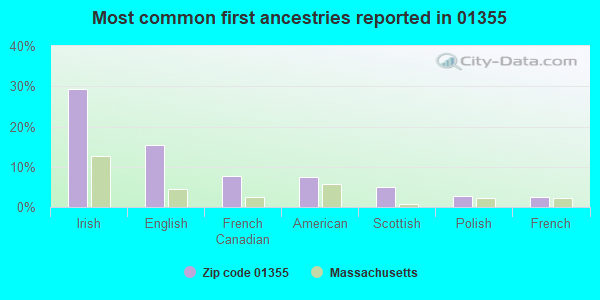
29%Irish
16%English
8%French Canadian
7%American
5%Scottish
3%Polish
2%French
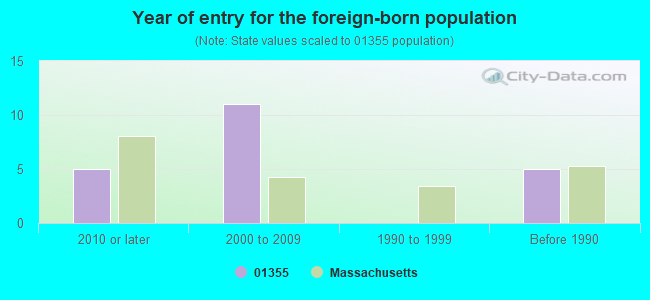
Year of entry for the foreign-born population
52010 or later
112000 to 2009
01990 to 1999
5Before 1990
Facilities with environmental interests located in this zip code:
NEW SALEM (SOUTH MAIN STREET in NEW SALEM, MA)
AIR MINOR (AIRS/AFS) Business SIC classification: GENERAL GOVERNMENT
Housing units lacking complete plumbing facilities: 3.2% Housing units lacking complete kitchen facilities: 3.1%
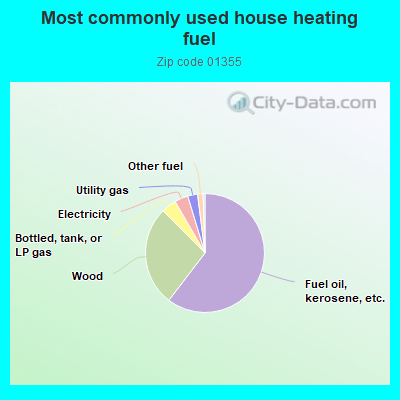
60.7%Fuel oil, kerosene, etc.
27.3%Wood
4.1%Bottled, tank, or LP gas
3.7%Electricity
2.7%Utility gas
1.5%Other fuel
Population in 1990: 456. Population change in the 1990s: +417 (+91.4%).
Place of birth for U.S.-born residents:
This state: 642
Northeast: 222
Midwest: 78
South: 28
West: 8
73% of the 01355 zip code residents lived in the same house 5 years ago. Out of people who lived in different houses, 25% lived in this county. Out of people who lived in different counties, 50% lived in Massachusetts.
96% of the 01355 zip code residents lived in the same house 1 year ago. Out of people who lived in different houses, 72% moved from this county. Out of people who lived in different houses, 25% moved from different county within same state.
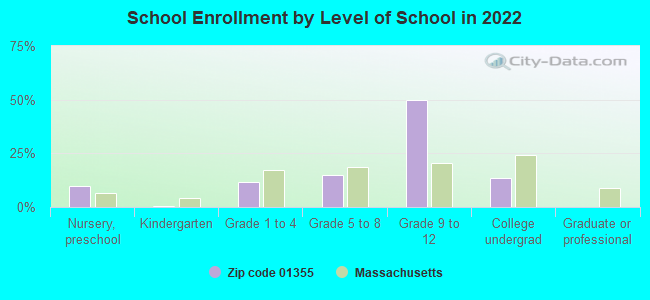
Private vs. public school enrollment:
Students in private schools in grades 1 to 8 (elementary and middle school): 6
Here:
11.6%
Massachusetts:
10.3%
Students in private schools in grades 9 to 12 (high school): 8
Here:
8.4%
Massachusetts:
12.3%
Students in private undergraduate colleges: 4
Here:
19.2%
Massachusetts:
51.2%
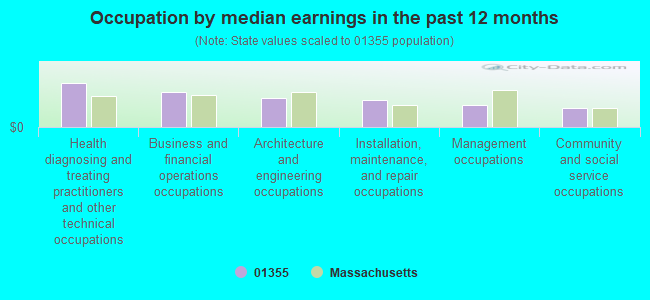
Occupation by median earnings in the past 12 months ($)
115,025Health diagnosing and treating practitioners and other technical occupations
91,235Business and financial operations occupations
75,683Architecture and engineering occupations
70,168Installation, maintenance, and repair occupations
58,219Management occupations
49,823Community and social service occupations
Top industries in this zip code by the number of employees in 2005:
Construction: Plumbing, Heating, and Air-Conditioning Contractors (10-19 employees: 1 establishment)
Other Services (except Public Administration): Religious Organizations (1-4: 2)
Administrative and Support and Waste Management and Remediation Services: Other Waste Collection (1-4: 1)
Professional, Scientific, and Technical Services: Other Scientific and Technical Consulting Services (1-4: 1)
Other Services (except Public Administration): Home and Garden Equipment Repair and Maintenance (1-4: 1)
Arts, Entertainment, and Recreation: Promoters of Performing Arts, Sports, and Similar Events with Facilities (1-4: 1)
Professional, Scientific, and Technical Services: Commercial Photography (1-4: 1)
Fatal accident statistics in 2014:
Fatal accident count: 1
Vehicles involved in fatal accidents: 2
Fatal accidents caused by drunken drivers: 0
Fatalities: 1
Persons involved in fatal accidents: 3
Pedestrians involved in fatal accidents: 0
Home Mortgage Disclosure Act Aggregated Statistics For Year 2009 (Based on 12 partial tracts)
A) FHA, FSA/RHS & VA Home Purchase Loans
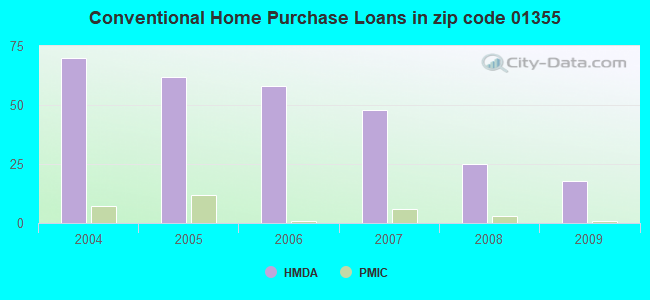
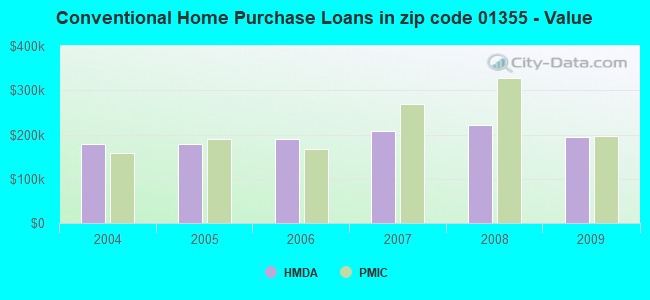
B) Conventional Home Purchase Loans
C) Refinancings
D) Home Improvement Loans
F) Non-occupant Loans on < 5 Family Dwellings (A B C & D)
Number
Average Value
Number
Average Value
Number
Average Value
Number
Average Value
Number
Average Value
LOANS ORIGINATED
7
$193,210
18
$195,461
130
$187,225
21
$91,876
9
$165,559
APPLICATIONS APPROVED, NOT ACCEPTED
0
$0
2
$161,640
3
$278,290
0
$0
0
$0
APPLICATIONS DENIED
0
$0
5
$290,784
30
$227,331
3
$77,383
6
$263,815
APPLICATIONS WITHDRAWN
2
$157,345
3
$278,863
19
$236,535
2
$58,035
1
$172,820
FILES CLOSED FOR INCOMPLETENESS
0
$0
3
$113,207
12
$224,336
0
$0
0
$0
Aggregated Statistics For Year 2008 (Based on 12 partial tracts)
A) FHA, FSA/RHS & VA Home Purchase Loans
B) Conventional Home Purchase Loans
C) Refinancings
D) Home Improvement Loans
F) Non-occupant Loans on < 5 Family Dwellings (A B C & D)
Number
Average Value
Number
Average Value
Number
Average Value
Number
Average Value
Number
Average Value
LOANS ORIGINATED
3
$134,703
25
$221,760
45
$179,412
18
$61,714
5
$236,960
APPLICATIONS APPROVED, NOT ACCEPTED
0
$0
3
$217,243
3
$106,617
2
$62,765
0
$0
APPLICATIONS DENIED
0
$0
2
$256,650
19
$217,032
5
$97,330
0
$0
APPLICATIONS WITHDRAWN
2
$76,950
3
$166,800
10
$206,352
1
$124,670
1
$128,110
FILES CLOSED FOR INCOMPLETENESS
0
$0
1
$73,940
2
$211,510
0
$0
1
$73,940
Aggregated Statistics For Year 2007 (Based on 12 partial tracts)
A) FHA, FSA/RHS & VA Home Purchase Loans
B) Conventional Home Purchase Loans
C) Refinancings
D) Home Improvement Loans
F) Non-occupant Loans on < 5 Family Dwellings (A B C & D)
G) Loans On Manufactured Home Dwelling (A B C & D)
Number
Average Value
Number
Average Value
Number
Average Value
Number
Average Value
Number
Average Value
Number
Average Value
LOANS ORIGINATED
2
$177,550
48
$207,713
67
$162,759
30
$63,138
9
$153,618
1
$123,810
APPLICATIONS APPROVED, NOT ACCEPTED
0
$0
5
$195,346
16
$168,198
4
$65,560
3
$167,947
0
$0
APPLICATIONS DENIED
1
$181,420
13
$217,066
30
$211,855
5
$107,990
2
$122,520
1
$24,070
APPLICATIONS WITHDRAWN
0
$0
9
$189,920
15
$214,377
2
$92,430
5
$179,182
0
$0
FILES CLOSED FOR INCOMPLETENESS
0
$0
1
$196,030
3
$96,583
1
$155,620
0
$0
0
$0
Aggregated Statistics For Year 2006 (Based on 12 partial tracts)
B) Conventional Home Purchase Loans
C) Refinancings
D) Home Improvement Loans
E) Loans on Dwellings For 5+ Families
F) Non-occupant Loans on < 5 Family Dwellings (A B C & D)
G) Loans On Manufactured Home Dwelling (A B C & D)
Number
Average Value
Number
Average Value
Number
Average Value
Number
Average Value
Number
Average Value
Number
Average Value
LOANS ORIGINATED
58
$190,861
69
$156,633
32
$89,178
0
$0
12
$172,963
0
$0
APPLICATIONS APPROVED, NOT ACCEPTED
7
$304,614
9
$169,477
2
$65,775
0
$0
0
$0
0
$0
APPLICATIONS DENIED
5
$160,954
40
$177,871
10
$100,167
1
$1,375,680
4
$197,325
1
$42,990
APPLICATIONS WITHDRAWN
3
$243,323
31
$170,656
3
$85,980
0
$0
3
$204,347
0
$0
FILES CLOSED FOR INCOMPLETENESS
0
$0
5
$280,466
2
$42,990
0
$0
1
$25,790
0
$0
Aggregated Statistics For Year 2005 (Based on 12 partial tracts)
A) FHA, FSA/RHS & VA Home Purchase Loans
B) Conventional Home Purchase Loans
C) Refinancings
D) Home Improvement Loans
E) Loans on Dwellings For 5+ Families
F) Non-occupant Loans on < 5 Family Dwellings (A B C & D)
G) Loans On Manufactured Home Dwelling (A B C & D)
Number
Average Value
Number
Average Value
Number
Average Value
Number
Average Value
Number
Average Value
Number
Average Value
Number
Average Value
LOANS ORIGINATED
1
$147,890
62
$177,410
101
$158,663
22
$93,718
1
$260,520
11
$159,688
2
$39,120
APPLICATIONS APPROVED, NOT ACCEPTED
0
$0
6
$200,190
8
$158,955
0
$0
0
$0
2
$145,305
0
$0
APPLICATIONS DENIED
0
$0
4
$200,978
42
$163,198
9
$118,748
0
$0
3
$141,580
0
$0
APPLICATIONS WITHDRAWN
0
$0
4
$176,475
28
$162,809
3
$111,773
0
$0
1
$240,740
0
$0
FILES CLOSED FOR INCOMPLETENESS
0
$0
3
$161,357
11
$216,748
0
$0
0
$0
0
$0
0
$0
Aggregated Statistics For Year 2004 (Based on 12 partial tracts)
A) FHA, FSA/RHS & VA Home Purchase Loans
B) Conventional Home Purchase Loans
C) Refinancings
D) Home Improvement Loans
F) Non-occupant Loans on < 5 Family Dwellings (A B C & D)
G) Loans On Manufactured Home Dwelling (A B C & D)
Detailed PMIC statistics for the following Tracts:0406.00
2002 - 2018 National Fire Incident Reporting System (NFIRS) incidents
Based on the data from the years 2002 - 2018 the average number of fires per year is 10. The highest number of fires - 25 took place in 2018, and the least - 2 in 2015. The data has a growing trend.
When looking into fire subcategories, the most incidents belonged to: Outside Fires (46.0%), and Structure Fires (40.8%).
Fire incident types reported to NFIRS in Zip Code 01355


 Nearest zip codes: 01072, 01379, 01366, 01364, 01037, 01054.


 Based on the data from the years 2002 - 2018 the average number of fires per year is 10. The highest number of fires - 25 took place in 2018, and the least - 2 in 2015. The data has a growing trend.
 When looking into fire subcategories, the most incidents belonged to: Outside Fires (46.0%), and Structure Fires (40.8%).