Estimated zip code population in 2022: 778 Zip code population in 2010: 813 Zip code population in 2000: 891
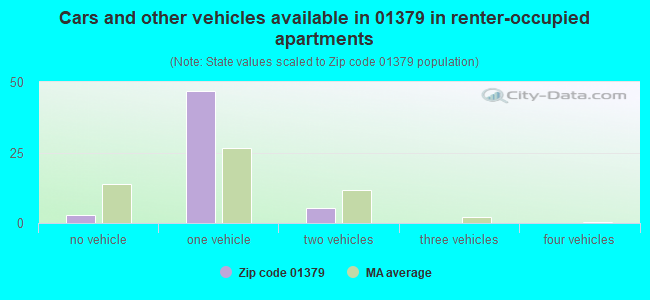
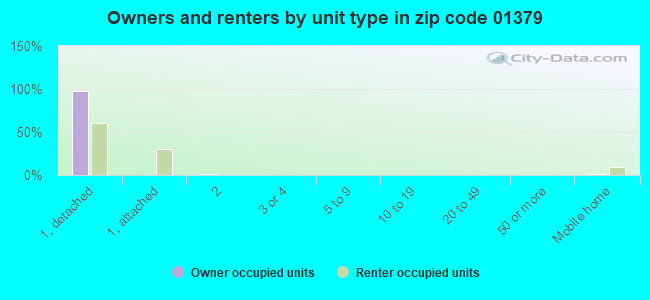
Houses and condos: 400 Renter-occupied apartments: 54
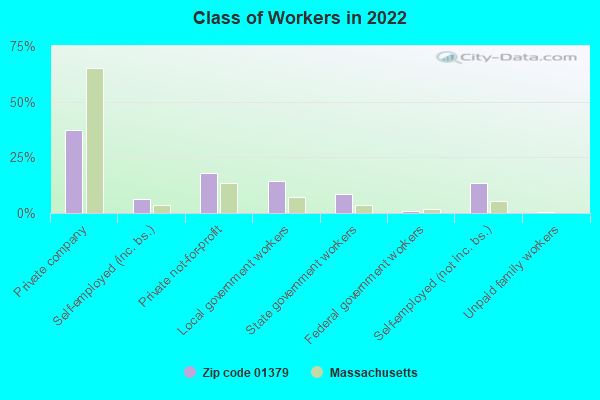
% of renters here:
15%
State:
38%
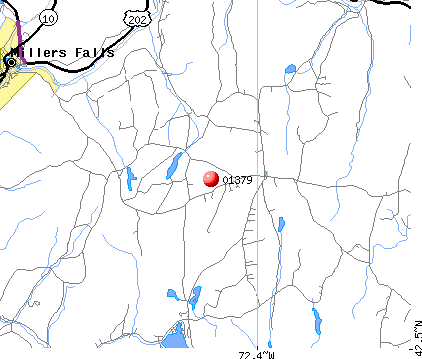
March 2022 cost of living index in zip code 01379: 90.8 (less than average, U.S. average is 100)
Land area: 30.2 sq. mi. Water area: 0.4 sq. mi.
Population density: 26 people per square mile
(very low).
OSM Map
Google Map
MSN Map
OSM Map
General Map
Google Map
MSN Map
OSM Map
Google Map
MSN Map
OSM Map
Google Map
MSN Map
Please wait while loading the map...
Real estate property taxes paid for housing units in 2022:
This zip code:
1.5% ($4,272)
Massachusetts:
1.0% ($5,536)
Median real estate property taxes paid for housing units with mortgages in 2022: $4,641 (1.7%) Median real estate property taxes paid for housing units with no mortgage in 2022: $3,935 (1.4%)
Business Search- 14 Million verified businesses
Males: 383
(49.2%)
Females: 395
(50.8%)
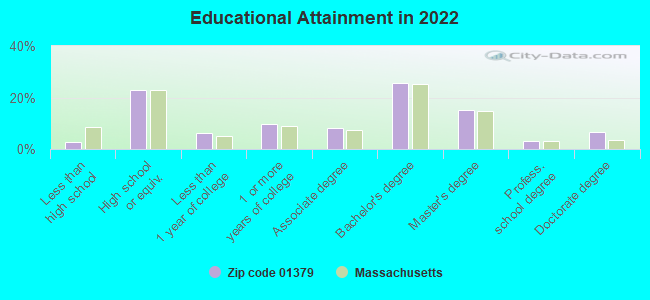
For population 25 years and over in 01379:
High school or higher: 97.4%
Bachelor's degree or higher: 50.4%
Graduate or professional degree: 24.7%
Unemployed: 6.7%
Mean travel time to work (commute): 33.9 minutes
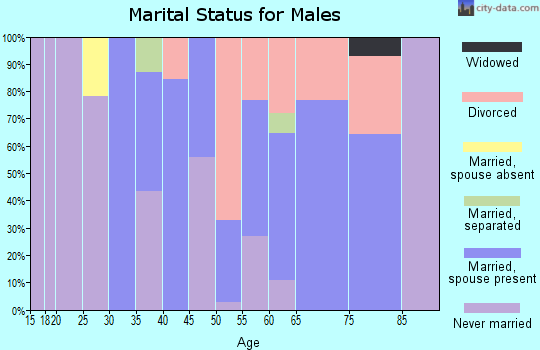
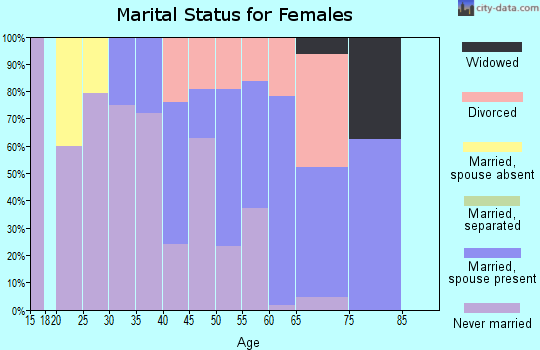
For population 15 years and over in 01379:
Never married: 28.1%
Now married: 52.5%
Separated: 2.5%
Widowed: 4.1%
Divorced: 12.8%
Zip code 01379 compared to state average:
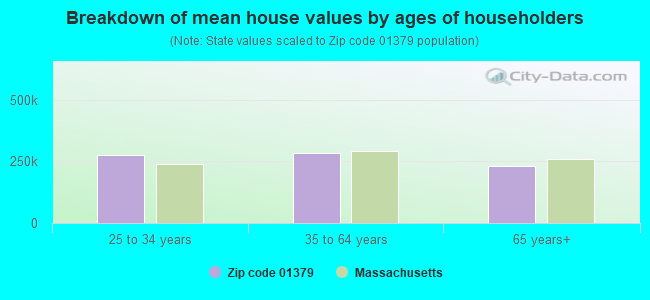
Median house value below state average.
Hispanic race population percentage below state average.
Median age significantly above state average.
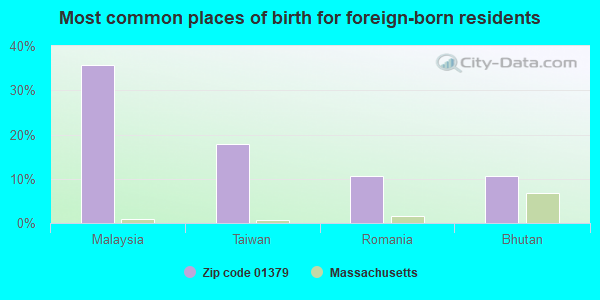
Foreign-born population percentage significantly below state average.
Renting percentage significantly below state average.
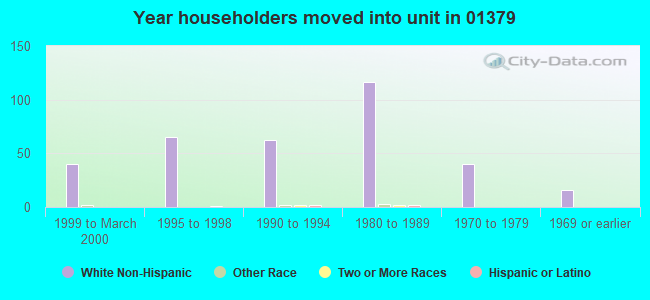
Length of stay since moving in significantly above state average.
Estimated median house/condo value in 2022: $284,201
01379:
$284,201
Massachusetts:
$534,700
According to our research of Massachusetts and other state lists, there were 2 registered sex offenders living in 01379 zip code as of April 27, 2024. The ratio of all residents to sex offenders in zip code 01379 is 393 to 1.
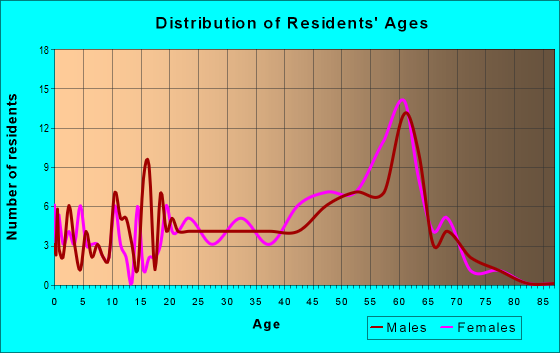
Median resident age:
This zip code:
52.7 years
Massachusetts median age:
40.3 years
Average household size:
This zip code:
2.1 people
Massachusetts:
2.4 people
Averages for the 2020 tax year for zip code 01379, filed in 2021:
Average Adjusted Gross Income (AGI) in 2020: $50,552 (Individual Income Tax Returns)
Here:
$50,552
State:
$105,130
Salary/wage: $44,253 (reported on 68.2% of returns)
Here:
$44,253
State:
$82,951
(% of AGI for various income ranges: 784.4% for AGIs below $25k, 3004.4% for AGIs $25k-50k, 7923.3% for AGIs $50k-75k, 7816.7% for AGIs $75k-100k, 17146.7% for AGIs $100k-200k)
Taxable interest for individuals: $375 (reported on 36.4% of returns)
This zip code:
$375
Massachusetts:
$2,361
(% of AGI for various income ranges: 4.4% for AGIs below $25k, 13.3% for AGIs $25k-50k, 33.3% for AGIs $50k-75k, 16.7% for AGIs $75k-100k, 96.7% for AGIs $100k-200k)
Ordinary dividends: $3,260 (reported on 22.7% of returns)
Here:
$3,260
State:
$10,365
(% of AGI for various income ranges: 152.2% for AGIs below $25k, 236.7% for AGIs $50k-75k, 393.3% for AGIs $100k-200k)
Net capital gain/loss in AGI: +$6,033 (reported on 20.5% of returns)
Here:
+$6,033
State:
+$48,178
(% of AGI for various income ranges: 93.3% for AGIs below $25k, 293.3% for AGIs $50k-75k, 1236.7% for AGIs $100k-200k)
Profit/loss from business: +$7,450 (reported on 27.3% of returns)
Here:
+$7,450
State:
+$20,792
(% of AGI for various income ranges: 227.8% for AGIs below $25k, 528.9% for AGIs $25k-50k, 710.0% for AGIs $75k-100k)
Taxable individual retirement arrangement distribution: $13,383 (reported on 13.6% of returns)
01379:
$13,383
Massachusetts:
$22,790
(% of AGI for various income ranges: 447.8% for AGIs $25k-50k, 1333.3% for AGIs $75k-100k)
Total itemized deductions: $18,167 (reported on 6.8% of returns)
Here:
$18,167
State:
$36,722
(% of AGI for various income ranges: 605.6% for AGIs $25k-50k)
Taxes paid: $7,033 (reported on 6.8% of returns)
01379:
$7,033
State:
$8,782
(% of AGI for various income ranges: 234.4% for AGIs $25k-50k)
Earned income credit: $1,667 (reported on 13.6% of returns)
Here:
$1,667
State:
$1,909
(% of AGI for various income ranges: 111.1% for AGIs below $25k)
Percentage of individuals using paid preparers for their 2020 taxes: 88.6%
Here:
89%
State:
92%
(% for various income ranges: 86.7% for AGIs below $25k, 91.7% for AGIs $25k-50k, 85.7% for AGIs $50k-75k, 100.0% for AGIs $75k-100k, 83.3% for AGIs $100k-200k)
Averages for the 2012 tax year for zip code 01379, filed in 2013:
Average Adjusted Gross Income (AGI) in 2012: $43,141 (Individual Income Tax Returns)
Here:
$43,141
State:
$81,425
Salary/wage: $35,721 (reported on 82.9% of returns)
Here:
$35,721
State:
$64,752
(% of AGI for various income ranges: 52.2% for AGIs below $25k, 80.9% for AGIs $25k-50k, 66.5% for AGIs $50k-75k, 72.7% for AGIs $75k-100k, 63.5% for AGIs $100k-200k)
Taxable interest for individuals: $627 (reported on 36.6% of returns)
This zip code:
$627
Massachusetts:
$2,136
(% of AGI for various income ranges: 1.4% for AGIs below $25k, 0.3% for AGIs $25k-50k, 0.2% for AGIs $50k-75k, 1.4% for AGIs $75k-100k)
Ordinary dividends: $3,880 (reported on 24.4% of returns)
Here:
$3,880
State:
$9,473
(% of AGI for various income ranges: 6.8% for AGIs below $25k, 1.1% for AGIs $50k-75k, 6.4% for AGIs $75k-100k)
Net capital gain/loss in AGI: +$957 (reported on 17.1% of returns)
Here:
+$957
State:
+$31,437
(% of AGI for various income ranges: 2.6% for AGIs $75k-100k)
Profit/loss from business: +$7,800 (reported on 26.8% of returns)
Here:
+$7,800
State:
+$20,662
Taxable individual retirement arrangement distribution: $9,600 (reported on 7.3% of returns)
01379:
$9,600
Massachusetts:
$18,892
Total itemized deductions: $15,153 (23% of AGI, reported on 36.6% of returns)
Here:
$15,153
State:
$28,907
Here:
23.1% of AGI
State:
18.2% of AGI
(% of AGI for various income ranges: 13.5% for AGIs below $25k, 10.7% for AGIs $25k-50k, 12.3% for AGIs $50k-75k, 16.5% for AGIs $75k-100k, 12.1% for AGIs $100k-200k)
Charity contributions: $1,950 (reported on 24.4% of returns)
Here:
$1,950
State:
$4,208
(% of AGI for various income ranges: 0.9% for AGIs below $25k, 1.2% for AGIs $50k-75k, 2.7% for AGIs $75k-100k, 0.8% for AGIs $100k-200k)
Taxes paid: $6,780 (reported on 36.6% of returns)
01379:
$6,780
State:
$13,303
(% of AGI for various income ranges: 7.0% for AGIs $25k-50k, 5.6% for AGIs $50k-75k, 6.6% for AGIs $75k-100k, 6.7% for AGIs $100k-200k)
Earned income credit: $1,100 (reported on 17.1% of returns)
Here:
$1,100
State:
$1,971
(% of AGI for various income ranges: 4.3% for AGIs below $25k)
Percentage of individuals using paid preparers for their 2012 taxes: 46.3%
Here:
46%
State:
56%
(% for various income ranges: 43.8% for AGIs below $25k, 40.0% for AGIs $25k-50k, 50.0% for AGIs $50k-75k, 100.0% for AGIs $75k-100k)
Averages for the 2004 tax year for zip code 01379, filed in 2005:
Average Adjusted Gross Income (AGI) in 2004: $38,198 (Individual Income Tax Returns)
Here:
$38,198
State:
$62,877
Salary/wage: $35,727 (reported on 86.4% of returns)
Here:
$35,727
State:
$52,969
(% of AGI for various income ranges: 89.3% for AGIs below $10k, 74.2% for AGIs $10k-25k, 85.4% for AGIs $25k-50k, 87.7% for AGIs $50k-75k, 77.9% for AGIs $75k-100k, 69.8% for AGIs over 100k)
Taxable interest for individuals: $721 (reported on 49.6% of returns)
This zip code:
$721
Massachusetts:
$1,945
(% of AGI for various income ranges: 4.4% for AGIs below $10k, 0.6% for AGIs $10k-25k, 0.9% for AGIs $25k-50k, 0.6% for AGIs $50k-75k, 0.3% for AGIs $75k-100k, 1.8% for AGIs over 100k)
Taxable dividends: $2,425 (reported on 23.6% of returns)
Here:
$2,425
State:
$5,323
(% of AGI for various income ranges: 9.7% for AGIs below $10k, 0.8% for AGIs $25k-50k, 2.1% for AGIs $50k-75k, 2.5% for AGIs over 100k)
Net capital gain/loss: +$3,242 (reported on 17.9% of returns)
Here:
+$3,242
State:
+$20,377
(% of AGI for various income ranges: -0.7% for AGIs below $10k, 0.6% for AGIs $25k-50k, -0.2% for AGIs $50k-75k, 9.2% for AGIs $75k-100k)
Profit/loss from business: +$8,660 (reported on 25.5% of returns)
Here:
+$8,660
State:
+$17,837
(% of AGI for various income ranges: 33.6% for AGIs below $10k, 19.1% for AGIs $10k-25k, 6.7% for AGIs $25k-50k, 1.5% for AGIs $50k-75k, 7.2% for AGIs $75k-100k)
IRA payment deduction: $3,421 (reported on 5.1% of returns)
01379:
$3,421
Massachusetts:
$3,100
Total itemized deductions: $13,183 (21% of AGI, reported on 32.5% of returns)
Here:
$13,183
State:
$22,573
Here:
20.9% of AGI
State:
19.5% of AGI
(% of AGI for various income ranges: 32.6% for AGIs below $10k, 10.3% for AGIs $25k-50k, 11.8% for AGIs $50k-75k, 11.9% for AGIs $75k-100k, 13.9% for AGIs over 100k)
Charity contributions deductions: $1,150 (2% of AGI, reported on 27.1% of returns)
Here:
$1,150
State:
$3,295
Here:
1.7% of AGI
State:
2.7% of AGI
(% of AGI for various income ranges: 0.9% for AGIs $25k-50k, 0.6% for AGIs $50k-75k, 1.0% for AGIs $75k-100k, 1.3% for AGIs over 100k)
Total tax: $4,905 (reported on 82.4% of returns)
01379:
$4,905
State:
$11,494
(% of AGI for various income ranges: 6.4% for AGIs below $10k, 6.8% for AGIs $10k-25k, 8.3% for AGIs $25k-50k, 9.6% for AGIs $50k-75k, 12.4% for AGIs $75k-100k, 15.8% for AGIs over 100k)
Earned income credit: $1,140 (reported on 15.4% of returns)
Here:
$1,140
State:
$1,518
Percentage of individuals using paid preparers for their 2004 taxes: 40.7%
Here:
41%
State:
58%
(% for various income ranges: 33.3% for AGIs below $10k, 38.6% for AGIs $10k-25k, 45.0% for AGIs $25k-50k, 36.2% for AGIs $50k-75k, 44.0% for AGIs $75k-100k, 61.9% for AGIs over 100k)
Likely homosexual households (counted as self-reported same-sex unmarried-partner households)
Lesbian couples: 1.3% of all households
Gay men: 0.3% of all households
Household received Food Stamps/SNAP in the past 12 months: 103 Household did not receive Food Stamps/SNAP in the past 12 months: 278
Women who had a birth in the past 12 months: 2 (0 now married, 2 unmarried) Women who did not have a birth in the past 12 months: 133 (58 now married, 74 unmarried)
Housing units in zip code 01379 with a mortgage: 194 (45 second mortgage, 9 home equity loan, 19 both second mortgage and home equity loan) Houses without a mortgage: 5
Median monthly owner costs for units with a mortgage: $1,584 Median monthly owner costs for units without a mortgage: $705
Residents with income below the poverty level in 2022:
This zip code:
16.4%
Whole state:
10.4%
Residents with income below 50% of the poverty level in 2022:
This zip code:
6.8%
Whole state:
5.1%
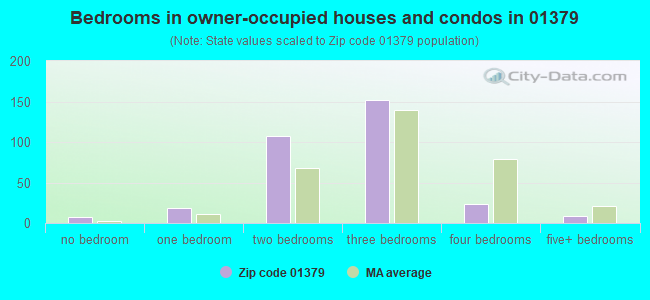
Median number of rooms in houses and condos:
Here:
5.8
State:
6.5
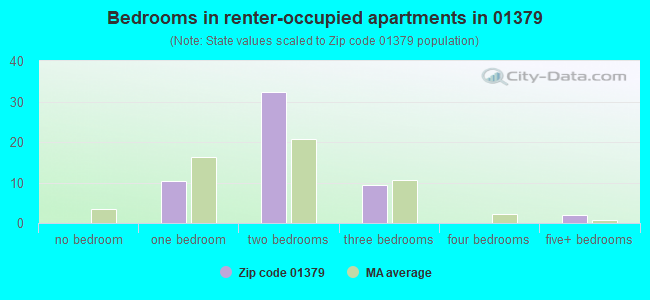
Median number of rooms in apartments:
Here:
4.5
State:
4.0
Notable locations in this zip code not listed on our city pages
In group quarters: 8 (-1 institutionalized population)
Size of family households: 110 2-persons, 77 3-persons, 30 4-persons
Size of nonfamily households: 101 1-person, 56 2-persons
68 married couples with children.
34 single-parent households (15 men, 19 women).
95.8% of residents of 01379 zip code speak English at home.
0.5% of residents speak Spanish at home (100% very well).
0.3% of residents speak other Indo-European language at home (100% very well).
3.3% of residents speak Asian or Pacific Island language at home (28% very well, 72% well).
Foreign born population: 28 (3.7%) (71.8% of them are naturalized citizens)
This zip code:
3.7%
Whole state:
18.0%
36%Malaysia
18%Taiwan
11%Romania
11%Bhutan
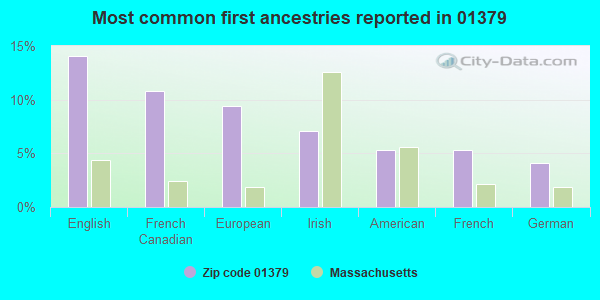
14%English
11%French Canadian
9%European
7%Irish
5%American
5%French
4%German
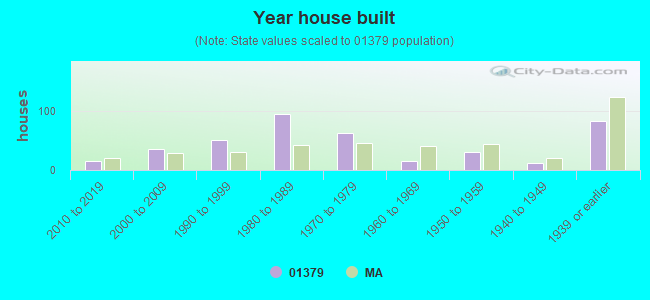
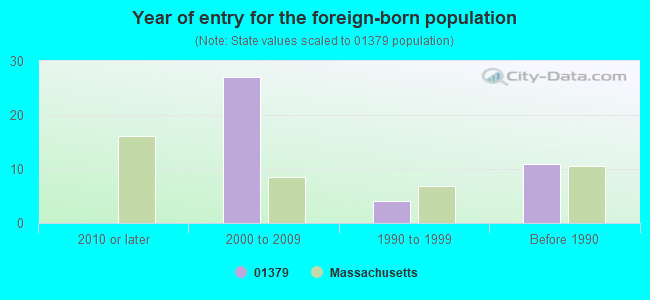
Year of entry for the foreign-born population
02010 or later
272000 to 2009
41990 to 1999
11Before 1990
Facilities with environmental interests located in this zip code:
MORMON HOLLOW AUTO (178 MORMON HOLLOW RD in WENDELL, MA)
Conditionally Exempt Small Quantity Generators, less than 100 kg/month of hazardous waste (Resource Conservation and Recovery Act (tracking hazardous waste)) - notification Alternative names: MORMON HOLLOW AUTO SALVAGE
Housing units lacking complete plumbing facilities: 3.4% Housing units lacking complete kitchen facilities: 3.2%
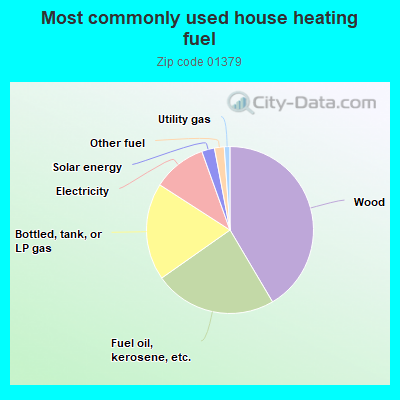
41.8%Wood
23.9%Fuel oil, kerosene, etc.
19.0%Bottled, tank, or LP gas
10.5%Electricity
2.5%Solar energy
1.9%Other fuel
1.1%Utility gas
Population in 1990: 393. Population change in the 1990s: +498 (+126.7%).
Place of birth for U.S.-born residents:
This state: 464
Northeast: 175
Midwest: 31
South: 29
West: 29
65% of the 01379 zip code residents lived in the same house 5 years ago. Out of people who lived in different houses, 39% lived in this county. Out of people who lived in different counties, 50% lived in Massachusetts.
95% of the 01379 zip code residents lived in the same house 1 year ago. Out of people who lived in different houses, 33% moved from this county. Out of people who lived in different houses, 57% moved from different county within same state. Out of people who lived in different houses, 10% moved from abroad.
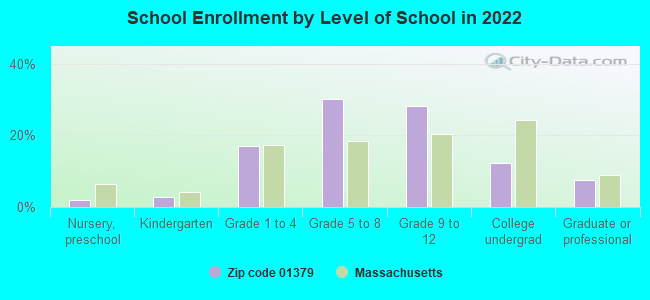
Private vs. public school enrollment:
Students in private schools in grades 1 to 8 (elementary and middle school): 6
Here:
13.0%
Massachusetts:
10.3%
Students in private schools in grades 9 to 12 (high school): 3
Here:
10.1%
Massachusetts:
12.3%
Students in private undergraduate colleges:
Here:
0.0%
Massachusetts:
51.2%
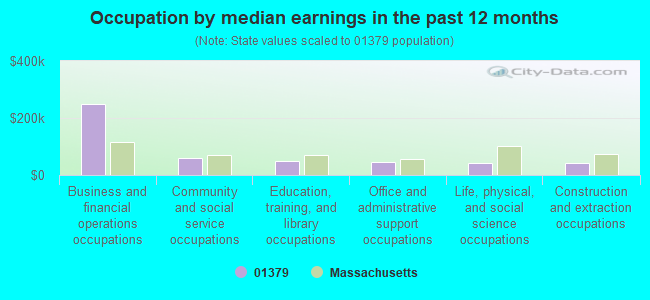
Occupation by median earnings in the past 12 months ($)
248,598Business and financial operations occupations
58,823Community and social service occupations
50,591Education, training, and library occupations
44,042Office and administrative support occupations
43,373Life, physical, and social science occupations
42,588Construction and extraction occupations
Top industries in this zip code by the number of employees in 2005:
Educational Services: Elementary and Secondary Schools (100-249 employees: 1 establishment)
Wholesale Trade: Wholesale Trade Agents and Brokers (5-9: 1)
Wholesale Trade: Women's, Children's, and Infants' Clothing and Accessories Merchant Wholesalers (1-4: 1)
Professional, Scientific, and Technical Services: Administrative Management and General Management Consulting Services (1-4: 1)
Professional, Scientific, and Technical Services: Offices of Lawyers (1-4: 1)
Finance and Insurance: Claims Adjusting (1-4: 1)
Professional, Scientific, and Technical Services: Offices of Certified Public Accountants (1-4: 1)
Construction: New Single-Family Housing Construction (except Operative Builders) (1-4: 1)
People in group quarters in 2010:
5 people in group homes intended for adults
People in group quarters in 2000:
48 people in residential treatment centers for emotionally disturbed children
Fatal accident statistics in 2010:
Fatal accident count: 1
Vehicles involved in fatal accidents: 1
Fatal accidents caused by drunken drivers: 1
Fatalities: 1
Persons involved in fatal accidents: 3
Pedestrians involved in fatal accidents: 0
Home Mortgage Disclosure Act Aggregated Statistics For Year 2009 (Based on 2 partial tracts)
A) FHA, FSA/RHS & VA Home Purchase Loans
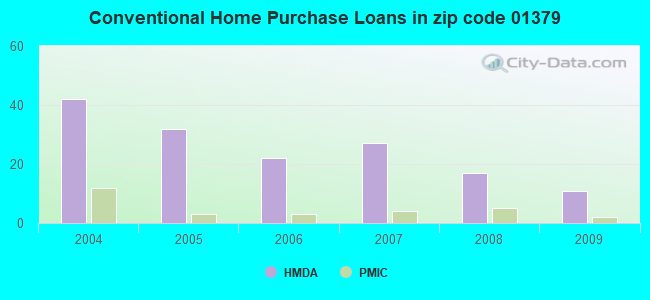
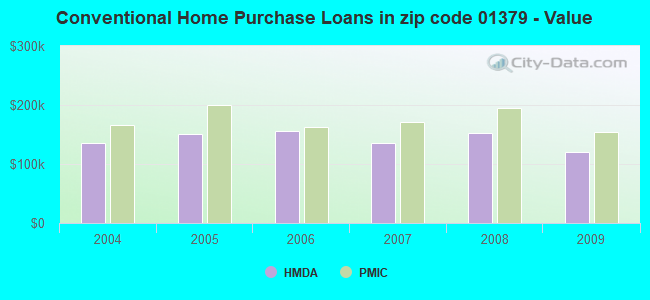
B) Conventional Home Purchase Loans
C) Refinancings
D) Home Improvement Loans
F) Non-occupant Loans on < 5 Family Dwellings (A B C & D)
G) Loans On Manufactured Home Dwelling (A B C & D)
Number
Average Value
Number
Average Value
Number
Average Value
Number
Average Value
Number
Average Value
Number
Average Value
LOANS ORIGINATED
2
$210,885
11
$120,975
49
$143,608
14
$64,525
4
$127,870
0
$0
APPLICATIONS APPROVED, NOT ACCEPTED
0
$0
1
$67,910
6
$126,053
0
$0
0
$0
0
$0
APPLICATIONS DENIED
1
$91,580
2
$135,815
16
$147,301
3
$56,277
0
$0
1
$53,580
APPLICATIONS WITHDRAWN
2
$123,355
1
$85,350
6
$145,678
0
$0
1
$49,840
0
$0
FILES CLOSED FOR INCOMPLETENESS
0
$0
1
$40,490
2
$236,740
0
$0
0
$0
0
$0
Aggregated Statistics For Year 2008 (Based on 2 partial tracts)
A) FHA, FSA/RHS & VA Home Purchase Loans
B) Conventional Home Purchase Loans
C) Refinancings
D) Home Improvement Loans
F) Non-occupant Loans on < 5 Family Dwellings (A B C & D)
G) Loans On Manufactured Home Dwelling (A B C & D)
Number
Average Value
Number
Average Value
Number
Average Value
Number
Average Value
Number
Average Value
Number
Average Value
LOANS ORIGINATED
3
$182,540
17
$152,378
32
$139,591
13
$46,725
2
$142,355
1
$66,040
APPLICATIONS APPROVED, NOT ACCEPTED
0
$0
1
$33,640
3
$147,443
2
$69,775
0
$0
1
$33,640
APPLICATIONS DENIED
1
$199,360
1
$118,370
22
$138,193
7
$62,567
0
$0
1
$3,120
APPLICATIONS WITHDRAWN
0
$0
2
$143,290
12
$165,614
0
$0
0
$0
0
$0
FILES CLOSED FOR INCOMPLETENESS
0
$0
0
$0
1
$329,570
0
$0
0
$0
0
$0
Aggregated Statistics For Year 2007 (Based on 2 partial tracts)
A) FHA, FSA/RHS & VA Home Purchase Loans
B) Conventional Home Purchase Loans
C) Refinancings
D) Home Improvement Loans
E) Loans on Dwellings For 5+ Families
F) Non-occupant Loans on < 5 Family Dwellings (A B C & D)
G) Loans On Manufactured Home Dwelling (A B C & D)
Number
Average Value
Number
Average Value
Number
Average Value
Number
Average Value
Number
Average Value
Number
Average Value
Number
Average Value
LOANS ORIGINATED
0
$0
27
$135,006
40
$131,874
26
$61,174
1
$77,880
7
$136,971
0
$0
APPLICATIONS APPROVED, NOT ACCEPTED
0
$0
2
$160,425
11
$134,851
1
$10,590
0
$0
1
$83,480
1
$36,760
APPLICATIONS DENIED
0
$0
3
$115,463
33
$182,973
10
$42,551
0
$0
2
$147,650
1
$87,840
APPLICATIONS WITHDRAWN
1
$72,890
2
$125,225
15
$141,795
1
$51,090
0
$0
1
$74,760
0
$0
FILES CLOSED FOR INCOMPLETENESS
0
$0
0
$0
2
$217,740
0
$0
0
$0
0
$0
0
$0
Aggregated Statistics For Year 2006 (Based on 2 partial tracts)
A) FHA, FSA/RHS & VA Home Purchase Loans
B) Conventional Home Purchase Loans
C) Refinancings
D) Home Improvement Loans
E) Loans on Dwellings For 5+ Families
F) Non-occupant Loans on < 5 Family Dwellings (A B C & D)
G) Loans On Manufactured Home Dwelling (A B C & D)
Number
Average Value
Number
Average Value
Number
Average Value
Number
Average Value
Number
Average Value
Number
Average Value
Number
Average Value
LOANS ORIGINATED
1
$118,370
22
$156,770
55
$126,877
21
$53,163
0
$0
4
$139,398
1
$79,740
APPLICATIONS APPROVED, NOT ACCEPTED
0
$0
4
$135,970
7
$140,353
2
$31,460
0
$0
1
$89,710
0
$0
APPLICATIONS DENIED
0
$0
5
$133,696
38
$142,765
11
$50,350
1
$925,150
2
$165,095
1
$77,880
APPLICATIONS WITHDRAWN
0
$0
4
$140,798
34
$148,109
1
$24,920
0
$0
2
$142,355
0
$0
FILES CLOSED FOR INCOMPLETENESS
0
$0
1
$168,210
5
$213,564
1
$18,690
0
$0
0
$0
0
$0
Aggregated Statistics For Year 2005 (Based on 2 partial tracts)
A) FHA, FSA/RHS & VA Home Purchase Loans
B) Conventional Home Purchase Loans
C) Refinancings
D) Home Improvement Loans
F) Non-occupant Loans on < 5 Family Dwellings (A B C & D)
G) Loans On Manufactured Home Dwelling (A B C & D)
Number
Average Value
Number
Average Value
Number
Average Value
Number
Average Value
Number
Average Value
Number
Average Value
LOANS ORIGINATED
2
$219,295
32
$151,408
63
$123,047
17
$66,478
6
$139,033
1
$92,830
APPLICATIONS APPROVED, NOT ACCEPTED
0
$0
5
$91,082
9
$138,721
0
$0
1
$81,610
0
$0
APPLICATIONS DENIED
0
$0
9
$137,960
28
$131,609
11
$50,746
2
$118,370
2
$79,745
APPLICATIONS WITHDRAWN
0
$0
11
$156,260
39
$136,485
6
$301,325
3
$128,960
0
$0
FILES CLOSED FOR INCOMPLETENESS
0
$0
1
$237,360
6
$139,967
0
$0
0
$0
0
$0
Aggregated Statistics For Year 2004 (Based on 2 partial tracts)
A) FHA, FSA/RHS & VA Home Purchase Loans
B) Conventional Home Purchase Loans
C) Refinancings
D) Home Improvement Loans
E) Loans on Dwellings For 5+ Families
F) Non-occupant Loans on < 5 Family Dwellings (A B C & D)
G) Loans On Manufactured Home Dwelling (A B C & D)


 Nearest zip codes: 01344, 01349, 01072, 01347, 01351, 01054.