Estimated zip code population in 2022: 1,630 Zip code population in 2010: 1,498 Zip code population in 2000: 871
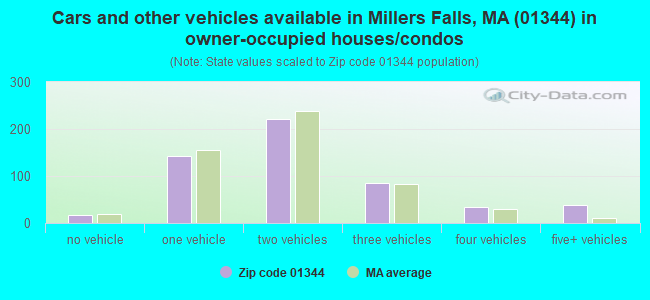
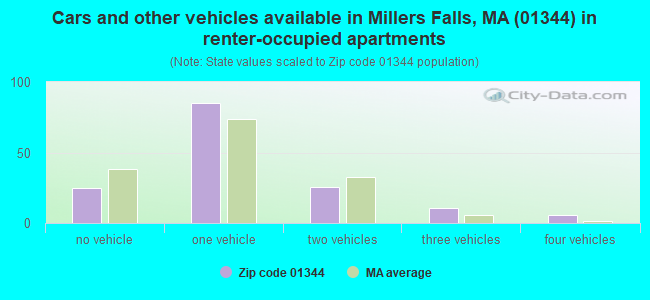
Houses and condos: 766 Renter-occupied apartments: 152
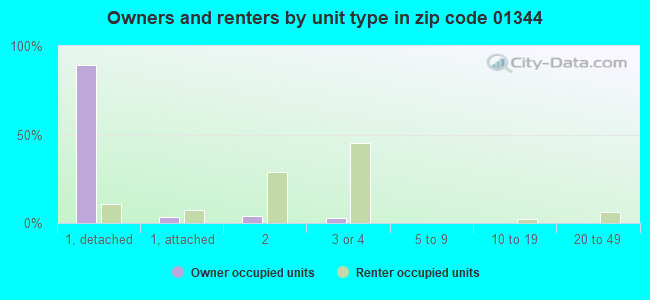
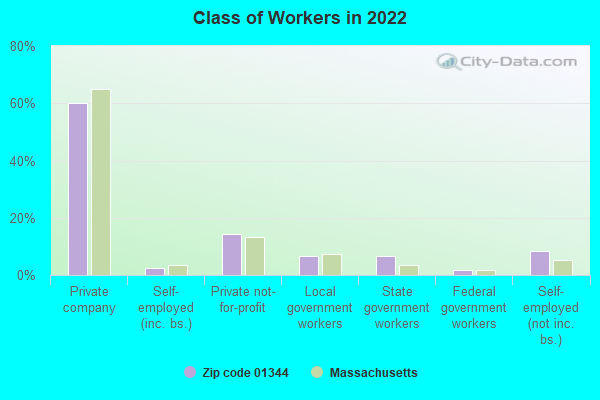
% of renters here:
22%
State:
38%
March 2022 cost of living index in zip code 01344: 85.2 (less than average, U.S. average is 100)
Land area: 13.6 sq. mi. Water area: 0.5 sq. mi.
Population density: 120 people per square mile
(very low).
OSM Map
Google Map
MSN Map
OSM Map
General Map
Google Map
MSN Map
OSM Map
Google Map
MSN Map
OSM Map
Google Map
MSN Map
Please wait while loading the map...
Real estate property taxes paid for housing units in 2022:
This zip code:
0.7% ($1,704)
Massachusetts:
1.0% ($5,536)
Median real estate property taxes paid for housing units with mortgages in 2022: $1,700 (0.7%) Median real estate property taxes paid for housing units with no mortgage in 2022: $1,714 (0.6%)
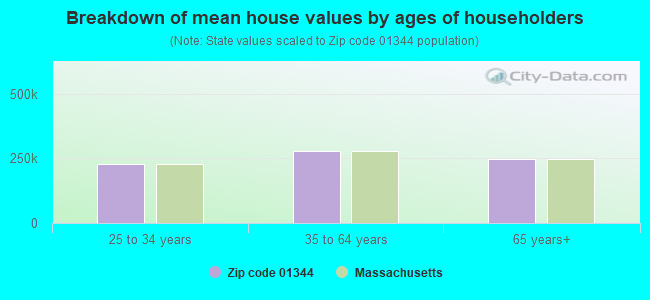
Estimated median house/condo value in 2022: $257,792
01344:
$257,792
Massachusetts:
$534,700
According to our research of Massachusetts and other state lists, there were 4 registered sex offenders living in 01344 zip code as of April 27, 2024. The ratio of all residents to sex offenders in zip code 01344 is 401 to 1.
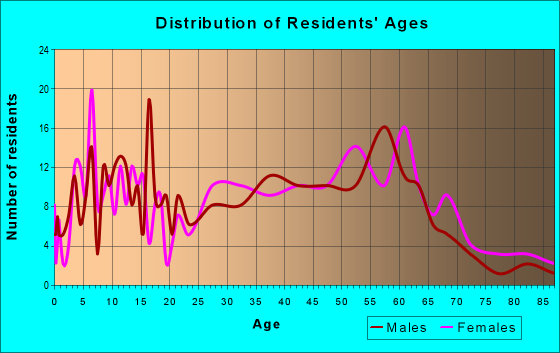
Median resident age:
This zip code:
43.7 years
Massachusetts median age:
40.3 years
Average household size:
This zip code:
2.4 people
Massachusetts:
2.4 people
Averages for the 2020 tax year for zip code 01344, filed in 2021:
Average Adjusted Gross Income (AGI) in 2020: $54,219 (Individual Income Tax Returns)
Here:
$54,219
State:
$105,130
Salary/wage: $47,866 (reported on 82.4% of returns)
Here:
$47,866
State:
$82,951
(% of AGI for various income ranges: 1071.2% for AGIs below $25k, 3474.5% for AGIs $25k-50k, 5998.2% for AGIs $50k-75k, 8181.4% for AGIs $75k-100k, 15647.5% for AGIs $100k-200k)
Taxable interest for individuals: $340 (reported on 29.4% of returns)
This zip code:
$340
Massachusetts:
$2,361
(% of AGI for various income ranges: 16.2% for AGIs below $25k, 4.0% for AGIs $25k-50k, 20.0% for AGIs $50k-75k, 21.4% for AGIs $75k-100k, 17.5% for AGIs $100k-200k)
Ordinary dividends: $1,727 (reported on 12.9% of returns)
Here:
$1,727
State:
$10,365
(% of AGI for various income ranges: 23.5% for AGIs $25k-50k, 51.8% for AGIs $50k-75k, 107.5% for AGIs $100k-200k)
Net capital gain/loss in AGI: +$6,170 (reported on 11.8% of returns)
Here:
+$6,170
State:
+$48,178
(% of AGI for various income ranges: 61.0% for AGIs $25k-50k, 120.0% for AGIs $50k-75k, 453.7% for AGIs $100k-200k)
Profit/loss from business: +$7,378 (reported on 10.6% of returns)
Here:
+$7,378
State:
+$20,792
(% of AGI for various income ranges: 38.1% for AGIs below $25k, 104.5% for AGIs $50k-75k, 625.0% for AGIs $100k-200k)
Taxable individual retirement arrangement distribution: $10,257 (reported on 8.2% of returns)
01344:
$10,257
Massachusetts:
$22,790
(% of AGI for various income ranges: 226.9% for AGIs below $25k, 322.7% for AGIs $50k-75k)
Total itemized deductions: $21,800 (reported on 2.4% of returns)
Here:
$21,800
State:
$36,722
(% of AGI for various income ranges: 218.0% for AGIs $25k-50k)
Taxes paid: $4,700 (reported on 2.4% of returns)
01344:
$4,700
State:
$8,782
(% of AGI for various income ranges: 47.0% for AGIs $25k-50k)
Earned income credit: $1,670 (reported on 11.8% of returns)
Here:
$1,670
State:
$1,909
(% of AGI for various income ranges: 61.9% for AGIs below $25k, 34.0% for AGIs $25k-50k)
Percentage of individuals using paid preparers for their 2020 taxes: 92.9%
Here:
93%
State:
92%
(% for various income ranges: 91.3% for AGIs below $25k, 92.0% for AGIs $25k-50k, 100.0% for AGIs $50k-75k, 90.0% for AGIs $75k-100k, 92.3% for AGIs $100k-200k)
Averages for the 2012 tax year for zip code 01344, filed in 2013:
Average Adjusted Gross Income (AGI) in 2012: $47,774 (Individual Income Tax Returns)
Here:
$47,774
State:
$81,425
Salary/wage: $43,784 (reported on 87.5% of returns)
Here:
$43,784
State:
$64,752
(% of AGI for various income ranges: 73.9% for AGIs below $25k, 83.4% for AGIs $25k-50k, 79.6% for AGIs $50k-75k, 89.1% for AGIs $75k-100k, 72.5% for AGIs $100k-200k)
Taxable interest for individuals: $304 (reported on 33.3% of returns)
This zip code:
$304
Massachusetts:
$2,136
(% of AGI for various income ranges: 0.7% for AGIs below $25k, 0.2% for AGIs $25k-50k, 0.2% for AGIs $50k-75k, 0.2% for AGIs $75k-100k, 0.1% for AGIs $100k-200k)
Ordinary dividends: $740 (reported on 13.9% of returns)
Here:
$740
State:
$9,473
(% of AGI for various income ranges: 0.5% for AGIs below $25k, 0.1% for AGIs $25k-50k, 0.3% for AGIs $50k-75k, 0.4% for AGIs $75k-100k)
Profit/loss from business: +$8,700 (reported on 9.7% of returns)
Here:
+$8,700
State:
+$20,662
(% of AGI for various income ranges: 3.5% for AGIs below $25k, 3.0% for AGIs $25k-50k, 3.0% for AGIs $50k-75k)
Taxable individual retirement arrangement distribution: $13,150 (reported on 8.3% of returns)
01344:
$13,150
Massachusetts:
$18,892
Total itemized deductions: $16,150 (21% of AGI, reported on 27.8% of returns)
Here:
$16,150
State:
$28,907
Here:
20.8% of AGI
State:
18.2% of AGI
(% of AGI for various income ranges: 6.8% for AGIs $25k-50k, 9.9% for AGIs $50k-75k, 10.8% for AGIs $75k-100k, 13.1% for AGIs $100k-200k)
Charity contributions: $1,385 (reported on 18.1% of returns)
Here:
$1,385
State:
$4,208
(% of AGI for various income ranges: 0.8% for AGIs $50k-75k, 0.7% for AGIs $75k-100k, 0.8% for AGIs $100k-200k)
Taxes paid: $5,590 (reported on 27.8% of returns)
01344:
$5,590
State:
$13,303
(% of AGI for various income ranges: 1.9% for AGIs $25k-50k, 3.2% for AGIs $50k-75k, 3.7% for AGIs $75k-100k, 5.3% for AGIs $100k-200k)
Earned income credit: $1,750 (reported on 13.9% of returns)
Here:
$1,750
State:
$1,971
(% of AGI for various income ranges: 4.5% for AGIs below $25k, 0.8% for AGIs $25k-50k)
Percentage of individuals using paid preparers for their 2012 taxes: 47.2%
Here:
47%
State:
56%
(% for various income ranges: 38.1% for AGIs below $25k, 50.0% for AGIs $25k-50k, 46.7% for AGIs $50k-75k, 50.0% for AGIs $75k-100k, 66.7% for AGIs $100k-200k)
Averages for the 2004 tax year for zip code 01344, filed in 2005:
Average Adjusted Gross Income (AGI) in 2004: $40,189 (Individual Income Tax Returns)
Here:
$40,189
State:
$62,877
Salary/wage: $37,404 (reported on 91.2% of returns)
Here:
$37,404
State:
$52,969
(% of AGI for various income ranges: 79.7% for AGIs below $10k, 80.3% for AGIs $10k-25k, 84.0% for AGIs $25k-50k, 88.9% for AGIs $50k-75k, 93.5% for AGIs $75k-100k, 64.8% for AGIs over 100k)
Taxable interest for individuals: $399 (reported on 46.5% of returns)
This zip code:
$399
Massachusetts:
$1,945
(% of AGI for various income ranges: 2.0% for AGIs below $10k, 0.8% for AGIs $10k-25k, 0.7% for AGIs $25k-50k, 0.3% for AGIs $50k-75k, 0.2% for AGIs $75k-100k, 0.1% for AGIs over 100k)
Taxable dividends: $448 (reported on 16.5% of returns)
Here:
$448
State:
$5,323
(% of AGI for various income ranges: 0.2% for AGIs $10k-25k, 0.2% for AGIs $25k-50k, 0.2% for AGIs $50k-75k, 0.1% for AGIs $75k-100k, 0.2% for AGIs over 100k)
Net capital gain/loss: +$1,679 (reported on 11.1% of returns)
Here:
+$1,679
State:
+$20,377
(% of AGI for various income ranges: -0.4% for AGIs below $10k, 0.4% for AGIs $25k-50k, 0.9% for AGIs $50k-75k, 0.4% for AGIs $75k-100k)
Profit/loss from business: +$3,692 (reported on 11.1% of returns)
Here:
+$3,692
State:
+$17,837
(% of AGI for various income ranges: 2.4% for AGIs $10k-25k, 1.9% for AGIs $25k-50k, 0.5% for AGIs $50k-75k, 0.3% for AGIs $75k-100k)
Total itemized deductions: $12,964 (20% of AGI, reported on 27.8% of returns)
Here:
$12,964
State:
$22,573
Here:
20.4% of AGI
State:
19.5% of AGI
(% of AGI for various income ranges: 5.7% for AGIs $10k-25k, 6.0% for AGIs $25k-50k, 10.5% for AGIs $50k-75k, 10.8% for AGIs $75k-100k, 14.7% for AGIs over 100k)
Charity contributions deductions: $1,261 (2% of AGI, reported on 22.3% of returns)
Here:
$1,261
State:
$3,295
Here:
1.9% of AGI
State:
2.7% of AGI
(% of AGI for various income ranges: 1.5% for AGIs below $10k, 0.3% for AGIs $25k-50k, 1.0% for AGIs $50k-75k, 1.0% for AGIs $75k-100k, 0.9% for AGIs over 100k)
Total tax: $4,253 (reported on 83.0% of returns)
01344:
$4,253
State:
$11,494
(% of AGI for various income ranges: 2.4% for AGIs below $10k, 5.1% for AGIs $10k-25k, 7.6% for AGIs $25k-50k, 8.4% for AGIs $50k-75k, 10.6% for AGIs $75k-100k, 14.6% for AGIs over 100k)
Earned income credit: $1,124 (reported on 12.6% of returns)
Here:
$1,124
State:
$1,518
Percentage of individuals using paid preparers for their 2004 taxes: 50.6%
Here:
51%
State:
58%
(% for various income ranges: 42.6% for AGIs below $10k, 50.0% for AGIs $10k-25k, 50.8% for AGIs $25k-50k, 54.7% for AGIs $50k-75k, 52.5% for AGIs $75k-100k, 56.5% for AGIs over 100k)
Household received Food Stamps/SNAP in the past 12 months: 125 Household did not receive Food Stamps/SNAP in the past 12 months: 569
Women who had a birth in the past 12 months: 4 (2 now married, 2 unmarried) Women who did not have a birth in the past 12 months: 382 (176 now married, 203 unmarried)
Housing units in zip code 01344 with a mortgage: 382 (50 second mortgage, 41 both second mortgage and home equity loan) Houses without a mortgage: 25
Median monthly owner costs for units with a mortgage: $1,431 Median monthly owner costs for units without a mortgage: $476
Residents with income below the poverty level in 2022:
This zip code:
8.3%
Whole state:
10.4%
Residents with income below 50% of the poverty level in 2022:
This zip code:
4.9%
Whole state:
5.1%
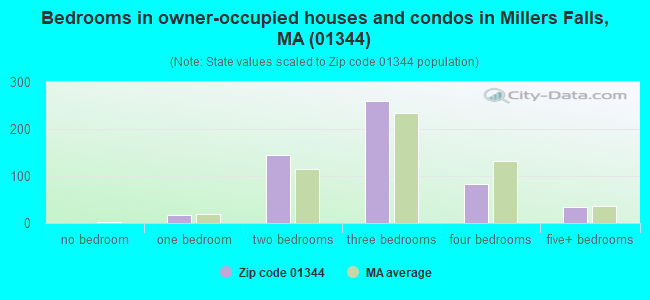
Median number of rooms in houses and condos:
Here:
6.1
State:
6.5
Median number of rooms in apartments:
Here:
4.7
State:
4.0
Notable locations in this zip code not listed on our city pages
Notable locations in zip code 01344: Erving Fire Department Station 2 (A), Erving Fire Department Station 1 (B), Erving Elementary School Library (C). Display/hide their locations on the map
Size of family households: 144 2-persons, 107 3-persons, 119 4-persons, 26 5-persons, 11 6-persons, 1 7-or-more-persons
Size of nonfamily households: 210 1-person, 61 2-persons, 7 3-persons
222 married couples with children.
54 single-parent households (54 women).
95.8% of residents of 01344 zip code speak English at home.
0.4% of residents speak Spanish at home (50% very well, 50% well).
1.9% of residents speak other Indo-European language at home (67% very well, 7% well, 27% not well).
0.6% of residents speak Asian or Pacific Island language at home (100% very well).
0.5% of residents speak other language at home (100% very well).
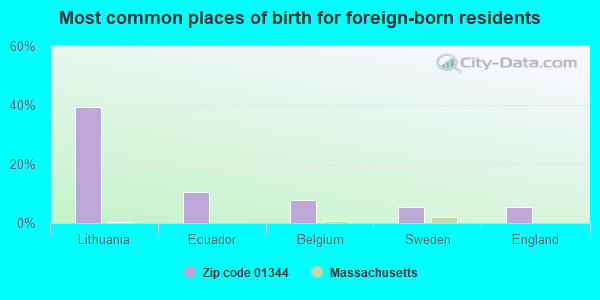
Foreign born population: 38 (2.4%) (45.2% of them are naturalized citizens)
This zip code:
2.4%
Whole state:
18.0%
39%Lithuania
11%Ecuador
8%Belgium
5%Sweden
5%England
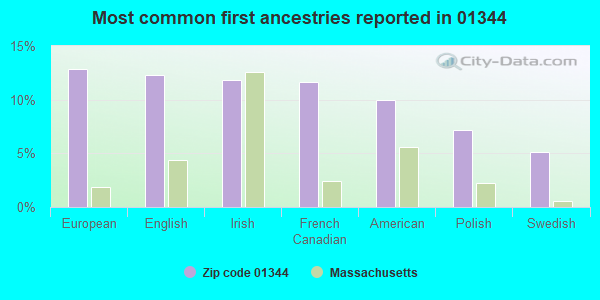
13%European
12%English
12%Irish
12%French Canadian
10%American
7%Polish
5%Swedish
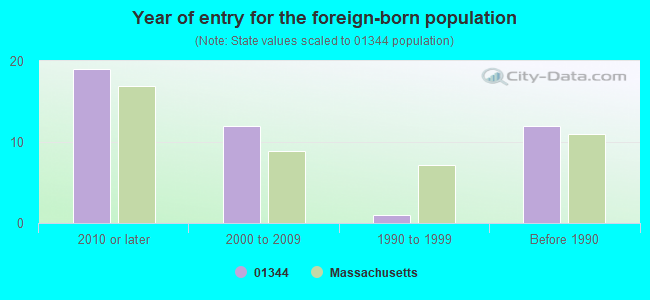
Year of entry for the foreign-born population
192010 or later
122000 to 2009
11990 to 1999
12Before 1990
Facilities with environmental interests located in this zip code:
ERVING CENTER WASTE WATER TREATMENT PLANT (ROUTE 2 in ERVING, MA)
AIR MONITORING SITE (Airborne pollution emission tracking) National Pollutant Discharge Elimination System MAJOR (Tracking pollutant discharge elimination systems) - permit - ICIS-, ENFORCEMENT/COMPLIANCE ACTIVITY, Business SIC classification: SEWERAGE SYSTEMS Organizations: TOWN OF ERVING (CONTACT/OWNER)
Alternative names: ERVING CENTER W W T P
ERVING ELEMENTARY (28 NORTHFIELD RD in ERVING, MA)
(National Center for Education Statistics) - STATE ID-091030
ERVING PAPER MILLS INC (97 EAST MAIN STREET in ERVING, MA)
AIR MAJOR (AIRS/AFS) CRITERIA AND HAZARDOUS AIR POLLUTANT INVENTORY (Inventory of air pollution sources) Small Quantity Generators, between 100 kg and 1000 kg of hazardous waste/month (Resource Conservation and Recovery Act (tracking hazardous waste)) - notification TRI REPORTER (Tracking of toxic chemicals releasing facilities) Business SIC classification: PAPER MILLS
ERVING CENTER WWTP #2 (45 EAST MAIN ST in ERVING, MA)
(Resource Conservation and Recovery Act (tracking hazardous waste)) Organizations: ERVING PAPER MILL (CONTACT/OPERATOR)
ERVING POTW #3 ((VILLAGE OF FARLEY) in ERVING, MA)
National Pollutant Discharge Elimination System NON-MAJOR (Tracking pollutant discharge elimination systems) - permit Business SIC classification: SEWERAGE SYSTEMS
KOCH ROBERT W (MILLERS FALLS RD in ERVING, MA)
(Resource Conservation and Recovery Act (tracking hazardous waste))
MA HIGHWAY (RTE 2 in ERVING, MA)
Conditionally Exempt Small Quantity Generators, less than 100 kg/month of hazardous waste (Resource Conservation and Recovery Act (tracking hazardous waste)) - notification Organizations: COMM OF MASS (CONTACT/OWNER)
Alternative names: COMM OF MA DPW
ERVING (3 MAIN STREET in ERVING, MA)
AIR MINOR (AIRS/AFS) Business SIC classification: GENERAL GOVERNMENT
ERVING P O T W NUMBER 1 (16 PUBLICWORKS BLVD. in ERVING, MA)
National Pollutant Discharge Elimination System MAJOR (Tracking pollutant discharge elimination systems) - permit Business SIC classification: SEWERAGE SYSTEMS Organizations: ERVING P O T W #1 (CONTACT/OPERATOR)
, TOWN OF ERVING (CONTACT/OWNER)
ERVING LANDFILL (ZILINSKI RD in ERVING, MA)
CRITERIA AND HAZARDOUS AIR POLLUTANT INVENTORY (Inventory of air pollution sources) Business SIC classification: REFUSE SYSTEMS Business NAICS classification: SOLID WASTE LANDFILL.
ERVING PAPER MILLS (ARCH ST. BOX 38 in ERVING, MA)
COMPLIANCE ACTIVITY (Tracking inspections of insecticide, fungicide, and rodenticide, and toxic substances) Business SIC classification: PAPER MILLS; SANITARY PAPER PRODUCTS; TRUCKING, EXCEPT LOCAL; WATER SUPPLY; CATALOG AND MAIL-ORDER HOUSES
Housing units lacking complete plumbing facilities: 2.5% Housing units lacking complete kitchen facilities: 1.3%
66.2%Fuel oil, kerosene, etc.
13.6%Bottled, tank, or LP gas
8.0%Wood
7.6%Electricity
2.8%Other fuel
1.3%Utility gas
0.7%No fuel used
Population in 1990: 635. Population change in the 1990s: +236 (+37.2%).
Place of birth for U.S.-born residents:
This state: 1,301
Northeast: 162
Midwest: 18
South: 61
West: 29
66% of the 01344 zip code residents lived in the same house 5 years ago. Out of people who lived in different houses, 79% lived in this county. Out of people who lived in different counties, 50% lived in Massachusetts.
96% of the 01344 zip code residents lived in the same house 1 year ago. Out of people who lived in different houses, 67% moved from this county. Out of people who lived in different houses, 4% moved from different county within same state. Out of people who lived in different houses, 29% moved from different state.
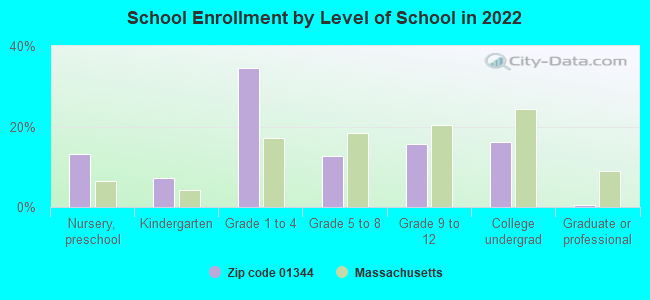
Private vs. public school enrollment:
Students in private schools in grades 1 to 8 (elementary and middle school): 13
Here:
8.6%
Massachusetts:
10.3%
Students in private schools in grades 9 to 12 (high school): 7
Here:
13.7%
Massachusetts:
12.3%
Students in private undergraduate colleges: 9
Here:
19.2%
Massachusetts:
51.2%
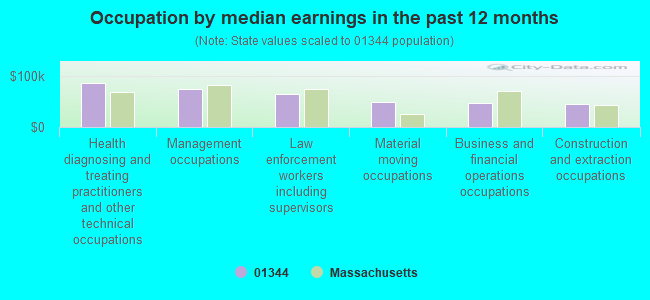
Occupation by median earnings in the past 12 months ($)
86,041Health diagnosing and treating practitioners and other technical occupations
73,400Management occupations
63,895Law enforcement workers including supervisors
48,705Material moving occupations
47,233Business and financial operations occupations
44,597Construction and extraction occupations
Top industries in this zip code by the number of employees in 2005:
Accommodation and Food Services: Full-Service Restaurants (10-19 employees: 2 establishments)
Accommodation and Food Services: Hotels (except Casino Hotels) and Motels (10-19: 1)
Arts, Entertainment, and Recreation: Bowling Centers (10-19: 1)
Other Services (except Public Administration): General Automotive Repair (5-9: 1)
Utilities: Water Supply and Irrigation Systems (5-9: 1)
Management of Companies and Enterprises: Corporate, Subsidiary, and Regional Managing Offices (5-9: 1)
Finance and Insurance: Miscellaneous Intermediation (1-4: 1)
Home Mortgage Disclosure Act Aggregated Statistics For Year 2009 (Based on 2 partial tracts)
A) FHA, FSA/RHS & VA Home Purchase Loans
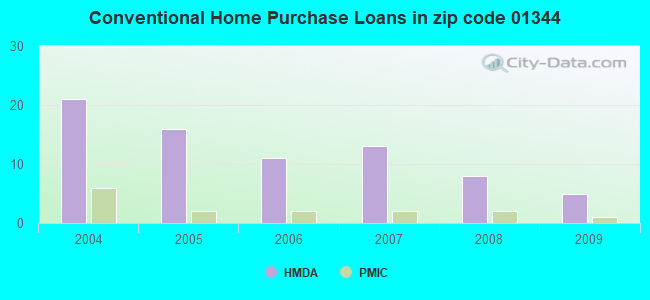
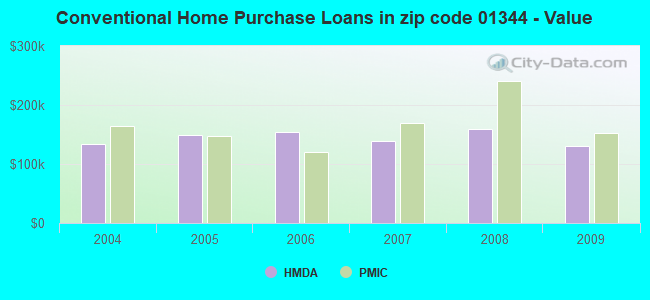
B) Conventional Home Purchase Loans
C) Refinancings
D) Home Improvement Loans
F) Non-occupant Loans on < 5 Family Dwellings (A B C & D)
Number
Average Value
Number
Average Value
Number
Average Value
Number
Average Value
Number
Average Value
LOANS ORIGINATED
1
$207,970
5
$131,236
24
$144,576
7
$63,634
2
$126,105
APPLICATIONS APPROVED, NOT ACCEPTED
0
$0
0
$0
3
$124,313
0
$0
0
$0
APPLICATIONS DENIED
0
$0
1
$133,940
8
$145,268
2
$41,625
0
$0
APPLICATIONS WITHDRAWN
1
$121,650
1
$42,090
3
$143,667
0
$0
0
$0
FILES CLOSED FOR INCOMPLETENESS
0
$0
0
$0
1
$233,470
0
$0
0
$0
Aggregated Statistics For Year 2008 (Based on 2 partial tracts)
A) FHA, FSA/RHS & VA Home Purchase Loans
B) Conventional Home Purchase Loans
C) Refinancings
D) Home Improvement Loans
F) Non-occupant Loans on < 5 Family Dwellings (A B C & D)
G) Loans On Manufactured Home Dwelling (A B C & D)
Number
Average Value
Number
Average Value
Number
Average Value
Number
Average Value
Number
Average Value
Number
Average Value
LOANS ORIGINATED
2
$135,015
8
$159,668
16
$137,664
6
$49,920
1
$140,390
1
$32,560
APPLICATIONS APPROVED, NOT ACCEPTED
0
$0
0
$0
2
$109,055
1
$68,810
0
$0
0
$0
APPLICATIONS DENIED
1
$98,300
0
$0
11
$136,285
3
$71,987
0
$0
0
$0
APPLICATIONS WITHDRAWN
0
$0
1
$141,310
6
$163,328
0
$0
0
$0
0
$0
FILES CLOSED FOR INCOMPLETENESS
0
$0
0
$0
1
$162,510
0
$0
0
$0
0
$0
Aggregated Statistics For Year 2007 (Based on 2 partial tracts)
B) Conventional Home Purchase Loans
C) Refinancings
D) Home Improvement Loans
F) Non-occupant Loans on < 5 Family Dwellings (A B C & D)
G) Loans On Manufactured Home Dwelling (A B C & D)
Number
Average Value
Number
Average Value
Number
Average Value
Number
Average Value
Number
Average Value
LOANS ORIGINATED
13
$138,264
20
$130,053
13
$60,329
4
$118,195
0
$0
APPLICATIONS APPROVED, NOT ACCEPTED
1
$158,210
5
$146,288
1
$5,220
0
$0
0
$0
APPLICATIONS DENIED
2
$85,400
16
$186,086
5
$41,964
1
$145,610
1
$43,320
APPLICATIONS WITHDRAWN
1
$123,490
7
$149,826
1
$25,190
0
$0
0
$0
FILES CLOSED FOR INCOMPLETENESS
0
$0
1
$214,730
0
$0
0
$0
0
$0
Aggregated Statistics For Year 2006 (Based on 2 partial tracts)
B) Conventional Home Purchase Loans
C) Refinancings
D) Home Improvement Loans
F) Non-occupant Loans on < 5 Family Dwellings (A B C & D)
Number
Average Value
Number
Average Value
Number
Average Value
Number
Average Value
LOANS ORIGINATED
11
$154,605
27
$127,443
10
$55,050
2
$137,470
APPLICATIONS APPROVED, NOT ACCEPTED
2
$134,095
4
$121,112
1
$31,030
0
$0
APPLICATIONS DENIED
2
$164,815
19
$140,795
5
$54,620
1
$162,820
APPLICATIONS WITHDRAWN
2
$138,855
17
$146,065
0
$0
1
$140,390
FILES CLOSED FOR INCOMPLETENESS
1
$82,940
2
$263,270
0
$0
0
$0
Aggregated Statistics For Year 2005 (Based on 2 partial tracts)
A) FHA, FSA/RHS & VA Home Purchase Loans
B) Conventional Home Purchase Loans
C) Refinancings
D) Home Improvement Loans
F) Non-occupant Loans on < 5 Family Dwellings (A B C & D)
G) Loans On Manufactured Home Dwelling (A B C & D)
Number
Average Value
Number
Average Value
Number
Average Value
Number
Average Value
Number
Average Value
Number
Average Value
LOANS ORIGINATED
1
$216,270
16
$149,318
31
$123,306
9
$61,918
3
$137,113
1
$45,770
APPLICATIONS APPROVED, NOT ACCEPTED
0
$0
2
$112,280
4
$153,908
0
$0
1
$40,240
0
$0
APPLICATIONS DENIED
0
$0
5
$122,450
14
$129,792
5
$55,050
1
$116,740
1
$78,640
APPLICATIONS WITHDRAWN
0
$0
5
$169,512
19
$138,143
3
$297,163
2
$95,385
0
$0
FILES CLOSED FOR INCOMPLETENESS
0
$0
1
$117,040
3
$138,037
0
$0
0
$0
0
$0
Aggregated Statistics For Year 2004 (Based on 2 partial tracts)
A) FHA, FSA/RHS & VA Home Purchase Loans
B) Conventional Home Purchase Loans
C) Refinancings
D) Home Improvement Loans
F) Non-occupant Loans on < 5 Family Dwellings (A B C & D)
G) Loans On Manufactured Home Dwelling (A B C & D)
Detailed PMIC statistics for the following Tracts:0404.00
2002 - 2018 National Fire Incident Reporting System (NFIRS) incidents
Based on the data from the years 2002 - 2018 the average number of fires per year is 14. The highest number of fires - 27 took place in 2016, and the least - 0 in 2003. The data has a growing trend.
When looking into fire subcategories, the most incidents belonged to: Structure Fires (47.4%), and Outside Fires (36.5%).
Fire incident types reported to NFIRS in Zip Code 01344


 Nearest zip codes: 01379, 01360, 01349, 01354, 01378, 01347.


 Based on the data from the years 2002 - 2018 the average number of fires per year is 14. The highest number of fires - 27 took place in 2016, and the least - 0 in 2003. The data has a growing trend.
 When looking into fire subcategories, the most incidents belonged to: Structure Fires (47.4%), and Outside Fires (36.5%).