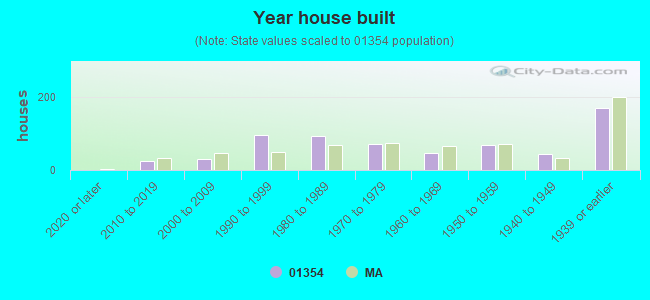
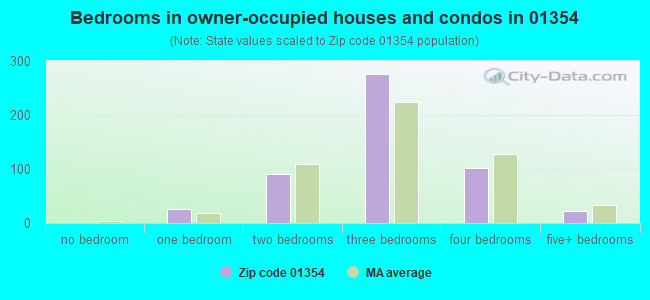
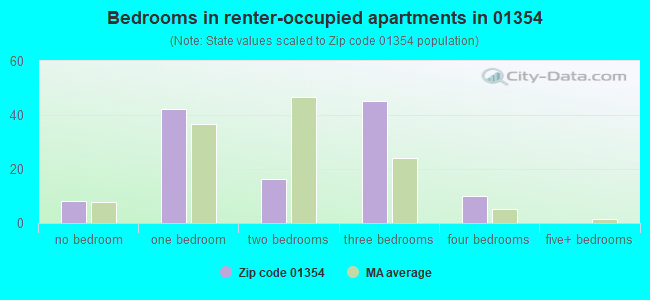
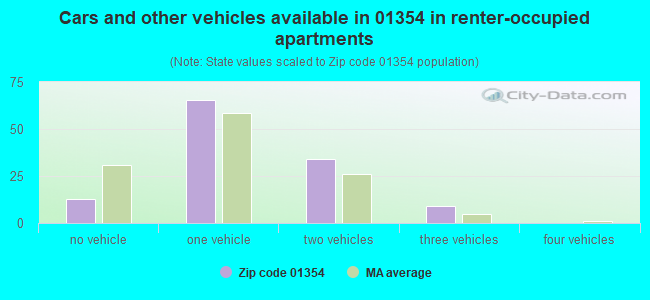
Houses and condos: 654 Renter-occupied apartments: 121
% of renters here:
19%
State:
38%
March 2022 cost of living index in zip code 01354: 83.4 (less than average, U.S. average is 100)
Land area: 13.8 sq. mi. Water area: 1.0 sq. mi.
Population density: 127 people per square mile
(very low).
OSM Map
Google Map
MSN Map
OSM Map
General Map
Google Map
MSN Map
OSM Map
Google Map
MSN Map
OSM Map
Google Map
MSN Map
Please wait while loading the map...
Real estate property taxes paid for housing units in 2022:
This zip code:
1.2% ($3,969)
Massachusetts:
1.0% ($5,536)
Median real estate property taxes paid for housing units with mortgages in 2022: $3,997 (1.1%) Median real estate property taxes paid for housing units with no mortgage in 2022: $3,946 (1.4%)
Business Search- 14 Million verified businesses
Males: 978
(56.0%)
Females: 768
(44.0%)
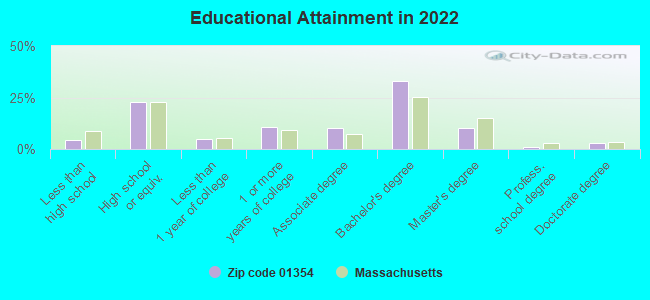
For population 25 years and over in 01354:
High school or higher: 95.4%
Bachelor's degree or higher: 47.2%
Graduate or professional degree: 14.5%
Unemployed: 3.7%
Mean travel time to work (commute): 20.4 minutes
For population 15 years and over in 01354:
Never married: 34.1%
Now married: 50.6%
Separated: 0.6%
Widowed: 2.6%
Divorced: 12.1%
Zip code 01354 compared to state average:
Median house value below state average.
Black race population percentage below state average.
Hispanic race population percentage significantly below state average.
Foreign-born population percentage below state average.
Renting percentage below state average.
Length of stay since moving in significantly above state average.
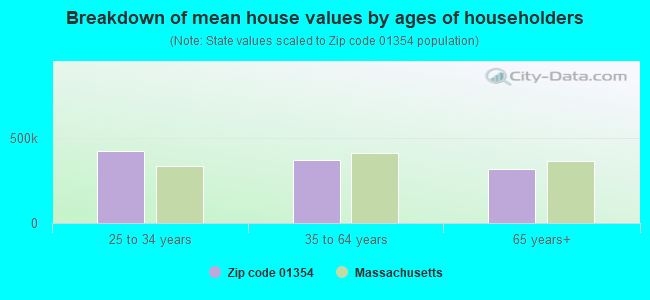
Estimated median house/condo value in 2022: $334,367
01354:
$334,367
Massachusetts:
$534,700
According to our research of Massachusetts and other state lists, there were 2 registered sex offenders living in 01354 zip code as of April 25, 2024. The ratio of all residents to sex offenders in zip code 01354 is 840 to 1.
Median resident age:
This zip code:
44.0 years
Massachusetts median age:
40.3 years
Average household size:
This zip code:
2.4 people
Massachusetts:
2.4 people
Averages for the 2020 tax year for zip code 01354, filed in 2021:
Average Adjusted Gross Income (AGI) in 2020: $66,116 (Individual Income Tax Returns)
Here:
$66,116
State:
$105,130
Salary/wage: $55,483 (reported on 77.8% of returns)
Here:
$55,483
State:
$82,951
(% of AGI for various income ranges: 1050.0% for AGIs below $25k, 3542.0% for AGIs $25k-50k, 7270.0% for AGIs $50k-75k, 8971.7% for AGIs $75k-100k, 20700.0% for AGIs $100k-200k)
Taxable interest for individuals: $797 (reported on 45.7% of returns)
This zip code:
$797
Massachusetts:
$2,361
(% of AGI for various income ranges: 35.5% for AGIs below $25k, 21.3% for AGIs $25k-50k, 27.8% for AGIs $50k-75k, 98.3% for AGIs $75k-100k, 175.0% for AGIs $100k-200k)
Ordinary dividends: $4,075 (reported on 29.6% of returns)
Here:
$4,075
State:
$10,365
(% of AGI for various income ranges: 50.9% for AGIs below $25k, 90.7% for AGIs $25k-50k, 76.7% for AGIs $50k-75k, 193.3% for AGIs $75k-100k, 751.2% for AGIs $100k-200k)
Net capital gain/loss in AGI: +$6,337 (reported on 23.5% of returns)
Here:
+$6,337
State:
+$48,178
(% of AGI for various income ranges: 10.9% for AGIs below $25k, 67.3% for AGIs $25k-50k, 166.7% for AGIs $50k-75k, 268.3% for AGIs $75k-100k, 975.0% for AGIs $100k-200k)
Profit/loss from business: +$13,560 (reported on 18.5% of returns)
Here:
+$13,560
State:
+$20,792
(% of AGI for various income ranges: 152.7% for AGIs below $25k, 294.7% for AGIs $25k-50k, 231.1% for AGIs $50k-75k, 226.7% for AGIs $75k-100k, 1350.0% for AGIs $100k-200k)
Taxable individual retirement arrangement distribution: $19,730 (reported on 12.3% of returns)
01354:
$19,730
Massachusetts:
$22,790
(% of AGI for various income ranges: 271.3% for AGIs $25k-50k, 556.7% for AGIs $50k-75k, 1331.2% for AGIs $100k-200k)
Total itemized deductions: $23,275 (reported on 4.9% of returns)
Here:
$23,275
State:
$36,722
(% of AGI for various income ranges: 1551.7% for AGIs $75k-100k)
Charity contributions: $4,450 (reported on 2.5% of returns)
Here:
$4,450
State:
$12,529
(% of AGI for various income ranges: 80.9% for AGIs below $25k)
Taxes paid: $7,500 (reported on 4.9% of returns)
01354:
$7,500
State:
$8,782
(% of AGI for various income ranges: 500.0% for AGIs $75k-100k)
Earned income credit: $1,433 (reported on 7.4% of returns)
Here:
$1,433
State:
$1,909
(% of AGI for various income ranges: 23.6% for AGIs below $25k, 40.0% for AGIs $25k-50k)
Percentage of individuals using paid preparers for their 2020 taxes: 93.8%
Here:
94%
State:
92%
(% for various income ranges: 89.5% for AGIs below $25k, 95.2% for AGIs $25k-50k, 93.3% for AGIs $50k-75k, 100.0% for AGIs $75k-100k, 93.3% for AGIs $100k-200k, 100.0% for AGIs over 200k)
Averages for the 2012 tax year for zip code 01354, filed in 2013:
Average Adjusted Gross Income (AGI) in 2012: $53,222 (Individual Income Tax Returns)
Here:
$53,222
State:
$81,425
Salary/wage: $46,085 (reported on 84.8% of returns)
Here:
$46,085
State:
$64,752
(% of AGI for various income ranges: 66.7% for AGIs below $25k, 80.7% for AGIs $25k-50k, 74.5% for AGIs $50k-75k, 79.9% for AGIs $75k-100k, 67.5% for AGIs $100k-200k)
Taxable interest for individuals: $664 (reported on 45.6% of returns)
This zip code:
$664
Massachusetts:
$2,136
(% of AGI for various income ranges: 1.4% for AGIs below $25k, 0.6% for AGIs $25k-50k, 0.8% for AGIs $50k-75k, 0.4% for AGIs $75k-100k, 0.4% for AGIs $100k-200k)
Ordinary dividends: $2,686 (reported on 27.8% of returns)
Here:
$2,686
State:
$9,473
(% of AGI for various income ranges: 1.2% for AGIs below $25k, 0.8% for AGIs $25k-50k, 0.9% for AGIs $50k-75k, 0.9% for AGIs $75k-100k, 2.3% for AGIs $100k-200k)
Net capital gain/loss in AGI: +$3,046 (reported on 16.5% of returns)
Here:
+$3,046
State:
+$31,437
(% of AGI for various income ranges: 0.6% for AGIs $75k-100k, 2.4% for AGIs $100k-200k)
Profit/loss from business: +$17,693 (reported on 19.0% of returns)
Here:
+$17,693
State:
+$20,662
(% of AGI for various income ranges: 7.5% for AGIs below $25k, 6.2% for AGIs $25k-50k, 6.0% for AGIs $50k-75k, 4.0% for AGIs $75k-100k, 7.5% for AGIs $100k-200k)
Taxable individual retirement arrangement distribution: $9,911 (reported on 11.4% of returns)
01354:
$9,911
Massachusetts:
$18,892
(% of AGI for various income ranges: 5.0% for AGIs below $25k, 3.2% for AGIs $25k-50k, 6.6% for AGIs $75k-100k)
Total itemized deductions: $18,888 (22% of AGI, reported on 31.6% of returns)
Here:
$18,888
State:
$28,907
Here:
21.7% of AGI
State:
18.2% of AGI
(% of AGI for various income ranges: 9.9% for AGIs below $25k, 7.5% for AGIs $25k-50k, 12.8% for AGIs $50k-75k, 10.2% for AGIs $75k-100k, 13.0% for AGIs $100k-200k)
Charity contributions: $2,461 (reported on 22.8% of returns)
Here:
$2,461
State:
$4,208
(% of AGI for various income ranges: 0.4% for AGIs $25k-50k, 1.1% for AGIs $50k-75k, 0.9% for AGIs $75k-100k, 1.6% for AGIs $100k-200k)
Taxes paid: $7,744 (reported on 31.6% of returns)
01354:
$7,744
State:
$13,303
(% of AGI for various income ranges: 2.2% for AGIs below $25k, 2.3% for AGIs $25k-50k, 4.4% for AGIs $50k-75k, 4.8% for AGIs $75k-100k, 6.3% for AGIs $100k-200k)
Earned income credit: $1,433 (reported on 11.4% of returns)
Here:
$1,433
State:
$1,971
(% of AGI for various income ranges: 2.6% for AGIs below $25k, 0.6% for AGIs $25k-50k)
Percentage of individuals using paid preparers for their 2012 taxes: 58.2%
Here:
58%
State:
56%
(% for various income ranges: 48.0% for AGIs below $25k, 55.0% for AGIs $25k-50k, 64.3% for AGIs $50k-75k, 66.7% for AGIs $75k-100k, 72.7% for AGIs $100k-200k)
Averages for the 2004 tax year for zip code 01354, filed in 2005:
Average Adjusted Gross Income (AGI) in 2004: $42,969 (Individual Income Tax Returns)
Here:
$42,969
State:
$62,877
Salary/wage: $39,064 (reported on 88.8% of returns)
Here:
$39,064
State:
$52,969
(% of AGI for various income ranges: 127.6% for AGIs below $10k, 73.0% for AGIs $10k-25k, 85.4% for AGIs $25k-50k, 79.9% for AGIs $50k-75k, 85.2% for AGIs $75k-100k, 71.3% for AGIs over 100k)
Taxable interest for individuals: $795 (reported on 57.7% of returns)
This zip code:
$795
Massachusetts:
$1,945
(% of AGI for various income ranges: 9.4% for AGIs below $10k, 2.9% for AGIs $10k-25k, 1.0% for AGIs $25k-50k, 0.5% for AGIs $50k-75k, 0.5% for AGIs $75k-100k, 1.0% for AGIs over 100k)
Taxable dividends: $1,593 (reported on 23.2% of returns)
Here:
$1,593
State:
$5,323
(% of AGI for various income ranges: 4.4% for AGIs below $10k, 0.7% for AGIs $10k-25k, 1.0% for AGIs $25k-50k, 0.5% for AGIs $50k-75k, 1.1% for AGIs $75k-100k, 0.7% for AGIs over 100k)
Net capital gain/loss: +$917 (reported on 16.5% of returns)
Here:
+$917
State:
+$20,377
(% of AGI for various income ranges: -5.3% for AGIs below $10k, -0.5% for AGIs $10k-25k, 0.5% for AGIs $25k-50k, -0.2% for AGIs $50k-75k, 1.8% for AGIs $75k-100k, 0.0% for AGIs over 100k)
Profit/loss from business: +$18,481 (reported on 15.9% of returns)
Here:
+$18,481
State:
+$17,837
(% of AGI for various income ranges: 6.2% for AGIs $10k-25k, 4.0% for AGIs $25k-50k, 6.7% for AGIs $50k-75k, 0.2% for AGIs $75k-100k, 18.2% for AGIs over 100k)
IRA payment deduction: $2,833 (reported on 2.4% of returns)
01354:
$2,833
Massachusetts:
$3,100
Total itemized deductions: $14,886 (21% of AGI, reported on 39.8% of returns)
Here:
$14,886
State:
$22,573
Here:
20.9% of AGI
State:
19.5% of AGI
(% of AGI for various income ranges: 9.6% for AGIs $10k-25k, 11.2% for AGIs $25k-50k, 16.2% for AGIs $50k-75k, 16.1% for AGIs $75k-100k, 13.8% for AGIs over 100k)
Charity contributions deductions: $1,271 (2% of AGI, reported on 34.8% of returns)
Here:
$1,271
State:
$3,295
Here:
1.7% of AGI
State:
2.7% of AGI
(% of AGI for various income ranges: 0.9% for AGIs $25k-50k, 1.2% for AGIs $50k-75k, 0.9% for AGIs $75k-100k, 1.6% for AGIs over 100k)
Total tax: $5,465 (reported on 82.1% of returns)
01354:
$5,465
State:
$11,494
(% of AGI for various income ranges: 3.5% for AGIs below $10k, 5.4% for AGIs $10k-25k, 8.1% for AGIs $25k-50k, 9.0% for AGIs $50k-75k, 10.1% for AGIs $75k-100k, 17.6% for AGIs over 100k)
Earned income credit: $1,356 (reported on 8.9% of returns)
Here:
$1,356
State:
$1,518
Percentage of individuals using paid preparers for their 2004 taxes: 62.8%
Here:
63%
State:
58%
(% for various income ranges: 56.0% for AGIs below $10k, 54.3% for AGIs $10k-25k, 60.3% for AGIs $25k-50k, 69.4% for AGIs $50k-75k, 74.6% for AGIs $75k-100k, 81.8% for AGIs over 100k)
Likely homosexual households (counted as self-reported same-sex unmarried-partner households)
Lesbian couples: 0.0% of all households
Gay men: 0.5% of all households
Household received Food Stamps/SNAP in the past 12 months: 62 Household did not receive Food Stamps/SNAP in the past 12 months: 571
Women who had a birth in the past 12 months: 8 (9 now married, 0 unmarried) Women who did not have a birth in the past 12 months: 300 (137 now married, 161 unmarried)
Housing units in zip code 01354 with a mortgage: 308 (59 second mortgage, 50 both second mortgage and home equity loan) Houses without a mortgage: 25
Median monthly owner costs for units with a mortgage: $1,808 Median monthly owner costs for units without a mortgage: $717
Residents with income below the poverty level in 2022:
This zip code:
9.6%
Whole state:
10.4%
Residents with income below 50% of the poverty level in 2022:
This zip code:
4.2%
Whole state:
5.1%
Median number of rooms in houses and condos:
Here:
6.7
State:
6.5
Median number of rooms in apartments:
Here:
4.2
State:
4.0
Notable locations in this zip code not listed on our city pages
Streams, rivers, and creeks: Ashuela Brook (A), Bennett Brook (B), Dry Brook (C), Otter Run (D), Otter Brook (E), Fall Brook (F). Display/hide their locations on the map
In group quarters: 250 (-1 institutionalized population)
Size of family households: 168 2-persons, 98 3-persons, 109 4-persons, 25 5-persons, 3 6-persons
Size of nonfamily households: 200 1-person, 32 2-persons
177 married couples with children.
45 single-parent households (18 men, 27 women).
92.9% of residents of 01354 zip code speak English at home.
0.2% of residents speak Spanish at home (100% very well).
0.9% of residents speak other Indo-European language at home (100% very well).
5.3% of residents speak Asian or Pacific Island language at home (81% very well, 18% well, 1% not well).
0.2% of residents speak other language at home (100% very well).
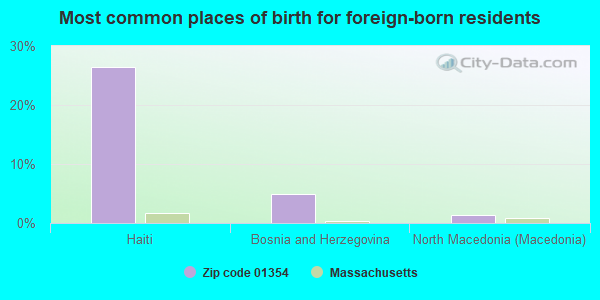
Foreign born population: 139 (8.0%) (8.2% of them are naturalized citizens)
This zip code:
8.0%
Whole state:
18.0%
26%Haiti
5%Bosnia and Herzegovina
1%North Macedonia (Macedonia)
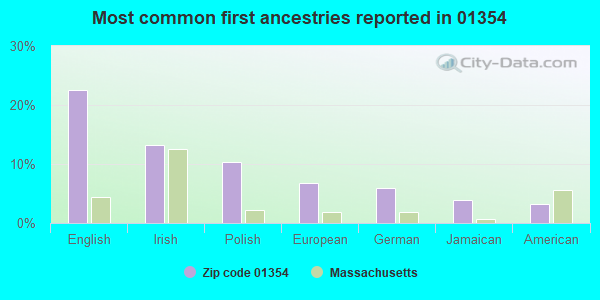
23%English
13%Irish
10%Polish
7%European
6%German
4%Jamaican
3%American
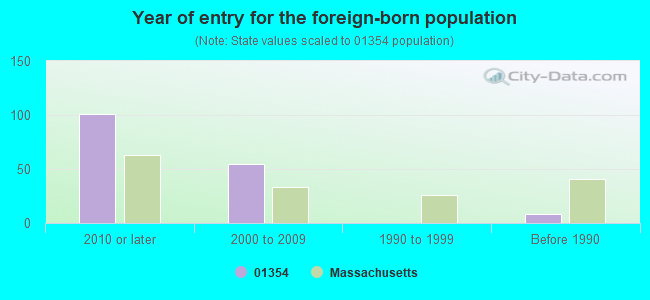
Year of entry for the foreign-born population
1012010 or later
552000 to 2009
01990 to 1999
8Before 1990
Facilities with environmental interests located in this zip code:
NORTHFIELD MOUNT HERMON SCHOOL (28 MOUNT HERMON ROAD in GILL, MA)
AIR SYNTHETIC MINOR (AIRS/AFS) STATE MASTER (MA-EPICS) - NEI-0420550, AIR PROGRAM, RCRAINFO-MAV000007894, HAZARDOUS WASTE PROGRAM STATE MASTER (MA-EPICS) - RCRAINFO-MAV000007894, HAZARDOUS WASTE PROGRAM, RCRAINFO-MAV000018531, NEI-0420551, AIR PROGRAM, NEI-, COMPLIANCE ACTIVITY (Tracking inspections of insecticide, fungicide, and rodenticide, and toxic substances) (National Center for Education Statistics) CRITERIA AND HAZARDOUS AIR POLLUTANT INVENTORY (Inventory of air pollution sources) COMMUNITY WATER SYSTEM (SDWIS) - SDWIS-MA1106002 1T, WATER TREATMENT PLANT, SDWIS-MA1106002 5, Business SIC classification: ELEMENTARY AND SECONDARY SCHOOLS Organizations: NORTHFIELD MT HERMON (CONTACT/REGULATORY)
Alternative names: GILL CAMPUS, MT HERMON SCHOOL, NORTHFIELD CAMPUS, NORTHFIELD MT HERMON, NORTHFIELD MT HERMON SCHOOL
Housing units lacking complete plumbing facilities: 0.7% Housing units lacking complete kitchen facilities: 0.7%
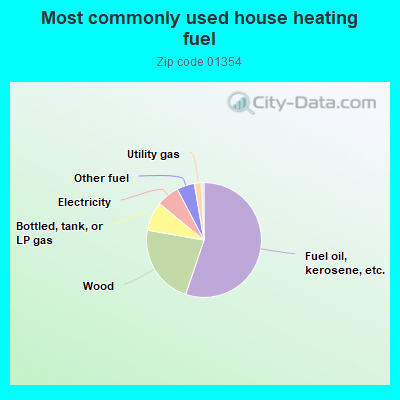
55.3%Fuel oil, kerosene, etc.
22.6%Wood
8.2%Bottled, tank, or LP gas
6.4%Electricity
5.0%Other fuel
2.1%Utility gas
0.6%Coal or coke
Place of birth for U.S.-born residents:
This state: 1,019
Northeast: 412
Midwest: 7
South: 61
West: 83
93% of the 01354 zip code residents lived in the same house 1 year ago. Out of people who lived in different houses, 81% moved from this county. Out of people who lived in different houses, 10% moved from different county within same state. Out of people who lived in different houses, 1% moved from different state.
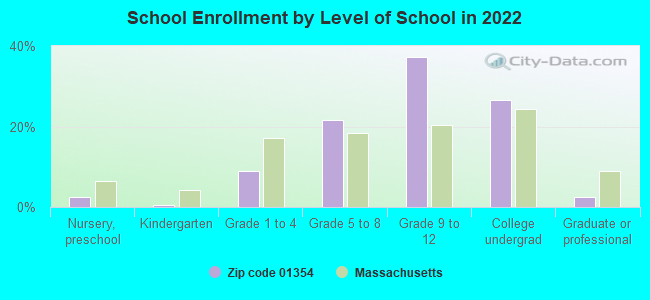
Private vs. public school enrollment:
Students in private schools in grades 1 to 8 (elementary and middle school):
Here:
0.8%
Massachusetts:
10.3%
Students in private schools in grades 9 to 12 (high school): 75
Here:
50.8%
Massachusetts:
12.3%
Students in private undergraduate colleges: 17
Here:
16.8%
Massachusetts:
51.2%
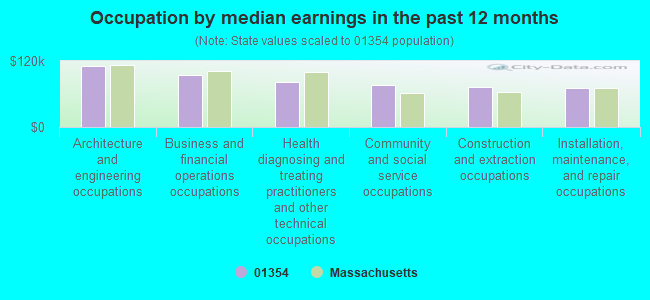
Occupation by median earnings in the past 12 months ($)
111,122Architecture and engineering occupations
94,964Business and financial operations occupations
82,472Health diagnosing and treating practitioners and other technical occupations
77,026Community and social service occupations
71,975Construction and extraction occupations
71,278Installation, maintenance, and repair occupations
Top industries in this zip code by the number of employees in 2005:
Construction: New Single-Family Housing Construction (except Operative Builders) (1-4: 2)
Real Estate and Rental and Leasing: Nonresidential Property Managers (1-4: 1)
Construction: Masonry Contractors (1-4: 1)
Accommodation and Food Services: Limited-Service Restaurants (1-4: 1)
Fatal accident statistics in 2013:
Fatal accident count: 1
Vehicles involved in fatal accidents: 3
Fatal accidents caused by drunken drivers: 0
Fatalities: 1
Persons involved in fatal accidents: 10
Pedestrians involved in fatal accidents: 0
Fatal accident statistics in 2012:
Fatal accident count: 1
Vehicles involved in fatal accidents: 1
Fatal accidents caused by drunken drivers: 0
Fatalities: 1
Persons involved in fatal accidents: 1
Pedestrians involved in fatal accidents: 0
2004 - 2018 National Fire Incident Reporting System (NFIRS) incidents
Based on the data from the years 2004 - 2018 the average number of fires per year is 12. The highest number of fires - 16 took place in 2005, and the least - 1 in 2004. The data has a growing trend.
When looking into fire subcategories, the most incidents belonged to: Structure Fires (40.7%), and Outside Fires (39.6%).
Fire incident types reported to NFIRS in Zip Code 01354


 Based on the data from the years 2004 - 2018 the average number of fires per year is 12. The highest number of fires - 16 took place in 2005, and the least - 1 in 2004. The data has a growing trend.
 When looking into fire subcategories, the most incidents belonged to: Structure Fires (40.7%), and Outside Fires (39.6%).