Estimated zip code population in 2022: 4,866 Zip code population in 2010: 5,247 Zip code population in 2000: 6,488
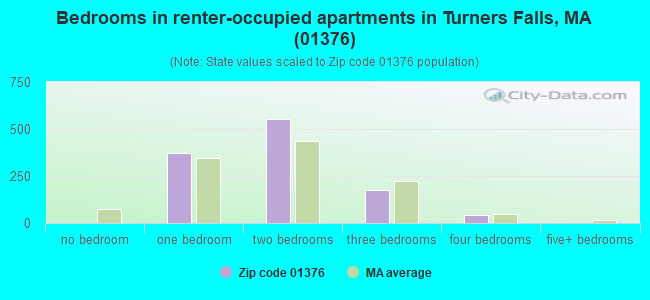
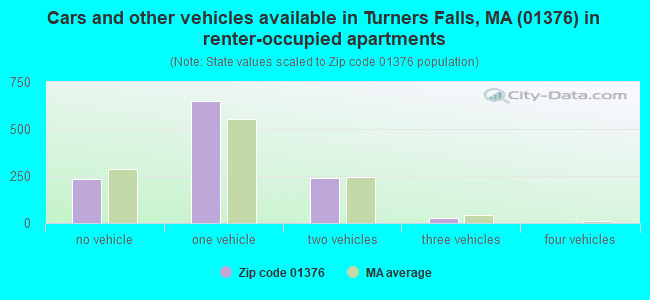
Houses and condos: 2,530 Renter-occupied apartments: 1,144
% of renters here:
49%
State:
38%
March 2022 cost of living index in zip code 01376: 107.8 (more than average, U.S. average is 100)
Land area: 2.8 sq. mi. Water area: 0.6 sq. mi.
Population density: 1,763 people per square mile
(low).
OSM Map
Google Map
MSN Map
OSM Map
General Map
Google Map
MSN Map
OSM Map
Google Map
MSN Map
OSM Map
Google Map
MSN Map
Please wait while loading the map...
Real estate property taxes paid for housing units in 2022:
This zip code:
1.5% ($3,770)
Massachusetts:
1.0% ($5,536)
Median real estate property taxes paid for housing units with mortgages in 2022: $3,835 (1.5%) Median real estate property taxes paid for housing units with no mortgage in 2022: $3,707 (1.5%)
Averages for the 2020 tax year for zip code 01376, filed in 2021:
Average Adjusted Gross Income (AGI) in 2020: $47,951 (Individual Income Tax Returns)
Here:
$47,951
State:
$105,130
Salary/wage: $42,144 (reported on 80.8% of returns)
Here:
$42,144
State:
$82,951
(% of AGI for various income ranges: 1211.8% for AGIs below $25k, 3504.4% for AGIs $25k-50k, 5966.1% for AGIs $50k-75k, 9188.2% for AGIs $75k-100k, 15572.9% for AGIs $100k-200k)
Taxable interest for individuals: $778 (reported on 28.8% of returns)
This zip code:
$778
Massachusetts:
$2,361
(% of AGI for various income ranges: 20.8% for AGIs below $25k, 11.2% for AGIs $25k-50k, 42.4% for AGIs $50k-75k, 58.8% for AGIs $75k-100k, 102.9% for AGIs $100k-200k)
Ordinary dividends: $2,424 (reported on 15.1% of returns)
Here:
$2,424
State:
$10,365
(% of AGI for various income ranges: 15.8% for AGIs below $25k, 23.9% for AGIs $25k-50k, 46.4% for AGIs $50k-75k, 60.0% for AGIs $75k-100k, 235.7% for AGIs $100k-200k)
Net capital gain/loss in AGI: +$6,197 (reported on 10.7% of returns)
Here:
+$6,197
State:
+$48,178
(% of AGI for various income ranges: 7.5% for AGIs below $25k, 28.4% for AGIs $25k-50k, 63.9% for AGIs $50k-75k, 44.1% for AGIs $75k-100k, 917.1% for AGIs $100k-200k)
Profit/loss from business: +$9,438 (reported on 11.8% of returns)
Here:
+$9,438
State:
+$20,792
(% of AGI for various income ranges: 96.5% for AGIs below $25k, 76.1% for AGIs $25k-50k, 218.5% for AGIs $50k-75k, 221.8% for AGIs $75k-100k, 611.4% for AGIs $100k-200k)
Taxable individual retirement arrangement distribution: $13,438 (reported on 8.9% of returns)
01376:
$13,438
Massachusetts:
$22,790
(% of AGI for various income ranges: 80.8% for AGIs below $25k, 59.7% for AGIs $25k-50k, 147.6% for AGIs $50k-75k, 390.0% for AGIs $75k-100k, 862.9% for AGIs $100k-200k)
Total itemized deductions: $20,562 (reported on 3.0% of returns)
Here:
$20,562
State:
$36,722
(% of AGI for various income ranges: 64.3% for AGIs below $25k, 191.5% for AGIs $50k-75k, 447.9% for AGIs $100k-200k)
Charity contributions: $2,175 (reported on 1.5% of returns)
Here:
$2,175
State:
$12,529
(% of AGI for various income ranges: 26.4% for AGIs $50k-75k)
Taxes paid: $7,075 (reported on 3.0% of returns)
01376:
$7,075
State:
$8,782
(% of AGI for various income ranges: 18.5% for AGIs below $25k, 74.2% for AGIs $50k-75k, 150.0% for AGIs $100k-200k)
Earned income credit: $1,863 (reported on 15.1% of returns)
Here:
$1,863
State:
$1,909
(% of AGI for various income ranges: 76.7% for AGIs below $25k, 47.5% for AGIs $25k-50k)
Percentage of individuals using paid preparers for their 2020 taxes: 90.8%
Here:
91%
State:
92%
(% for various income ranges: 89.0% for AGIs below $25k, 90.5% for AGIs $25k-50k, 93.3% for AGIs $50k-75k, 92.0% for AGIs $75k-100k, 91.3% for AGIs $100k-200k, 100.0% for AGIs over 200k)
Averages for the 2012 tax year for zip code 01376, filed in 2013:
Average Adjusted Gross Income (AGI) in 2012: $37,632 (Individual Income Tax Returns)
Here:
$37,632
State:
$81,425
Salary/wage: $34,539 (reported on 83.1% of returns)
Here:
$34,539
State:
$64,752
(% of AGI for various income ranges: 74.1% for AGIs below $25k, 78.6% for AGIs $25k-50k, 76.3% for AGIs $50k-75k, 78.6% for AGIs $75k-100k, 72.2% for AGIs $100k-200k)
Taxable interest for individuals: $776 (reported on 35.4% of returns)
This zip code:
$776
Massachusetts:
$2,136
(% of AGI for various income ranges: 1.4% for AGIs below $25k, 0.6% for AGIs $25k-50k, 0.7% for AGIs $50k-75k, 0.9% for AGIs $75k-100k, 0.3% for AGIs $100k-200k)
Ordinary dividends: $1,656 (reported on 15.4% of returns)
Here:
$1,656
State:
$9,473
(% of AGI for various income ranges: 1.0% for AGIs below $25k, 0.5% for AGIs $25k-50k, 0.8% for AGIs $50k-75k, 0.6% for AGIs $75k-100k, 0.6% for AGIs $100k-200k)
Net capital gain/loss in AGI: +$2,136 (reported on 9.8% of returns)
Here:
+$2,136
State:
+$31,437
(% of AGI for various income ranges: 0.4% for AGIs $25k-50k, 0.5% for AGIs $50k-75k, 0.4% for AGIs $75k-100k, 1.4% for AGIs $100k-200k)
Profit/loss from business: +$11,236 (reported on 11.0% of returns)
Here:
+$11,236
State:
+$20,662
(% of AGI for various income ranges: 5.6% for AGIs below $25k, 2.4% for AGIs $25k-50k, 1.3% for AGIs $50k-75k, 1.5% for AGIs $75k-100k, 6.9% for AGIs $100k-200k)
Taxable individual retirement arrangement distribution: $7,968 (reported on 9.8% of returns)
01376:
$7,968
Massachusetts:
$18,892
(% of AGI for various income ranges: 3.0% for AGIs below $25k, 2.2% for AGIs $25k-50k, 2.0% for AGIs $50k-75k, 3.5% for AGIs $75k-100k)
Total itemized deductions: $14,815 (22% of AGI, reported on 24.4% of returns)
Here:
$14,815
State:
$28,907
Here:
22.4% of AGI
State:
18.2% of AGI
(% of AGI for various income ranges: 7.9% for AGIs below $25k, 7.2% for AGIs $25k-50k, 11.8% for AGIs $50k-75k, 10.9% for AGIs $75k-100k, 11.1% for AGIs $100k-200k)
Charity contributions: $1,434 (reported on 16.1% of returns)
Here:
$1,434
State:
$4,208
(% of AGI for various income ranges: 0.6% for AGIs below $25k, 0.4% for AGIs $25k-50k, 0.7% for AGIs $50k-75k, 0.6% for AGIs $75k-100k, 0.9% for AGIs $100k-200k)
Taxes paid: $6,592 (reported on 24.0% of returns)
01376:
$6,592
State:
$13,303
(% of AGI for various income ranges: 2.1% for AGIs below $25k, 2.6% for AGIs $25k-50k, 5.1% for AGIs $50k-75k, 5.1% for AGIs $75k-100k, 6.6% for AGIs $100k-200k)
Earned income credit: $1,710 (reported on 19.3% of returns)
Here:
$1,710
State:
$1,971
(% of AGI for various income ranges: 4.4% for AGIs below $25k, 0.8% for AGIs $25k-50k)
Percentage of individuals using paid preparers for their 2012 taxes: 50.4%
Here:
50%
State:
56%
(% for various income ranges: 43.8% for AGIs below $25k, 51.9% for AGIs $25k-50k, 61.8% for AGIs $50k-75k, 55.6% for AGIs $75k-100k, 61.5% for AGIs $100k-200k)
Averages for the 2004 tax year for zip code 01376, filed in 2005:
Average Adjusted Gross Income (AGI) in 2004: $35,182 (Individual Income Tax Returns)
Here:
$35,182
State:
$62,877
Salary/wage: $31,830 (reported on 84.8% of returns)
Here:
$31,830
State:
$52,969
(% of AGI for various income ranges: 79.0% for AGIs below $10k, 74.0% for AGIs $10k-25k, 81.3% for AGIs $25k-50k, 80.3% for AGIs $50k-75k, 82.6% for AGIs $75k-100k, 58.4% for AGIs over 100k)
Taxable interest for individuals: $960 (reported on 47.8% of returns)
This zip code:
$960
Massachusetts:
$1,945
(% of AGI for various income ranges: 3.5% for AGIs below $10k, 2.8% for AGIs $10k-25k, 1.2% for AGIs $25k-50k, 0.8% for AGIs $50k-75k, 1.1% for AGIs $75k-100k, 0.8% for AGIs over 100k)
Taxable dividends: $1,355 (reported on 19.8% of returns)
Here:
$1,355
State:
$5,323
(% of AGI for various income ranges: 1.7% for AGIs below $10k, 1.0% for AGIs $10k-25k, 0.6% for AGIs $25k-50k, 0.7% for AGIs $50k-75k, 0.7% for AGIs $75k-100k, 1.0% for AGIs over 100k)
Net capital gain/loss: +$4,932 (reported on 12.7% of returns)
Here:
+$4,932
State:
+$20,377
(% of AGI for various income ranges: -0.5% for AGIs below $10k, -0.2% for AGIs $10k-25k, 0.5% for AGIs $25k-50k, 0.9% for AGIs $50k-75k, 1.9% for AGIs $75k-100k, 8.0% for AGIs over 100k)
Profit/loss from business: +$12,592 (reported on 11.7% of returns)
Here:
+$12,592
State:
+$17,837
(% of AGI for various income ranges: 8.0% for AGIs below $10k, 3.7% for AGIs $10k-25k, 3.5% for AGIs $25k-50k, 2.7% for AGIs $50k-75k, 2.4% for AGIs $75k-100k, 9.5% for AGIs over 100k)
IRA payment deduction: $2,864 (reported on 3.1% of returns)
01376:
$2,864
Massachusetts:
$3,100
(% of AGI for various income ranges: 0.3% for AGIs $10k-25k, 0.3% for AGIs $25k-50k, 0.3% for AGIs $50k-75k, 0.4% for AGIs $75k-100k)
Self-employed pension: $13,188 (reported on 0.6% of returns)
Here:
$13,188
Massachusetts:
$14,516
Total itemized deductions: $13,254 (21% of AGI, reported on 26.0% of returns)
Here:
$13,254
State:
$22,573
Here:
20.9% of AGI
State:
19.5% of AGI
(% of AGI for various income ranges: 5.8% for AGIs below $10k, 5.5% for AGIs $10k-25k, 8.3% for AGIs $25k-50k, 11.6% for AGIs $50k-75k, 11.5% for AGIs $75k-100k, 12.7% for AGIs over 100k)
Charity contributions deductions: $1,287 (2% of AGI, reported on 22.1% of returns)
Here:
$1,287
State:
$3,295
Here:
1.9% of AGI
State:
2.7% of AGI
(% of AGI for various income ranges: 0.4% for AGIs $10k-25k, 0.6% for AGIs $25k-50k, 1.0% for AGIs $50k-75k, 1.0% for AGIs $75k-100k, 1.2% for AGIs over 100k)
Total tax: $4,346 (reported on 76.7% of returns)
01376:
$4,346
State:
$11,494
(% of AGI for various income ranges: 2.1% for AGIs below $10k, 4.4% for AGIs $10k-25k, 7.7% for AGIs $25k-50k, 9.3% for AGIs $50k-75k, 10.9% for AGIs $75k-100k, 17.6% for AGIs over 100k)
Earned income credit: $1,511 (reported on 15.1% of returns)
Here:
$1,511
State:
$1,518
Percentage of individuals using paid preparers for their 2004 taxes: 53.5%
Here:
54%
State:
58%
(% for various income ranges: 44.8% for AGIs below $10k, 52.6% for AGIs $10k-25k, 54.9% for AGIs $25k-50k, 61.2% for AGIs $50k-75k, 49.4% for AGIs $75k-100k, 72.4% for AGIs over 100k)
Likely homosexual households (counted as self-reported same-sex unmarried-partner households)
Lesbian couples: 0.3% of all households
Gay men: 0.0% of all households
Household received Food Stamps/SNAP in the past 12 months: 615 Household did not receive Food Stamps/SNAP in the past 12 months: 1,768
Women who had a birth in the past 12 months: 41 (17 now married, 21 unmarried) Women who did not have a birth in the past 12 months: 923 (339 now married, 584 unmarried)
Housing units in zip code 01376 with a mortgage: 706 (159 second mortgage, 9 home equity loan, 117 both second mortgage and home equity loan) Houses without a mortgage: 10
Median monthly owner costs for units with a mortgage: $1,575 Median monthly owner costs for units without a mortgage: $637
Residents with income below the poverty level in 2022:
This zip code:
9.0%
Whole state:
10.4%
Residents with income below 50% of the poverty level in 2022:
This zip code:
6.7%
Whole state:
5.1%
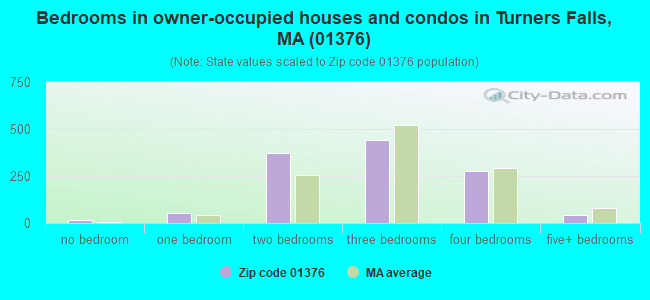
Median number of rooms in houses and condos:
Here:
6.0
State:
6.5
Median number of rooms in apartments:
Here:
4.3
State:
4.0
Notable locations in this zip code not listed on our city pages
Lakes and reservoirs: Deep Hole (A), Montague Power Canal Reservoir (B), Power Canal Reservoir (C), Connecticut River Reservoir (D). Display/hide their locations on the map
In group quarters: 138 (-1 institutionalized population)
Size of family households: 694 2-persons, 283 3-persons, 215 4-persons, 58 5-persons, 13 6-persons
Size of nonfamily households: 955 1-person, 126 2-persons
420 married couples with children.
311 single-parent households (118 men, 193 women).
92.3% of residents of 01376 zip code speak English at home.
5.5% of residents speak Spanish at home (56% very well, 9% well, 22% not well, 13% not at all).
1.9% of residents speak other Indo-European language at home (69% very well, 12% well, 19% not well).
0.1% of residents speak Asian or Pacific Island language at home (100% well).
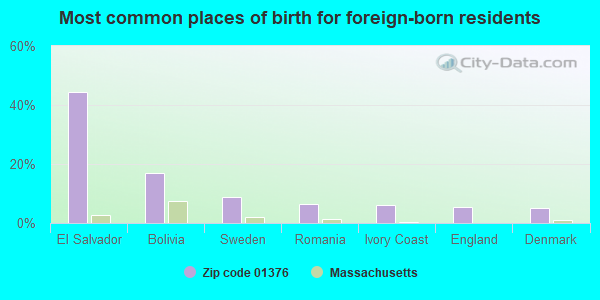
Foreign born population: 181 (3.7%) (26.2% of them are naturalized citizens)
This zip code:
3.7%
Whole state:
18.0%
45%El Salvador
17%Bolivia
9%Sweden
7%Romania
6%Ivory Coast
5%England
5%Denmark
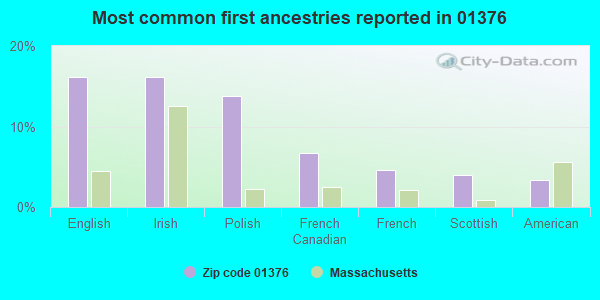
16%English
16%Irish
14%Polish
7%French Canadian
5%French
4%Scottish
3%American
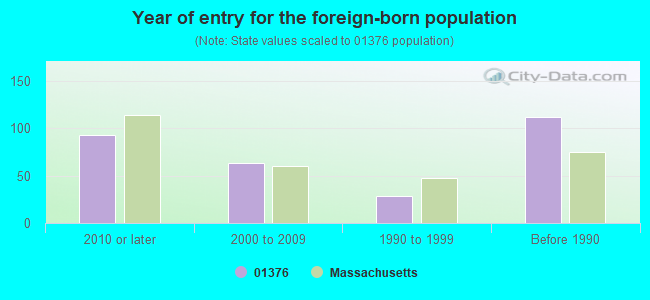
Year of entry for the foreign-born population
932010 or later
632000 to 2009
291990 to 1999
112Before 1990
Facilities with environmental interests located in this zip code:
MONTAGUE MACHINE COMPANY (15TH STREET in MONTAGUE (TURNERS FALLS), MA)
AIR MINOR (AIRS/AFS) STATE MASTER (MA-EPICS) - NEI-0420518, AIR PROGRAM CRITERIA AND HAZARDOUS AIR POLLUTANT INVENTORY (Inventory of air pollution sources) TRI REPORTER (Tracking of toxic chemicals releasing facilities) Business SIC classification: GRAY AND DUCTILE IRON FOUNDRIES; PAPER INDUSTRIES MACHINERY
AIR MINOR (AIRS/AFS) CRITERIA AND HAZARDOUS AIR POLLUTANT INVENTORY (Inventory of air pollution sources) Small Quantity Generators, between 100 kg and 1000 kg of hazardous waste/month (Resource Conservation and Recovery Act (tracking hazardous waste)) - notification TRI REPORTER (Tracking of toxic chemicals releasing facilities) Business SIC classification: DRAWING AND INSULATING OF NONFERROUS WIRE Alternative names: JUDD WIRE DIV, JUDD WIRE INC.
National Pollutant Discharge Elimination System NON-MAJOR (Tracking pollutant discharge elimination systems) - permit Business SIC classification: FISH HATCHERIES AND PRESERVES Alternative names: AQUA PARTNERS TECHNOLOGIES, LL, AQUA PARTNERS TECHNOLOGIES,LLC, AUSTRALIS AWUACULTURE, LLC, MASS FIN TECH LLC
CAMERON RACING SERVICES (FRANKLIN RD in GILL, MA)
(Resource Conservation and Recovery Act (tracking hazardous waste)) Organizations: KEVIN A CAMERON (CONTACT/OWNER)
NORTHFIELD MOUNT HERMON SCHOOL WASTEWATER TREATMENT PLANT (206 MAIN ROAD in GILL, MA)
National Pollutant Discharge Elimination System NON-MAJOR (Tracking pollutant discharge elimination systems) - permit Business SIC classification: SEWERAGE SYSTEMS Organizations: NORTHFIELD NOUNT HERMON SCHOOL (CONTACT/OPERATOR)
Alternative names: NORTHFIELD MT HERMON SCHOOL
ESCOTTS SERVICE STATION (4 AVENUE A in MONTAGUE, MA)
(Resource Conservation and Recovery Act (tracking hazardous waste)) Organizations: ROBERT JAMES ESCOTT (CONTACT/OWNER)
MOHAWK PLASTICS INC (INDUSTRIAL BLVD in TURNERS FALLS, MA)
AIR MINOR (AIRS/AFS)
MONTAGUE (1 AVE A,TURNERS FALL in MONTAGUE, MA)
AIR MINOR (AIRS/AFS) Business SIC classification: GENERAL GOVERNMENT
MONTAGUE SANITARY LANDFILL (TURNPIKE RD in MONTAGUE CITY, MA)
CRITERIA AND HAZARDOUS AIR POLLUTANT INVENTORY (Inventory of air pollution sources) Conditionally Exempt Small Quantity Generators, less than 100 kg/month of hazardous waste (Resource Conservation and Recovery Act (tracking hazardous waste)) - notification Business SIC classification: REFUSE SYSTEMS Business NAICS classification: SOLID WASTE LANDFILL. Organizations: TOWN OF MONTAGUE (CONTACT/OWNER)
COMET CLEANERS & FORMAL WEAR (123 AVENUE A in MONTAGUE, MA)
Conditionally Exempt Small Quantity Generators, less than 100 kg/month of hazardous waste (Resource Conservation and Recovery Act (tracking hazardous waste)) - notification
DUBOIS PROPERTY SITE (2 THIRD STREET in MONTAGUE (TURNER'S FALLS), MA)
SUPERFUND (Superfund database)
Housing units lacking complete plumbing facilities: 0.5% Housing units lacking complete kitchen facilities: 2.9%
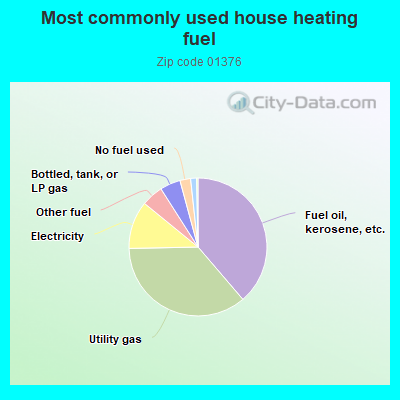
38.7%Fuel oil, kerosene, etc.
35.9%Utility gas
11.2%Electricity
5.1%Other fuel
4.8%Bottled, tank, or LP gas
2.5%No fuel used
1.4%Wood
Population in 1990: 7,100.
Place of birth for U.S.-born residents:
This state: 3,600
Northeast: 520
Midwest: 106
South: 241
West: 73
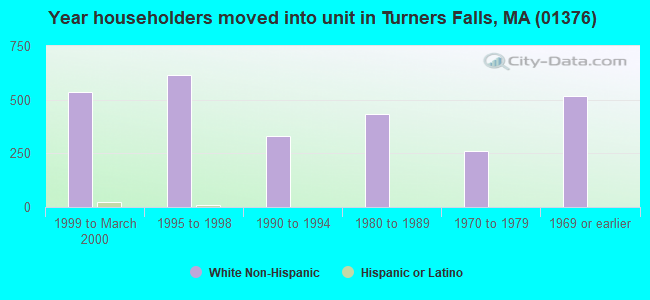
60% of the 01376 zip code residents lived in the same house 5 years ago. Out of people who lived in different houses, 74% lived in this county. Out of people who lived in different counties, 50% lived in Massachusetts.
95% of the 01376 zip code residents lived in the same house 1 year ago. Out of people who lived in different houses, 72% moved from this county. Out of people who lived in different houses, 16% moved from different county within same state. Out of people who lived in different houses, 7% moved from different state.
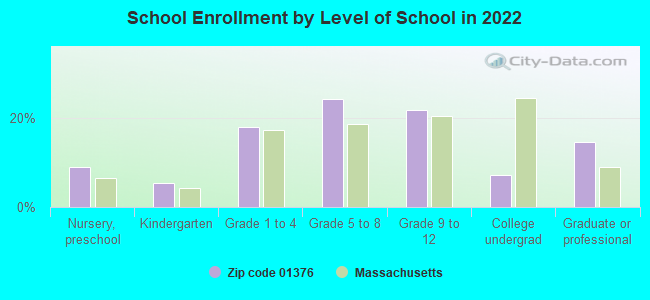
Private vs. public school enrollment:
Students in private schools in grades 1 to 8 (elementary and middle school):
Here:
0.0%
Massachusetts:
10.3%
Students in private schools in grades 9 to 12 (high school):
Here:
0.0%
Massachusetts:
12.3%
Students in private undergraduate colleges: 26
Here:
50.7%
Massachusetts:
51.2%
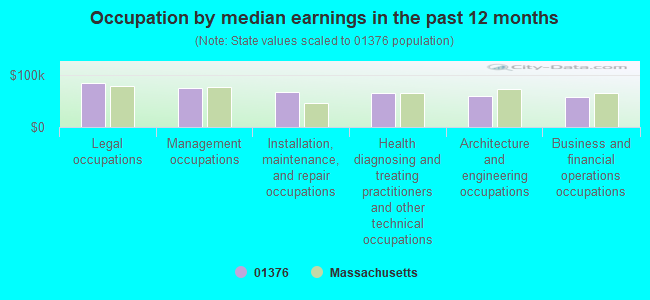
Occupation by median earnings in the past 12 months ($)
85,122Legal occupations
74,545Management occupations
67,337Installation, maintenance, and repair occupations
65,762Health diagnosing and treating practitioners and other technical occupations
59,866Architecture and engineering occupations
57,295Business and financial operations occupations
Companies with federal contracts located in this zip code:
YANKEE ENVIRONMENTAL SYSTEMS, (101 INDUSTRIAL BLVD in TURNERS FALLS, MA; small business) : $3,472,614 in 31 contractsfrom 2000 to 2006
Contracts for Defense Electronics and Communication Equipment -- Basic Research (R&D), Defense Electronics and Communication Equipment -- Applied Research and Exploratory Development (R&D), Other Research and Development -- Applied Research and Exploratory Development (R&D), Other Research and Development -- Basic Research (R&D), and moreby Air Force, Navy, National Oceanic and Atmospheric Administration/Under Secretary for Oceans and Atmosphere, Army, and others Signed by year:2000: $220,000; 2001: $502,994; 2002: $300,000; 2003: $315,971; 2004: $543,747; 2005: $855,381; 2006: $734,521.
Biggest contracts:
$390,379 with Air Force for Defense Electronics and Communication Equipment -- Basic Research (R&D). Signed on 2005-05-10. Completion date: 2007-07-31.
$359,521, same as above.Signed on 2006-03-31. Completion date: 2007-07-31.
$350,000 with Navy for Defense Electronics and Communication Equipment -- Applied Research and Exploratory Development (R&D). Signed on 2005-05-18. Completion date: 2006-05-18.
$300,000 with National Oceanic and Atmospheric Administration/Under Secretary for Oceans and Atmosphere for Other Research and Development -- Applied Research and Exploratory Development (R&D). Signed on 2004-08-18. Completion date: 2006-02-15.
Top industries in this zip code by the number of employees in 2005:
Health Care and Social Assistance: Nursing Care Facilities (100-249 employees: 1 establishment)
Health Care and Social Assistance: All Other Outpatient Care Centers (50-99: 1)
Health Care and Social Assistance: Vocational Rehabilitation Services (20-49: 2)
People in group quarters in 2010:
121 people in nursing facilities/skilled-nursing facilities
20 people in emergency and transitional shelters (with sleeping facilities) for people experiencing homelessness
People in group quarters in 2000:
117 people in nursing homes
23 people in other nonhousehold living situations
3 people in other group homes
2 people in other noninstitutional group quarters
Fatal accident statistics in 2011:
Fatal accident count: 1
Vehicles involved in fatal accidents: 1
Fatal accidents caused by drunken drivers: 0
Fatalities: 1
Persons involved in fatal accidents: 1
Pedestrians involved in fatal accidents: 0
Home Mortgage Disclosure Act Aggregated Statistics For Year 2009 (Based on 4 partial tracts)
A) FHA, FSA/RHS & VA Home Purchase Loans
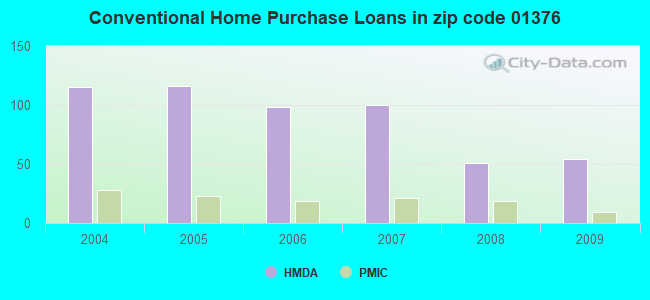
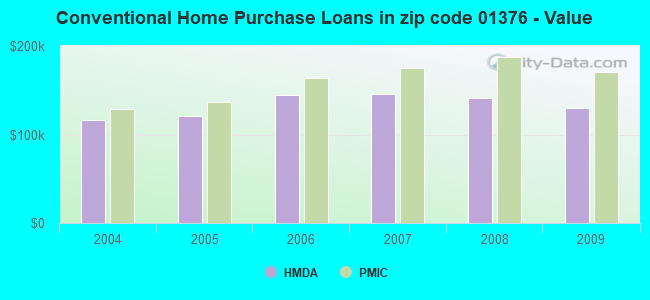
B) Conventional Home Purchase Loans
C) Refinancings
D) Home Improvement Loans
E) Loans on Dwellings For 5+ Families
F) Non-occupant Loans on < 5 Family Dwellings (A B C & D)
Number
Average Value
Number
Average Value
Number
Average Value
Number
Average Value
Number
Average Value
Number
Average Value
LOANS ORIGINATED
15
$169,800
54
$129,849
139
$144,610
33
$65,531
7
$543,556
13
$147,286
APPLICATIONS APPROVED, NOT ACCEPTED
0
$0
8
$138,431
6
$158,147
0
$0
0
$0
0
$0
APPLICATIONS DENIED
2
$174,385
9
$83,784
45
$168,078
2
$112,685
0
$0
2
$84,015
APPLICATIONS WITHDRAWN
0
$0
1
$165,540
28
$141,382
2
$49,950
0
$0
2
$41,185
FILES CLOSED FOR INCOMPLETENESS
2
$102,525
0
$0
13
$181,790
0
$0
0
$0
0
$0
Aggregated Statistics For Year 2008 (Based on 4 partial tracts)
A) FHA, FSA/RHS & VA Home Purchase Loans
B) Conventional Home Purchase Loans
C) Refinancings
D) Home Improvement Loans
E) Loans on Dwellings For 5+ Families
F) Non-occupant Loans on < 5 Family Dwellings (A B C & D)
Number
Average Value
Number
Average Value
Number
Average Value
Number
Average Value
Number
Average Value
Number
Average Value
LOANS ORIGINATED
13
$163,990
51
$141,149
92
$129,586
32
$68,049
0
$0
12
$107,248
APPLICATIONS APPROVED, NOT ACCEPTED
0
$0
7
$162,254
16
$182,179
0
$0
0
$0
5
$154,274
APPLICATIONS DENIED
2
$155,135
8
$130,643
68
$163,968
17
$38,637
0
$0
6
$173,843
APPLICATIONS WITHDRAWN
3
$151,547
4
$83,572
12
$214,567
4
$13,582
2
$178,765
0
$0
FILES CLOSED FOR INCOMPLETENESS
0
$0
1
$182,490
3
$170,860
0
$0
0
$0
0
$0
Aggregated Statistics For Year 2007 (Based on 4 partial tracts)
A) FHA, FSA/RHS & VA Home Purchase Loans
B) Conventional Home Purchase Loans
C) Refinancings
D) Home Improvement Loans
E) Loans on Dwellings For 5+ Families
F) Non-occupant Loans on < 5 Family Dwellings (A B C & D)
G) Loans On Manufactured Home Dwelling (A B C & D)
Number
Average Value
Number
Average Value
Number
Average Value
Number
Average Value
Number
Average Value
Number
Average Value
Number
Average Value
LOANS ORIGINATED
4
$121,368
100
$145,999
106
$145,036
50
$81,003
2
$122,680
16
$120,644
0
$0
APPLICATIONS APPROVED, NOT ACCEPTED
0
$0
5
$156,372
18
$111,504
3
$115,223
4
$206,368
5
$103,086
0
$0
APPLICATIONS DENIED
2
$139,330
22
$144,049
108
$148,892
29
$59,159
4
$100,775
13
$126,559
2
$106,910
APPLICATIONS WITHDRAWN
0
$0
12
$178,650
49
$135,560
1
$80,270
2
$131,445
1
$469,180
0
$0
FILES CLOSED FOR INCOMPLETENESS
0
$0
1
$227,860
7
$156,189
2
$116,355
2
$175,260
2
$153,350
0
$0
Aggregated Statistics For Year 2006 (Based on 4 partial tracts)
A) FHA, FSA/RHS & VA Home Purchase Loans
B) Conventional Home Purchase Loans
C) Refinancings
D) Home Improvement Loans
F) Non-occupant Loans on < 5 Family Dwellings (A B C & D)
Number
Average Value
Number
Average Value
Number
Average Value
Number
Average Value
Number
Average Value
LOANS ORIGINATED
2
$201,670
98
$145,068
120
$138,762
74
$53,737
46
$120,934
APPLICATIONS APPROVED, NOT ACCEPTED
0
$0
12
$178,909
28
$129,378
7
$39,536
8
$151,198
APPLICATIONS DENIED
0
$0
28
$117,658
80
$123,705
32
$63,796
10
$102,779
APPLICATIONS WITHDRAWN
0
$0
14
$150,899
75
$148,303
6
$77,078
6
$128,718
FILES CLOSED FOR INCOMPLETENESS
0
$0
0
$0
20
$144,438
2
$58,095
0
$0
Aggregated Statistics For Year 2005 (Based on 4 partial tracts)
A) FHA, FSA/RHS & VA Home Purchase Loans
B) Conventional Home Purchase Loans
C) Refinancings
D) Home Improvement Loans
E) Loans on Dwellings For 5+ Families
F) Non-occupant Loans on < 5 Family Dwellings (A B C & D)
G) Loans On Manufactured Home Dwelling (A B C & D)
Number
Average Value
Number
Average Value
Number
Average Value
Number
Average Value
Number
Average Value
Number
Average Value
Number
Average Value
LOANS ORIGINATED
9
$172,581
116
$120,423
197
$124,294
60
$83,024
4
$274,282
44
$114,681
0
$0
APPLICATIONS APPROVED, NOT ACCEPTED
0
$0
16
$132,071
19
$116,156
6
$58,552
0
$0
2
$149,465
0
$0
APPLICATIONS DENIED
2
$137,580
19
$101,799
111
$139,095
26
$79,384
0
$0
13
$126,504
2
$65,720
APPLICATIONS WITHDRAWN
0
$0
17
$139,408
114
$138,852
8
$173,665
0
$0
8
$163,991
0
$0
FILES CLOSED FOR INCOMPLETENESS
2
$89,385
4
$154,928
16
$168,661
0
$0
0
$0
0
$0
0
$0
Aggregated Statistics For Year 2004 (Based on 4 partial tracts)
A) FHA, FSA/RHS & VA Home Purchase Loans
B) Conventional Home Purchase Loans
C) Refinancings
D) Home Improvement Loans
E) Loans on Dwellings For 5+ Families
F) Non-occupant Loans on < 5 Family Dwellings (A B C & D)
G) Loans On Manufactured Home Dwelling (A B C & D)
Detailed PMIC statistics for the following Tracts:0402.00
, 0407.01
2002 - 2018 National Fire Incident Reporting System (NFIRS) incidents
Based on the data from the years 2002 - 2018 the average number of fires per year is 46. The highest number of fires - 65 took place in 2006, and the least - 24 in 2017. The data has a dropping trend.
When looking into fire subcategories, the most incidents belonged to: Structure Fires (62.0%), and Outside Fires (24.7%).
Fire incident types reported to NFIRS in Zip Code 01376


 Nearest zip codes: 01347, 01354, 01301, 01351, 01342, 01349.


 Based on the data from the years 2002 - 2018 the average number of fires per year is 46. The highest number of fires - 65 took place in 2006, and the least - 24 in 2017. The data has a dropping trend.
 When looking into fire subcategories, the most incidents belonged to: Structure Fires (62.0%), and Outside Fires (24.7%).