Estimated zip code population in 2022: 8,050 Zip code population in 2010: 7,808 Zip code population in 2000: 7,257
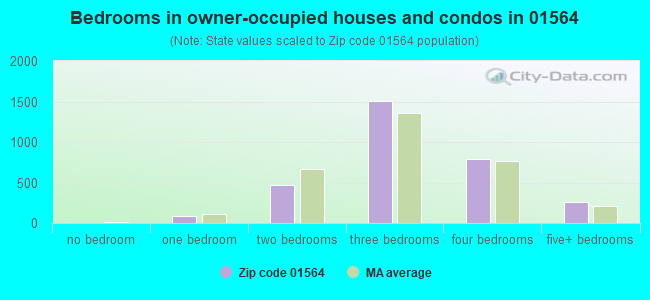
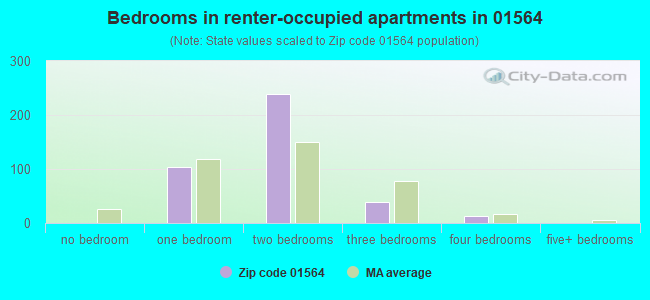
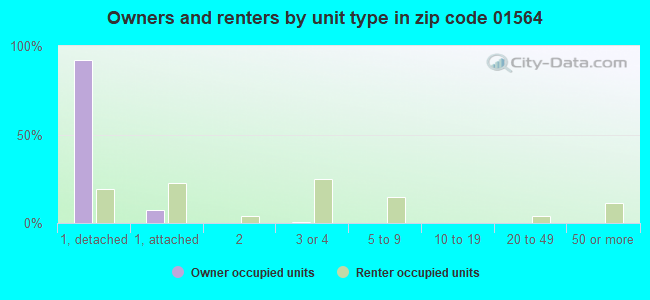
Houses and condos: 3,519 Renter-occupied apartments: 395
% of renters here:
11%
State:
38%
March 2022 cost of living index in zip code 01564: 110.2 (more than average, U.S. average is 100)
Land area: 30.6 sq. mi. Water area: 1.1 sq. mi.
Population density: 263 people per square mile
(very low).
OSM Map
Google Map
MSN Map
OSM Map
General Map
Google Map
MSN Map
OSM Map
Google Map
MSN Map
OSM Map
Google Map
MSN Map
Please wait while loading the map...
Real estate property taxes paid for housing units in 2022:
This zip code:
1.3% ($5,919)
Massachusetts:
1.0% ($5,536)
Median real estate property taxes paid for housing units with mortgages in 2022: $5,926 (1.3%) Median real estate property taxes paid for housing units with no mortgage in 2022: $5,891 (1.3%)
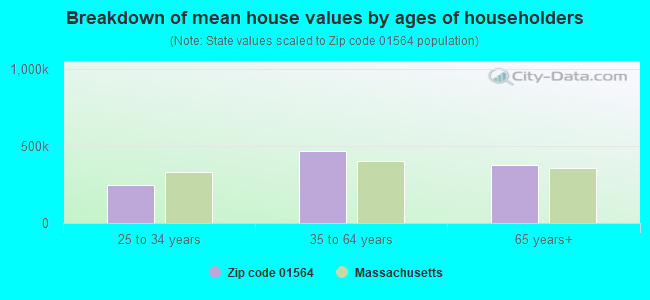
Estimated median house/condo value in 2022: $467,738
01564:
$467,738
Massachusetts:
$534,700
According to our research of Massachusetts and other state lists, there were 2 registered sex offenders living in 01564 zip code as of April 27, 2024. The ratio of all residents to sex offenders in zip code 01564 is 4,034 to 1. The ratio of registered sex offenders to all residents in this zip code is much lower than the state average.
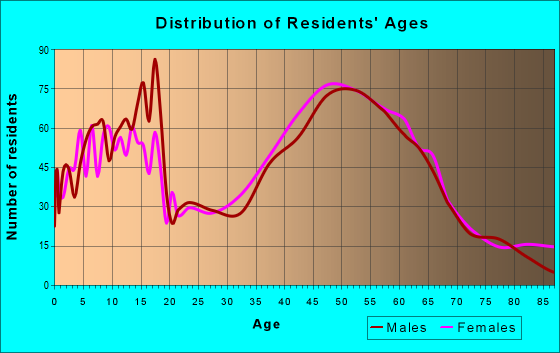
Median resident age:
This zip code:
51.7 years
Massachusetts median age:
40.3 years
Average household size:
This zip code:
2.2 people
Massachusetts:
2.4 people
Averages for the 2020 tax year for zip code 01564, filed in 2021:
Average Adjusted Gross Income (AGI) in 2020: $103,136 (Individual Income Tax Returns)
Here:
$103,136
State:
$105,130
Salary/wage: $88,228 (reported on 82.4% of returns)
Here:
$88,228
State:
$82,951
(% of AGI for various income ranges: 1030.2% for AGIs below $25k, 3534.5% for AGIs $25k-50k, 6426.0% for AGIs $50k-75k, 8993.0% for AGIs $75k-100k, 19534.2% for AGIs $100k-200k, 82846.0% for AGIs over 200k)
Taxable interest for individuals: $1,070 (reported on 54.8% of returns)
This zip code:
$1,070
Massachusetts:
$2,361
(% of AGI for various income ranges: 30.7% for AGIs below $25k, 37.5% for AGIs $25k-50k, 51.0% for AGIs $50k-75k, 74.3% for AGIs $75k-100k, 101.6% for AGIs $100k-200k, 757.3% for AGIs over 200k)
Ordinary dividends: $8,254 (reported on 29.7% of returns)
Here:
$8,254
State:
$10,365
(% of AGI for various income ranges: 42.0% for AGIs below $25k, 67.2% for AGIs $25k-50k, 99.2% for AGIs $50k-75k, 192.3% for AGIs $75k-100k, 257.9% for AGIs $100k-200k, 5008.7% for AGIs over 200k)
Net capital gain/loss in AGI: +$17,533 (reported on 26.0% of returns)
Here:
+$17,533
State:
+$48,178
(% of AGI for various income ranges: 20.2% for AGIs below $25k, 48.1% for AGIs $25k-50k, 73.5% for AGIs $50k-75k, 261.0% for AGIs $75k-100k, 421.9% for AGIs $100k-200k, 10519.3% for AGIs over 200k)
Profit/loss from business: +$16,911 (reported on 16.7% of returns)
Here:
+$16,911
State:
+$20,792
(% of AGI for various income ranges: 117.7% for AGIs below $25k, 195.3% for AGIs $25k-50k, 254.8% for AGIs $50k-75k, 396.0% for AGIs $75k-100k, 570.0% for AGIs $100k-200k, 3319.3% for AGIs over 200k)
Taxable individual retirement arrangement distribution: $22,853 (reported on 13.5% of returns)
01564:
$22,853
Massachusetts:
$22,790
(% of AGI for various income ranges: 88.7% for AGIs below $25k, 173.0% for AGIs $25k-50k, 359.2% for AGIs $50k-75k, 648.3% for AGIs $75k-100k, 764.9% for AGIs $100k-200k, 2709.3% for AGIs over 200k)
Self-employed (Keogh) retirement plans: $16,980 (reported on 1.2% of returns)
01564:
$16,980
Massachusetts:
$26,868
(% of AGI for various income ranges: 69.1% for AGIs $100k-200k, 303.3% for AGIs over 200k)
Total itemized deductions: $29,387 (reported on 14.2% of returns)
Here:
$29,387
State:
$36,722
(% of AGI for various income ranges: 168.3% for AGIs below $25k, 273.2% for AGIs $25k-50k, 487.2% for AGIs $50k-75k, 757.7% for AGIs $75k-100k, 1022.5% for AGIs $100k-200k, 3612.0% for AGIs over 200k)
Charity contributions: $5,511 (reported on 10.7% of returns)
Here:
$5,511
State:
$12,529
(% of AGI for various income ranges: 7.2% for AGIs below $25k, 9.4% for AGIs $25k-50k, 27.0% for AGIs $50k-75k, 88.0% for AGIs $75k-100k, 105.4% for AGIs $100k-200k, 979.3% for AGIs over 200k)
Taxes paid: $8,916 (reported on 14.2% of returns)
01564:
$8,916
State:
$8,782
(% of AGI for various income ranges: 37.5% for AGIs below $25k, 60.0% for AGIs $25k-50k, 154.8% for AGIs $50k-75k, 253.3% for AGIs $75k-100k, 361.8% for AGIs $100k-200k, 970.0% for AGIs over 200k)
Earned income credit: $1,450 (reported on 5.1% of returns)
Here:
$1,450
State:
$1,909
(% of AGI for various income ranges: 28.0% for AGIs below $25k, 28.5% for AGIs $25k-50k)
Percentage of individuals using paid preparers for their 2020 taxes: 92.8%
Here:
93%
State:
92%
(% for various income ranges: 91.1% for AGIs below $25k, 93.1% for AGIs $25k-50k, 91.5% for AGIs $50k-75k, 93.5% for AGIs $75k-100k, 94.1% for AGIs $100k-200k, 94.1% for AGIs over 200k)
Averages for the 2012 tax year for zip code 01564, filed in 2013:
Average Adjusted Gross Income (AGI) in 2012: $86,629 (Individual Income Tax Returns)
Here:
$86,629
State:
$81,425
Salary/wage: $75,786 (reported on 86.4% of returns)
Here:
$75,786
State:
$64,752
(% of AGI for various income ranges: 70.0% for AGIs below $25k, 70.9% for AGIs $25k-50k, 75.0% for AGIs $50k-75k, 75.9% for AGIs $75k-100k, 83.6% for AGIs $100k-200k, 68.2% for AGIs over 200k)
Taxable interest for individuals: $1,165 (reported on 53.7% of returns)
This zip code:
$1,165
Massachusetts:
$2,136
(% of AGI for various income ranges: 1.8% for AGIs below $25k, 1.0% for AGIs $25k-50k, 1.0% for AGIs $50k-75k, 0.6% for AGIs $75k-100k, 0.4% for AGIs $100k-200k, 0.8% for AGIs over 200k)
Ordinary dividends: $5,132 (reported on 30.1% of returns)
Here:
$5,132
State:
$9,473
(% of AGI for various income ranges: 2.4% for AGIs below $25k, 1.2% for AGIs $25k-50k, 1.9% for AGIs $50k-75k, 1.4% for AGIs $75k-100k, 0.9% for AGIs $100k-200k, 2.9% for AGIs over 200k)
Net capital gain/loss in AGI: +$11,370 (reported on 25.2% of returns)
Here:
+$11,370
State:
+$31,437
(% of AGI for various income ranges: 0.2% for AGIs $25k-50k, 0.5% for AGIs $50k-75k, 1.5% for AGIs $75k-100k, 0.6% for AGIs $100k-200k, 8.8% for AGIs over 200k)
Profit/loss from business: +$20,083 (reported on 16.7% of returns)
Here:
+$20,083
State:
+$20,662
(% of AGI for various income ranges: 7.2% for AGIs below $25k, 6.6% for AGIs $25k-50k, 3.9% for AGIs $50k-75k, 3.3% for AGIs $75k-100k, 2.9% for AGIs $100k-200k, 4.2% for AGIs over 200k)
Taxable individual retirement arrangement distribution: $16,698 (reported on 12.1% of returns)
01564:
$16,698
Massachusetts:
$18,892
(% of AGI for various income ranges: 4.5% for AGIs below $25k, 4.0% for AGIs $25k-50k, 2.6% for AGIs $50k-75k, 3.4% for AGIs $75k-100k, 2.5% for AGIs $100k-200k, 1.1% for AGIs over 200k)
Self-employment retirement plans: $12,614 (reported on 1.8% of returns)
01564:
$12,614
Massachusetts:
$20,669
(% of AGI for various income ranges: 1.0% for AGIs below $25k, 0.3% for AGIs $100k-200k, 0.4% for AGIs over 200k)
Total itemized deductions: $26,318 (19% of AGI, reported on 51.2% of returns)
Here:
$26,318
State:
$28,907
Here:
18.9% of AGI
State:
18.2% of AGI
(% of AGI for various income ranges: 15.9% for AGIs below $25k, 13.7% for AGIs $25k-50k, 16.7% for AGIs $50k-75k, 17.2% for AGIs $75k-100k, 16.2% for AGIs $100k-200k, 14.4% for AGIs over 200k)
Charity contributions: $2,330 (reported on 44.0% of returns)
Here:
$2,330
State:
$4,208
(% of AGI for various income ranges: 0.7% for AGIs below $25k, 0.8% for AGIs $25k-50k, 1.2% for AGIs $50k-75k, 1.1% for AGIs $75k-100k, 1.3% for AGIs $100k-200k, 1.2% for AGIs over 200k)
Taxes paid: $12,252 (reported on 50.9% of returns)
01564:
$12,252
State:
$13,303
(% of AGI for various income ranges: 4.8% for AGIs below $25k, 4.5% for AGIs $25k-50k, 6.2% for AGIs $50k-75k, 7.5% for AGIs $75k-100k, 8.2% for AGIs $100k-200k, 7.1% for AGIs over 200k)
Earned income credit: $1,668 (reported on 6.4% of returns)
Here:
$1,668
State:
$1,971
(% of AGI for various income ranges: 2.3% for AGIs below $25k, 0.6% for AGIs $25k-50k)
Percentage of individuals using paid preparers for their 2012 taxes: 57.6%
Here:
58%
State:
56%
(% for various income ranges: 50.4% for AGIs below $25k, 56.1% for AGIs $25k-50k, 61.2% for AGIs $50k-75k, 64.1% for AGIs $75k-100k, 58.9% for AGIs $100k-200k, 70.0% for AGIs over 200k)
Averages for the 2004 tax year for zip code 01564, filed in 2005:
Average Adjusted Gross Income (AGI) in 2004: $70,358 (Individual Income Tax Returns)
Here:
$70,358
State:
$62,877
Salary/wage: $63,296 (reported on 87.0% of returns)
Here:
$63,296
State:
$52,969
(% of AGI for various income ranges: 112.1% for AGIs below $10k, 65.6% for AGIs $10k-25k, 78.5% for AGIs $25k-50k, 78.8% for AGIs $50k-75k, 84.1% for AGIs $75k-100k, 76.9% for AGIs over 100k)
Taxable interest for individuals: $1,261 (reported on 67.3% of returns)
This zip code:
$1,261
Massachusetts:
$1,945
(% of AGI for various income ranges: 7.1% for AGIs below $10k, 3.3% for AGIs $10k-25k, 1.5% for AGIs $25k-50k, 1.4% for AGIs $50k-75k, 0.8% for AGIs $75k-100k, 1.0% for AGIs over 100k)
Taxable dividends: $2,584 (reported on 36.0% of returns)
Here:
$2,584
State:
$5,323
(% of AGI for various income ranges: 4.9% for AGIs below $10k, 1.8% for AGIs $10k-25k, 1.3% for AGIs $25k-50k, 0.9% for AGIs $50k-75k, 1.1% for AGIs $75k-100k, 1.4% for AGIs over 100k)
Net capital gain/loss: +$9,332 (reported on 30.7% of returns)
Here:
+$9,332
State:
+$20,377
(% of AGI for various income ranges: -3.3% for AGIs below $10k, -0.6% for AGIs $10k-25k, 1.1% for AGIs $25k-50k, 1.2% for AGIs $50k-75k, 1.3% for AGIs $75k-100k, 6.3% for AGIs over 100k)
Profit/loss from business: +$17,390 (reported on 18.8% of returns)
Here:
+$17,390
State:
+$17,837
(% of AGI for various income ranges: 1.2% for AGIs below $10k, 8.7% for AGIs $10k-25k, 6.2% for AGIs $25k-50k, 5.8% for AGIs $50k-75k, 4.2% for AGIs $75k-100k, 4.0% for AGIs over 100k)
IRA payment deduction: $3,091 (reported on 4.2% of returns)
01564:
$3,091
Massachusetts:
$3,100
(% of AGI for various income ranges: 0.6% for AGIs $10k-25k, 0.4% for AGIs $25k-50k, 0.2% for AGIs $50k-75k, 0.2% for AGIs $75k-100k, 0.1% for AGIs over 100k)
Self-employed pension: $11,082 (reported on 2.3% of returns)
Here:
$11,082
Massachusetts:
$14,516
(% of AGI for various income ranges: 0.2% for AGIs $25k-50k, 0.3% for AGIs $50k-75k, 0.3% for AGIs $75k-100k, 0.4% for AGIs over 100k)
Total itemized deductions: $22,802 (21% of AGI, reported on 53.4% of returns)
Here:
$22,802
State:
$22,573
Here:
20.7% of AGI
State:
19.5% of AGI
(% of AGI for various income ranges: 22.4% for AGIs below $10k, 14.8% for AGIs $10k-25k, 15.7% for AGIs $25k-50k, 18.7% for AGIs $50k-75k, 19.4% for AGIs $75k-100k, 16.8% for AGIs over 100k)
Charity contributions deductions: $2,195 (2% of AGI, reported on 49.0% of returns)
Here:
$2,195
State:
$3,295
Here:
2.0% of AGI
State:
2.7% of AGI
(% of AGI for various income ranges: 0.4% for AGIs below $10k, 0.9% for AGIs $10k-25k, 1.2% for AGIs $25k-50k, 1.5% for AGIs $50k-75k, 1.7% for AGIs $75k-100k, 1.6% for AGIs over 100k)
Total tax: $11,326 (reported on 84.0% of returns)
01564:
$11,326
State:
$11,494
(% of AGI for various income ranges: 2.7% for AGIs below $10k, 5.8% for AGIs $10k-25k, 8.0% for AGIs $25k-50k, 9.5% for AGIs $50k-75k, 10.4% for AGIs $75k-100k, 16.8% for AGIs over 100k)
Earned income credit: $1,127 (reported on 5.3% of returns)
Here:
$1,127
State:
$1,518
Percentage of individuals using paid preparers for their 2004 taxes: 56.5%
Here:
56%
State:
58%
(% for various income ranges: 43.8% for AGIs below $10k, 54.5% for AGIs $10k-25k, 58.1% for AGIs $25k-50k, 60.9% for AGIs $50k-75k, 58.9% for AGIs $75k-100k, 61.7% for AGIs over 100k)
Household received Food Stamps/SNAP in the past 12 months: 241 Household did not receive Food Stamps/SNAP in the past 12 months: 3,234
Women who had a birth in the past 12 months: 71 (74 now married, 0 unmarried) Women who did not have a birth in the past 12 months: 1,163 (628 now married, 522 unmarried)
Housing units in zip code 01564 with a mortgage: 2,121 (145 second mortgage, 148 both second mortgage and home equity loan) Houses without a mortgage: 62
Median monthly owner costs for units with a mortgage: $2,260 Median monthly owner costs for units without a mortgage: $887
Residents with income below the poverty level in 2022:
This zip code:
2.6%
Whole state:
10.4%
Residents with income below 50% of the poverty level in 2022:
This zip code:
1.4%
Whole state:
5.1%
Median number of rooms in houses and condos:
Here:
7.1
State:
6.5
Median number of rooms in apartments:
Here:
3.8
State:
4.0
Notable locations in this zip code not listed on our city pages
Notable locations in zip code 01564: Clearview Farm (A), Meadowbrook Orchards (B), Old Oak Apple Farm (C), Sunny Crest Orchards (D), Sterling Fire Department (E), Sterling Town Hall (F). Display/hide their locations on the map
Cemeteries: Hillside Cemetery (1), Chocksett Cemetery (2), Hillside Cemetery (3), Oak Hill Cemetery (4), West Cemetery (5), Oak Hill Cemetery (6). Display/hide their locations on the map
Lakes and reservoirs: West Waushacum Pond (A), Tuttle Lake (B), Spring Basin (C), The Quag (D), Muddy Pond (E), Lynde Basins (F), Fitch Pond (G), East Waushacum Pond (H). Display/hide their locations on the map
Streams, rivers, and creeks: Bailey Brook (A), Ball Brook (B), Bartlett Pond Brook (C), Connelly Brook (D), East Wachusett Brook (E), Houghton Brook (F), Justice Brook (G), Keyes Brook (H), Lynde Brook (I). Display/hide their locations on the map
In group quarters: 158 (-1 institutionalized population)
Size of family households: 1,410 2-persons, 545 3-persons, 382 4-persons, 115 5-persons, 46 7-or-more-persons
Size of nonfamily households: 914 1-person, 115 2-persons
1,199 married couples with children.
241 single-parent households (241 women).
95.9% of residents of 01564 zip code speak English at home.
3.6% of residents speak other Indo-European language at home (70% very well, 30% well).
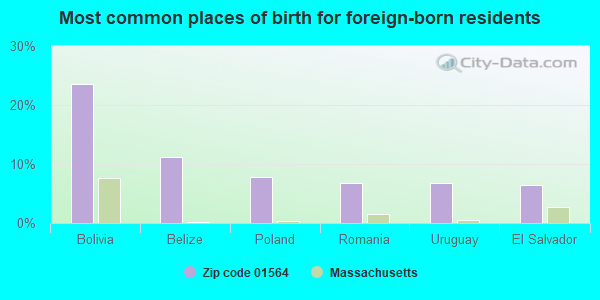
Foreign born population: 322 (4.0%) (43.0% of them are naturalized citizens)
This zip code:
4.0%
Whole state:
18.0%
24%Bolivia
11%Belize
8%Poland
7%Romania
7%Uruguay
7%El Salvador
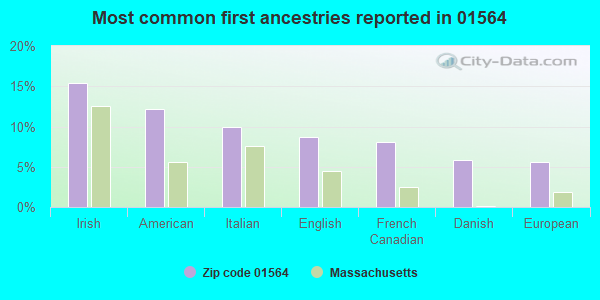
15%Irish
12%American
10%Italian
9%English
8%French Canadian
6%Danish
6%European
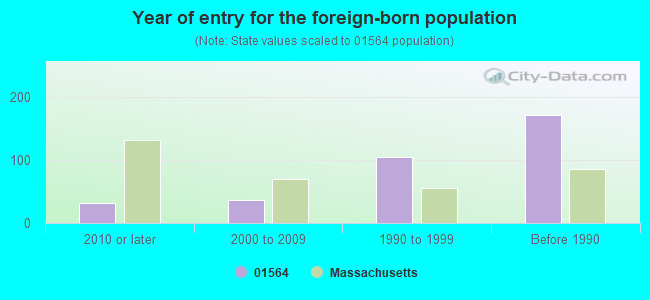
Year of entry for the foreign-born population
322010 or later
362000 to 2009
1051990 to 1999
171Before 1990
Facilities with environmental interests located in this zip code:
CHOCKSETT MIDDLE SCHOOL (40 BOUTELLE ROAD in STERLING, MA)
(National Center for Education Statistics) - STATE ID-775315 Organizations: WACHUSETT (SCHOOL DISTRICT)
NEW ENGLAND TEXTURES INC (12 BEVERLY DR in STERLING, MA)
(Resource Conservation and Recovery Act (tracking hazardous waste)) Organizations: JULIAN L ROBINSON (CONTACT/OWNER)
MASS HIGHWAY DEPT (RTE 12 in STERLING, MA)
Conditionally Exempt Small Quantity Generators, less than 100 kg/month of hazardous waste (Resource Conservation and Recovery Act (tracking hazardous waste)) - notification Organizations: MA HIGHWAY DEPARTMENT (CONTACT/OPERATOR)
, COMM OF MASS (CONTACT/OWNER)
Alternative names: MA HIGHWAY DEPT
MORSE MFG INC (44 CHOCKSETT RD in STERLING, MA)
Small Quantity Generators, between 100 kg and 1000 kg of hazardous waste/month (Resource Conservation and Recovery Act (tracking hazardous waste)) - notification Organizations: MORSE MANUFACTURING INC (CONTACT/OPERATOR)
NEW ENGLAND POWER CO (PRATTS JUNCTION RD in STERLING, MA)
Conditionally Exempt Small Quantity Generators, less than 100 kg/month of hazardous waste (Resource Conservation and Recovery Act (tracking hazardous waste)) - notification Organizations: NEW ENGLAND POWER CO PRATTS JU (CONTACT/OPERATOR)
Alternative names: NEW ENGLAND POWER CO PRATTS JUNCT
PANDOLF PERKINS (194 WORCESTER ROAD in STERLING, MA)
AIR SYNTHETIC MINOR (AIRS/AFS) CRITERIA AND HAZARDOUS AIR POLLUTANT INVENTORY (Inventory of air pollution sources) Business SIC classification: ASPHALT PAVING MIXTURES AND BLOCKS
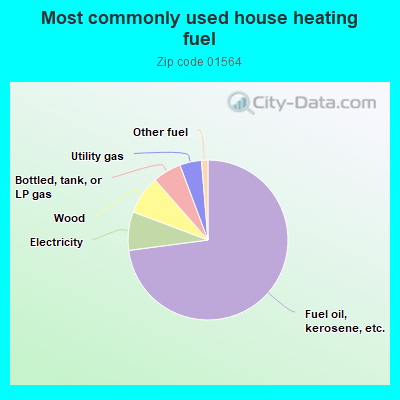
73.0%Fuel oil, kerosene, etc.
7.8%Electricity
7.8%Wood
5.8%Bottled, tank, or LP gas
4.4%Utility gas
1.3%Other fuel
Population in 1990: 6,481. Population change in the 1990s: +776 (+12.0%).
Place of birth for U.S.-born residents:
This state: 5,891
Northeast: 1,133
Midwest: 144
South: 273
West: 203
68% of the 01564 zip code residents lived in the same house 5 years ago. Out of people who lived in different houses, 79% lived in this county. Out of people who lived in different counties, 50% lived in Massachusetts.
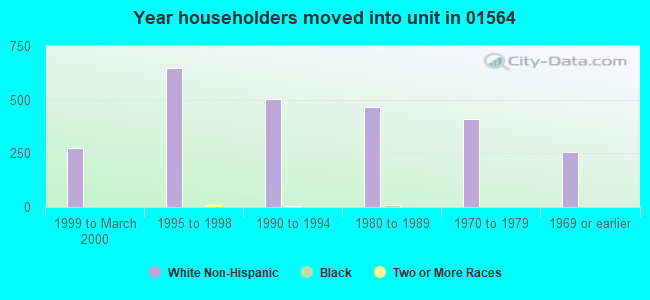
96% of the 01564 zip code residents lived in the same house 1 year ago. Out of people who lived in different houses, 63% moved from this county. Out of people who lived in different houses, 14% moved from different county within same state. Out of people who lived in different houses, 24% moved from different state.
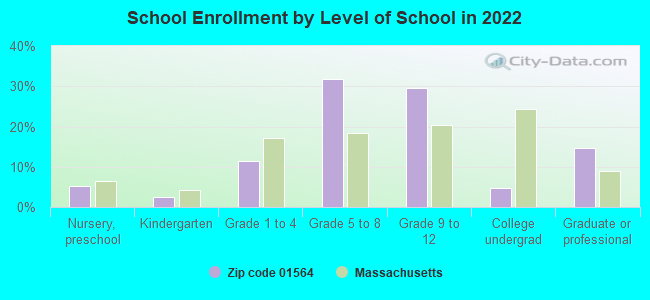
Private vs. public school enrollment:
Students in private schools in grades 1 to 8 (elementary and middle school): 145
Here:
21.6%
Massachusetts:
10.3%
Students in private schools in grades 9 to 12 (high school): 72
Here:
15.8%
Massachusetts:
12.3%
Students in private undergraduate colleges: 23
Here:
30.7%
Massachusetts:
51.2%
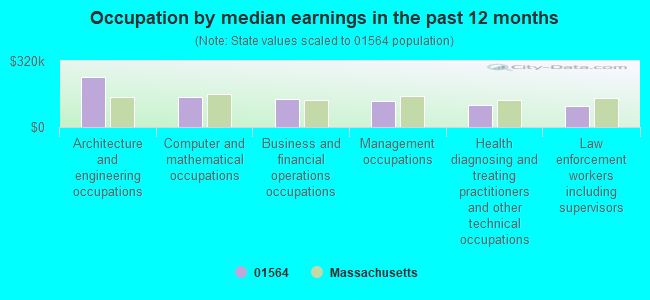
Occupation by median earnings in the past 12 months ($)
240,265Architecture and engineering occupations
145,229Computer and mathematical occupations
134,802Business and financial operations occupations
127,554Management occupations
106,677Health diagnosing and treating practitioners and other technical occupations
100,631Law enforcement workers including supervisors
Companies with federal contracts located in this zip code (STERLING, MA):
NORTHEAST MILITARY SALES, INC (17 SHERWOOD DRIVE; small business) : $100,597,523 in 154 contractsfrom 1999 to 2006
Contracts for Food Services, Non-Food Items For Resale by Defense Commissary Agency, Department of Defense Signed by year:2000: $5,938,880; 2001: $11,450,598; 2002: $11,044,348; 2003: $8,490,061; 2004: $19,751,066; 2005: $30,374,033; 2006: $12,363,432.
Biggest contracts:
$3,401,630 with Defense Commissary Agency for Food Services. Signed on 2004-10-01. Completion date: 2005-09-30.
$3,014,234, same as above.Signed on 2004-10-01. Completion date: 2005-02-28.
$2,990,430, same as above.Signed on 2004-10-01. Completion date: 2005-02-28.
$2,882,248, same as above.Signed on 2003-10-01. Completion date: 2004-03-31.
COLONIAL WIRE & CABLE, INC (11B DANA HILL RD; small business) : $113,100 in 14 contractsfrom 2003 to 2005
Contracts for Wire and Cable, Electrical, Fiber Optic Cables by Defense Logistics Agency, Navy, Army, Bureau of Prisoners/Federal Prison System, and others Signed by year:2000: $0; 2001: $0; 2002: $0; 2003: $72,148; 2004: $4,190; 2005: $36,762; 2006: $0.
Biggest contracts:
$60,477 with Defense Logistics Agency for Wire and Cable, Electrical. Signed on 2003-10-20. Completion date: 2004-02-20.
$19,925 with Navy for Wire and Cable, Electrical. Signed on 2005-09-21. Completion date: 2005-11-25.
$8,590 with Army for Wire and Cable, Electrical. Signed on 2003-05-12. Completion date: 2003-09-26.
$6,831 with Defense Logistics Agency for Fiber Optic Cables. Signed on 2005-03-15. Completion date: 2005-05-15.
MORSE MANUFACTURING INC (44 CHOCKSETT ROAD; small business) : $103,237 in 2 contractsfrom 2000 to 2004
$100,249 with Army for Fuels, Solid. Signed on 2000-08-02. Completion date: 2001-04-30.
$2,988 with Army for Modification of Equipment -- Ground Effect Vehicles, Motor Vehicles, Trailers, and Cycles. Signed on 2004-05-24. Completion date: 2004-07-05.
MARIANNE KUSA RYLL (252 JUSTICE HILL ROAD; small business) : $55,915 in 65 contractsfrom 2001 to 2006
Contracts for Stenographic Services, Court Reporting Services, Transcription Services, Library Services by U.S. Army Corps of Engineers - civil program financing only, Army, Internal Revenue Service Signed by year:2000: $0; 2001: $968; 2002: $11,492; 2003: $27,642; 2004: $12,488; 2005: $2,252; 2006: $1,073.
Biggest contracts:
$6,019 with U.S. Army Corps of Engineers - civil program financing only for Stenographic Services. Signed on 2003-04-24. Completion date: 2003-05-16.
$5,489 with U.S. Army Corps of Engineers - civil program financing only for Court Reporting Services. Signed on 2003-04-07. Completion date: 2003-05-05.
$3,941 with U.S. Army Corps of Engineers - civil program financing only for Court Reporting Services. Taking place in RI. Signed on 2002-05-24. Completion date: 2002-06-06.
$3,875 with U.S. Army Corps of Engineers - civil program financing only for Court Reporting Services. Signed on 2004-03-10. Completion date: 2004-04-15.
ALBRIGHT TECHNOLOGIES INC (92 ALBRIGHT RD; small business) : $27,571 in 2 contractsfrom 2002 to 2003
$18,388 with Army for Textiles, Clothing and Equipage -- Operational Systems Development (R&D). Signed on 2002-09-25. Completion date: 2002-11-29.
$9,183, same as above.Signed on 2003-02-03. Completion date: 2003-02-28.
TDS, INC (2 PETER DRIVE; small business) : $5,220 in 4 contractsfrom 2001 to 2004
$4,200 with Army for Well Drilling/Exploratory Services. Signed on 2001-10-04. Completion date: 2001-11-02.
$3,300, same as above.Signed on 2002-05-30. Completion date: 2002-06-30.
-$450, same as above.Signed on 2001-12-04. Completion date: 2001-11-02.
-$1,830, same as above.Signed on 2004-06-07. Completion date: 2002-06-30.
SERVICES FOUR AUTOMATIONS LLC (68 PRATTS JUNCTION RD; small business)
$4,610 with Army for Engineering and Technical Services. Signed on 2006-01-12. Completion date: 2007-01-10.
LEE PLASTICS INC (102 PRATTS JUNCTION RD; small business)
$210 with Army for Hardware, Commercial. Signed on 2005-04-26. Completion date: 2005-05-12.
Top industries in this zip code by the number of employees in 2005:
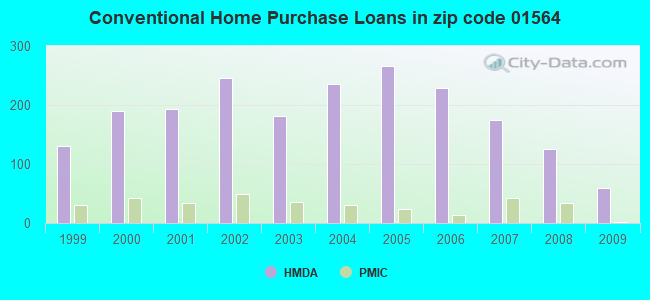
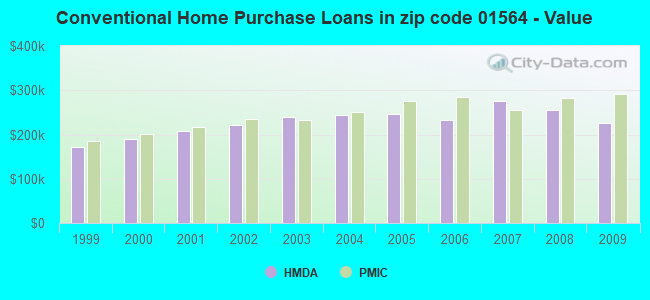
Detailed PMIC statistics for the following Tracts:7191.00
2002 - 2018 National Fire Incident Reporting System (NFIRS) incidents
Based on the data from the years 2002 - 2018 the average number of fires per year is 38. The highest number of fires - 61 took place in 2007, and the least - 10 in 2002. The data has a rising trend.
When looking into fire subcategories, the most incidents belonged to: Structure Fires (40.4%), and Outside Fires (33.2%).
Fire incident types reported to NFIRS in Zip Code 01564


 Nearest zip codes: 01453, 01583, 01561, 01510, 01541, 01523.


 Based on the data from the years 2002 - 2018 the average number of fires per year is 38. The highest number of fires - 61 took place in 2007, and the least - 10 in 2002. The data has a rising trend.
 When looking into fire subcategories, the most incidents belonged to: Structure Fires (40.4%), and Outside Fires (33.2%).