Estimated zip code population in 2022: 27,024 Zip code population in 2010: 23,945 Zip code population in 2000: 23,773
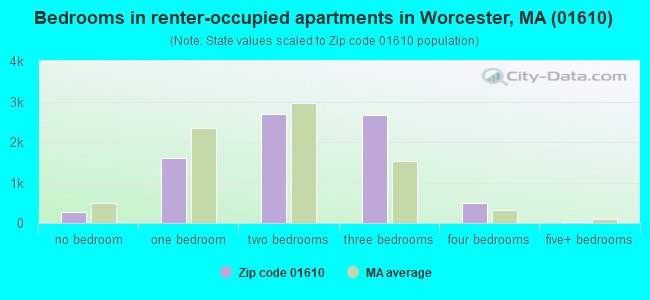
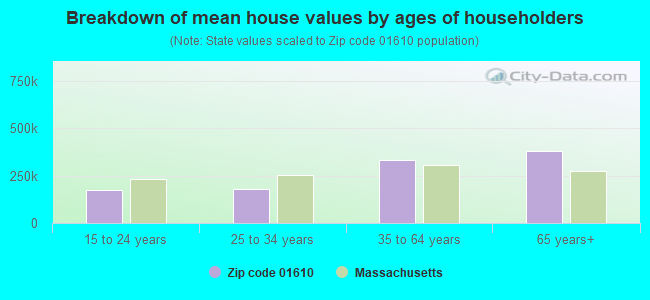
Houses and condos: 10,255 Renter-occupied apartments: 7,729
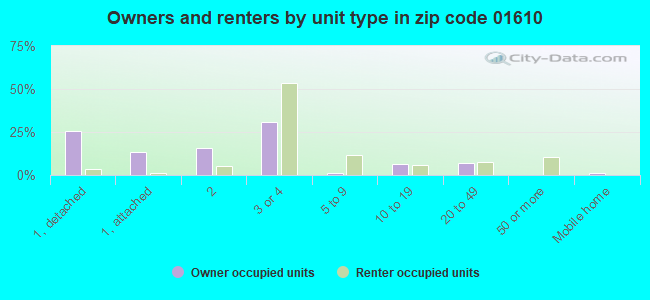
% of renters here:
83%
State:
38%
March 2022 cost of living index in zip code 01610: 129.6 (high, U.S. average is 100)
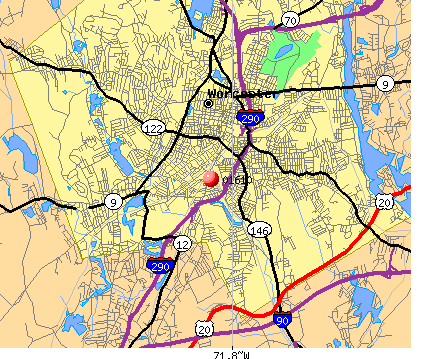
Land area: 2.1 sq. mi. Water area: 0.0 sq. mi.
Population density: 12,712 people per square mile
(very high).
OSM Map
Google Map
MSN Map
OSM Map
General Map
Google Map
MSN Map
OSM Map
Google Map
MSN Map
OSM Map
Google Map
MSN Map
Please wait while loading the map...
Real estate property taxes paid for housing units in 2022:
This zip code:
1.2% ($3,421)
Massachusetts:
1.0% ($5,536)
Median real estate property taxes paid for housing units with mortgages in 2022: $3,342 (1.2%) Median real estate property taxes paid for housing units with no mortgage in 2022: $3,587 (1.2%)
Averages for the 2020 tax year for zip code 01610, filed in 2021:
Average Adjusted Gross Income (AGI) in 2020: $35,276 (Individual Income Tax Returns)
Here:
$35,276
State:
$105,130
Salary/wage: $33,178 (reported on 87.2% of returns)
Here:
$33,178
State:
$82,951
(% of AGI for various income ranges: 1211.2% for AGIs below $25k, 3727.1% for AGIs $25k-50k, 7295.7% for AGIs $50k-75k, 10597.9% for AGIs $75k-100k, 16436.5% for AGIs $100k-200k)
Taxable interest for individuals: $230 (reported on 16.0% of returns)
This zip code:
$230
Massachusetts:
$2,361
(% of AGI for various income ranges: 2.3% for AGIs below $25k, 4.3% for AGIs $25k-50k, 8.7% for AGIs $50k-75k, 12.1% for AGIs $75k-100k, 24.5% for AGIs $100k-200k)
Ordinary dividends: $891 (reported on 3.4% of returns)
Here:
$891
State:
$10,365
(% of AGI for various income ranges: 2.3% for AGIs below $25k, 1.8% for AGIs $25k-50k, 4.4% for AGIs $50k-75k, 10.0% for AGIs $75k-100k, 53.0% for AGIs $100k-200k)
Net capital gain/loss in AGI: +$4,641 (reported on 4.1% of returns)
Here:
+$4,641
State:
+$48,178
(% of AGI for various income ranges: 1.8% for AGIs below $25k, 6.4% for AGIs $25k-50k, 22.3% for AGIs $50k-75k, 23.2% for AGIs $75k-100k, 687.5% for AGIs $100k-200k)
Profit/loss from business: +$6,638 (reported on 14.6% of returns)
Here:
+$6,638
State:
+$20,792
(% of AGI for various income ranges: 112.8% for AGIs below $25k, 104.0% for AGIs $25k-50k, 175.2% for AGIs $50k-75k, 155.3% for AGIs $75k-100k, 511.5% for AGIs $100k-200k)
Taxable individual retirement arrangement distribution: $10,685 (reported on 1.3% of returns)
01610:
$10,685
Massachusetts:
$22,790
(% of AGI for various income ranges: 8.1% for AGIs below $25k, 10.6% for AGIs $25k-50k, 38.0% for AGIs $50k-75k, 241.0% for AGIs $100k-200k)
Total itemized deductions: $25,286 (reported on 2.9% of returns)
Here:
$25,286
State:
$36,722
(% of AGI for various income ranges: 18.1% for AGIs below $25k, 58.0% for AGIs $25k-50k, 249.2% for AGIs $50k-75k, 345.0% for AGIs $75k-100k, 803.5% for AGIs $100k-200k)
Charity contributions: $8,982 (reported on 2.2% of returns)
Here:
$8,982
State:
$12,529
(% of AGI for various income ranges: 16.9% for AGIs $25k-50k, 65.5% for AGIs $50k-75k, 117.9% for AGIs $75k-100k, 235.0% for AGIs $100k-200k)
Taxes paid: $5,664 (reported on 2.8% of returns)
01610:
$5,664
State:
$8,782
(% of AGI for various income ranges: 2.4% for AGIs below $25k, 8.9% for AGIs $25k-50k, 50.7% for AGIs $50k-75k, 83.2% for AGIs $75k-100k, 252.5% for AGIs $100k-200k)
Earned income credit: $2,282 (reported on 27.3% of returns)
Here:
$2,282
State:
$1,909
(% of AGI for various income ranges: 120.5% for AGIs below $25k, 86.1% for AGIs $25k-50k, 1.6% for AGIs $50k-75k)
Percentage of individuals using paid preparers for their 2020 taxes: 90.7%
Here:
91%
State:
92%
(% for various income ranges: 90.5% for AGIs below $25k, 91.2% for AGIs $25k-50k, 89.7% for AGIs $50k-75k, 93.8% for AGIs $75k-100k, 90.3% for AGIs $100k-200k, 66.7% for AGIs over 200k)
Averages for the 2012 tax year for zip code 01610, filed in 2013:
Average Adjusted Gross Income (AGI) in 2012: $27,860 (Individual Income Tax Returns)
Here:
$27,860
State:
$81,425
Salary/wage: $26,863 (reported on 90.8% of returns)
Here:
$26,863
State:
$64,752
(% of AGI for various income ranges: 82.4% for AGIs below $25k, 90.9% for AGIs $25k-50k, 92.1% for AGIs $50k-75k, 87.0% for AGIs $75k-100k, 79.2% for AGIs $100k-200k)
Taxable interest for individuals: $395 (reported on 12.5% of returns)
This zip code:
$395
Massachusetts:
$2,136
(% of AGI for various income ranges: 0.2% for AGIs below $25k, 0.2% for AGIs $25k-50k, 0.2% for AGIs $75k-100k, 0.3% for AGIs $100k-200k)
Ordinary dividends: $1,745 (reported on 3.8% of returns)
Here:
$1,745
State:
$9,473
(% of AGI for various income ranges: 0.1% for AGIs below $25k, 0.1% for AGIs $25k-50k, 0.2% for AGIs $50k-75k, 0.3% for AGIs $75k-100k, 1.1% for AGIs $100k-200k)
Net capital gain/loss in AGI: +$405 (reported on 2.5% of returns)
Here:
+$405
State:
+$31,437
(% of AGI for various income ranges: 0.1% for AGIs $50k-75k)
Profit/loss from business: +$8,534 (reported on 11.4% of returns)
Here:
+$8,534
State:
+$20,662
(% of AGI for various income ranges: 8.8% for AGIs below $25k, 2.4% for AGIs $25k-50k, 0.7% for AGIs $50k-75k, 1.5% for AGIs $75k-100k, 1.4% for AGIs $100k-200k)
Taxable individual retirement arrangement distribution: $9,695 (reported on 2.3% of returns)
01610:
$9,695
Massachusetts:
$18,892
(% of AGI for various income ranges: 0.5% for AGIs below $25k, 0.6% for AGIs $25k-50k, 0.8% for AGIs $50k-75k, 3.4% for AGIs $75k-100k)
Total itemized deductions: $16,456 (29% of AGI, reported on 12.9% of returns)
Here:
$16,456
State:
$28,907
Here:
29.2% of AGI
State:
18.2% of AGI
(% of AGI for various income ranges: 2.7% for AGIs below $25k, 7.6% for AGIs $25k-50k, 10.2% for AGIs $50k-75k, 10.5% for AGIs $75k-100k, 12.7% for AGIs $100k-200k)
Charity contributions: $2,663 (reported on 9.6% of returns)
Here:
$2,663
State:
$4,208
(% of AGI for various income ranges: 0.2% for AGIs below $25k, 1.0% for AGIs $25k-50k, 1.3% for AGIs $50k-75k, 1.2% for AGIs $75k-100k, 1.3% for AGIs $100k-200k)
Taxes paid: $4,723 (reported on 12.8% of returns)
01610:
$4,723
State:
$13,303
(% of AGI for various income ranges: 0.6% for AGIs below $25k, 1.6% for AGIs $25k-50k, 3.1% for AGIs $50k-75k, 3.9% for AGIs $75k-100k, 5.3% for AGIs $100k-200k)
Earned income credit: $2,327 (reported on 36.2% of returns)
Here:
$2,327
State:
$1,971
(% of AGI for various income ranges: 9.7% for AGIs below $25k, 1.6% for AGIs $25k-50k)
Percentage of individuals using paid preparers for their 2012 taxes: 58.0%
Here:
58%
State:
56%
(% for various income ranges: 57.5% for AGIs below $25k, 58.2% for AGIs $25k-50k, 58.7% for AGIs $50k-75k, 62.5% for AGIs $75k-100k, 60.0% for AGIs $100k-200k)
Averages for the 2004 tax year for zip code 01610, filed in 2005:
Average Adjusted Gross Income (AGI) in 2004: $25,373 (Individual Income Tax Returns)
Here:
$25,373
State:
$62,877
Salary/wage: $25,361 (reported on 90.4% of returns)
Here:
$25,361
State:
$52,969
(% of AGI for various income ranges: 91.6% for AGIs below $10k, 90.4% for AGIs $10k-25k, 94.9% for AGIs $25k-50k, 91.9% for AGIs $50k-75k, 85.5% for AGIs $75k-100k, 61.8% for AGIs over 100k)
Taxable interest for individuals: $628 (reported on 22.9% of returns)
This zip code:
$628
Massachusetts:
$1,945
(% of AGI for various income ranges: 1.2% for AGIs below $10k, 0.6% for AGIs $10k-25k, 0.5% for AGIs $25k-50k, 0.7% for AGIs $50k-75k, 0.5% for AGIs $75k-100k, 0.3% for AGIs over 100k)
Taxable dividends: $1,161 (reported on 5.4% of returns)
Here:
$1,161
State:
$5,323
(% of AGI for various income ranges: 0.4% for AGIs below $10k, 0.3% for AGIs $10k-25k, 0.2% for AGIs $25k-50k, 0.2% for AGIs $50k-75k, 0.4% for AGIs $75k-100k, 0.5% for AGIs over 100k)
Net capital gain/loss: +$9,197 (reported on 4.6% of returns)
Here:
+$9,197
State:
+$20,377
(% of AGI for various income ranges: -0.3% for AGIs below $10k, 0.2% for AGIs $10k-25k, 0.0% for AGIs $25k-50k, 0.9% for AGIs $50k-75k, 3.3% for AGIs $75k-100k, 19.4% for AGIs over 100k)
Profit/loss from business: +$6,053 (reported on 9.3% of returns)
Here:
+$6,053
State:
+$17,837
(% of AGI for various income ranges: 7.7% for AGIs below $10k, 4.6% for AGIs $10k-25k, 1.4% for AGIs $25k-50k, 1.1% for AGIs $50k-75k, 0.1% for AGIs $75k-100k, 0.1% for AGIs over 100k)
IRA payment deduction: $2,689 (reported on 1.0% of returns)
01610:
$2,689
Massachusetts:
$3,100
Total itemized deductions: $15,231 (34% of AGI, reported on 16.1% of returns)
Here:
$15,231
State:
$22,573
Here:
34.1% of AGI
State:
19.5% of AGI
(% of AGI for various income ranges: 4.5% for AGIs below $10k, 7.1% for AGIs $10k-25k, 10.9% for AGIs $25k-50k, 10.7% for AGIs $50k-75k, 11.6% for AGIs $75k-100k, 10.1% for AGIs over 100k)
Charity contributions deductions: $2,727 (6% of AGI, reported on 13.0% of returns)
Here:
$2,727
State:
$3,295
Here:
5.8% of AGI
State:
2.7% of AGI
(% of AGI for various income ranges: 0.2% for AGIs below $10k, 0.9% for AGIs $10k-25k, 1.7% for AGIs $25k-50k, 1.5% for AGIs $50k-75k, 1.2% for AGIs $75k-100k, 1.9% for AGIs over 100k)
Total tax: $2,858 (reported on 60.5% of returns)
01610:
$2,858
State:
$11,494
(% of AGI for various income ranges: 2.4% for AGIs below $10k, 3.4% for AGIs $10k-25k, 6.1% for AGIs $25k-50k, 9.0% for AGIs $50k-75k, 11.1% for AGIs $75k-100k, 16.1% for AGIs over 100k)
Earned income credit: $1,796 (reported on 30.2% of returns)
Here:
$1,796
State:
$1,518
Percentage of individuals using paid preparers for their 2004 taxes: 58.0%
Here:
58%
State:
58%
(% for various income ranges: 51.8% for AGIs below $10k, 62.8% for AGIs $10k-25k, 56.8% for AGIs $25k-50k, 58.7% for AGIs $50k-75k, 61.4% for AGIs $75k-100k, 77.0% for AGIs over 100k)
Likely homosexual households (counted as self-reported same-sex unmarried-partner households)
Lesbian couples: 0.2% of all households
Gay men: 0.0% of all households
Household received Food Stamps/SNAP in the past 12 months: 4,622 Household did not receive Food Stamps/SNAP in the past 12 months: 5,243
Women who had a birth in the past 12 months: 375 (129 now married, 217 unmarried) Women who did not have a birth in the past 12 months: 8,367 (1,612 now married, 6,845 unmarried)
Housing units in zip code 01610 with a mortgage: 982 (74 second mortgage, 13 home equity loan, 15 both second mortgage and home equity loan) Median monthly owner costs for units with a mortgage: $2,074 Median monthly owner costs for units without a mortgage: $588
Residents with income below the poverty level in 2022:
This zip code:
35.0%
Whole state:
10.4%
Residents with income below 50% of the poverty level in 2022:
This zip code:
15.9%
Whole state:
5.1%
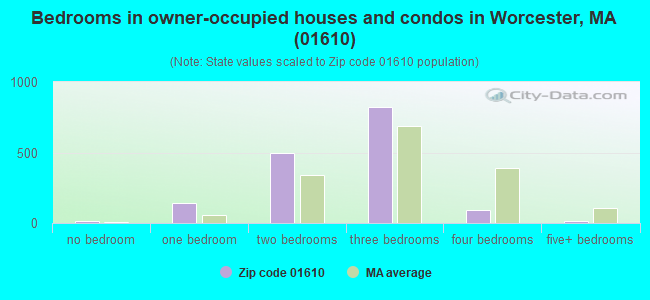
Median number of rooms in houses and condos:
Here:
5.6
State:
6.5
Median number of rooms in apartments:
Here:
4.5
State:
4.0
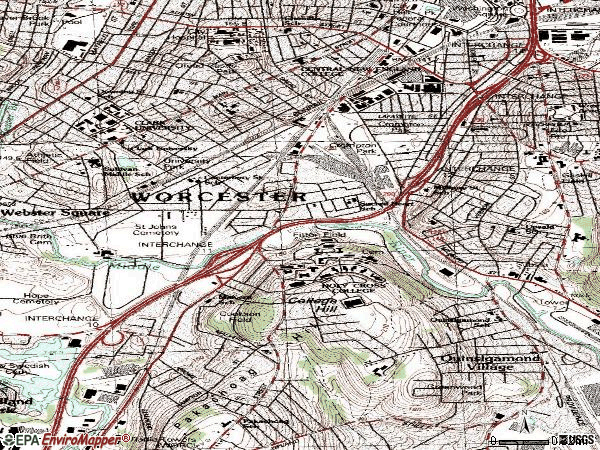
Notable locations in this zip code not listed on our city pages
Notable locations in zip code 01610: Castle Street Row (A), Beacon Street Firehouse (B), Worcester Fire Department McKeon Road Station (C), South Worcester Branch Library (D), Dinand Library (E), Worcester YMCA (F), Cambridge Street Firehouse (G). Display/hide their locations on the map
Churches in zip code 01610 include: South Unitarian Church (A), Saint Peters Catholic Church (B), Pilgrim Congregational Church (C), Iglesia Evangelical Apostolic Church (D), Emmanuel Baptist Church (E), Cornerstone Community Church (F), Church of God of Prophecy (G), Armenian Church of Martyrs (H), Aldergater United Methodist Church (I). Display/hide their locations on the map
Parks in zip code 01610 include: Oread Castle Park (1), Crompton Park (2), View Street Historic District (3), Vernon Hill Playground (4), May Street Historic District (5), Junction Shop and Herman Street Historic District (6), Fitton (7), Cookson Field (8), Crompton Park (9). Display/hide their locations on the map
1,620 married couples with children.
2,785 single-parent households (426 men, 2,359 women).
48.5% of residents of 01610 zip code speak English at home.
33.0% of residents speak Spanish at home (47% very well, 19% well, 22% not well, 13% not at all).
8.8% of residents speak other Indo-European language at home (37% very well, 30% well, 13% not well, 21% not at all).
4.8% of residents speak Asian or Pacific Island language at home (52% very well, 18% well, 22% not well, 8% not at all).
5.6% of residents speak other language at home (76% very well, 19% well, 4% not well, 1% not at all).
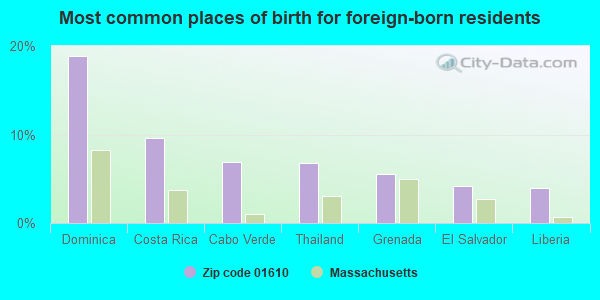
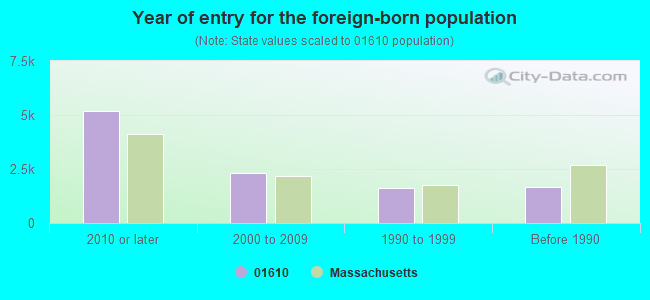
Foreign born population: 7,944 (29.4%) (43.4% of them are naturalized citizens)
Major facilities with environmental interests located in this zip code:
CLARK UNIVERSITY (950 MAIN STREET in WORCESTER, MA)
AIR MAJOR (AIRS/AFS) AIR MONITORING SITE (Airborne pollution emission tracking) ENFORCEMENT/COMPLIANCE ACTIVITY (Integrated Compliance Information System) - ICIS-01-2002-0011, FORMAL ENFORCEMENT ACTION (Integrated Compliance Information System) - ICIS-01-2002-0011, FORMAL ENFORCEMENT ACTION CRITERIA AND HAZARDOUS AIR POLLUTANT INVENTORY (Inventory of air pollution sources) Small Quantity Generators, between 100 kg and 1000 kg of hazardous waste/month (Resource Conservation and Recovery Act (tracking hazardous waste)) - notification Business SIC classification: COLLEGES, UNIVERSITIES, AND PROFESSIONAL SCHOOLS Organizations: TRUSTEES OF CLARK UNIV (CONTACT/OWNER)
BRUSSELS DEVELOPMENT (BRUSSELS STREET in WORCESTER, MA)
AIR MINOR (AIRS/AFS) STATE MASTER (MA-EPICS) - NEI-1180520, AIR PROGRAM CRITERIA AND HAZARDOUS AIR POLLUTANT INVENTORY (Inventory of air pollution sources) Business SIC classification: OPERATORS OF NONRESIDENTIAL BUILDINGS
MASSACHUSETTS ELECTRIC COMPANY (939 SOUTHBRIDGE STREET in WORCESTER, MA)
AIR MINOR (AIRS/AFS) CRITERIA AND HAZARDOUS AIR POLLUTANT INVENTORY (Inventory of air pollution sources) HAZARDOUS WASTE BIENNIAL REPORTER (Resource Conservation and Recovery Act (tracking hazardous waste)) Large Quantity Generators, more that 1000 kg of hazardous waste/month (Resource Conservation and Recovery Act (tracking hazardous waste)) - notification USED OIL PROGRAM (Resource Conservation and Recovery Act (tracking hazardous waste)) Business SIC classification: ELECTRIC SERVICES Business NAICS classification: ELECTRIC POWER DISTRIBUTION. Organizations: NATIONAL GRID (CONTACT/OWNER)
Alternative names: MA ELEC CO CENTRAL DIST HQ
NEW METHOD PLATING C (43 HAMMOND ST. in WORCESTER, MA)
AIR MINOR (AIRS/AFS) CRITERIA AND HAZARDOUS AIR POLLUTANT INVENTORY (Inventory of air pollution sources) HAZARDOUS WASTE BIENNIAL REPORTER (Resource Conservation and Recovery Act (tracking hazardous waste)) Large Quantity Generators, more that 1000 kg of hazardous waste/month (Resource Conservation and Recovery Act (tracking hazardous waste)) - notification TRI REPORTER (Tracking of toxic chemicals releasing facilities) Business SIC and NAICS classification: ELECTROPLATING, PLATING, POLISHING, ANODIZING, AND COLORING Organizations: NEW METHOD PLATING CO. INC. (CONTACT/OPERATOR)
Alternative names: NEW METHOD PLATING CO INC
LUTCO INC (677 CAMBRIDGE ST in WORCESTER, MA)
AIR MINOR (AIRS/AFS) CRITERIA AND HAZARDOUS AIR POLLUTANT INVENTORY (Inventory of air pollution sources) Small Quantity Generators, between 100 kg and 1000 kg of hazardous waste/month (Resource Conservation and Recovery Act (tracking hazardous waste)) - notification TRI REPORTER (Tracking of toxic chemicals releasing facilities) Business SIC classification: METAL STAMPINGS; BALL AND ROLLER BEARINGS Alternative names: LUNDQUIST TOOL & MANUFACTUTING CO. INC., LUNDQUIST TOOL & MFG CO INC, LUNDQUIST TOOL MANUFACTURING
COLLLEGE OF THE HOLY CROSS (ONE COLLEGE ST in WORCESTER, MA)
AIR SYNTHETIC MINOR (AIRS/AFS) CRITERIA AND HAZARDOUS AIR POLLUTANT INVENTORY (Inventory of air pollution sources) Small Quantity Generators, between 100 kg and 1000 kg of hazardous waste/month (Resource Conservation and Recovery Act (tracking hazardous waste)) - notification Business SIC classification: COLLEGES, UNIVERSITIES, AND PROFESSIONAL SCHOOLS Organizations: TRUSTEES COLLEGE OF THE HOLY CROSS (CONTACT/OWNER)
Alternative names: COLLEGE OF THE HOLY CROSS
ANDERSON PRODUCTS (1040 SOUTHBRIDGE ST in WORCESTER, MA)
AIR MINOR (AIRS/AFS) Small Quantity Generators, between 100 kg and 1000 kg of hazardous waste/month (Resource Conservation and Recovery Act (tracking hazardous waste)) - notification Business SIC classification: PRIMARY METAL PRODUCTS Business NAICS classification: SAW BLADE AND HANDSAW MANUFACTURING.; BROOM, BRUSH, AND MOP MANUFACTURING. Organizations: ANDERSON PRODUCTS INC (CONTACT/OWNER)
Alternative names: ANDERSON CORPORATION, DRESSER IND INC ANDERSON DIV
ASTRO WIRE & CABLE CORP (50 GARDNER ST. in WORCESTER, MA)
COMPLIANCE ACTIVITY (Tracking inspections of insecticide, fungicide, and rodenticide, and toxic substances) (Resource Conservation and Recovery Act (tracking hazardous waste)) TRI REPORTER (Tracking of toxic chemicals releasing facilities) Business SIC classification: DRAWING AND INSULATING OF NONFERROUS WIRE Alternative names: ASTRO CABLE CO INCORPORATED
KUSTOM AUTO BODY (72 GARDENER ST in WORCESTER, MA)
(Resource Conservation and Recovery Act (tracking hazardous waste)) Small Quantity Generators, between 100 kg and 1000 kg of hazardous waste/month (Resource Conservation and Recovery Act (tracking hazardous waste)) - notification Organizations: JOHN TROIANO (CONTACT/OWNER)
KILLEEN MACHINE TOOL CO INC (33 HERMON ST in WORCESTER, MA)
AIR MINOR (AIRS/AFS) CRITERIA AND HAZARDOUS AIR POLLUTANT INVENTORY (Inventory of air pollution sources) TRI REPORTER (Tracking of toxic chemicals releasing facilities) Business SIC classification: METAL STAMPINGS; MACHINE TOOLS, METAL FORMING TYPES
1017 SOUTHBRIDGE ASSOCIATES (1017 SOUTHBRIDGE ST in WORCESTER, MA)
AIR MINOR (AIRS/AFS) CRITERIA AND HAZARDOUS AIR POLLUTANT INVENTORY (Inventory of air pollution sources) Business SIC classification: FURNITURE STORES Alternative names: 1017 SUTHBRIDGEASOC
COME PLAY PRODUCTS (51-53 HERMON ST in WORCESTER, MA)
AIR MINOR (AIRS/AFS) CRITERIA AND HAZARDOUS AIR POLLUTANT INVENTORY (Inventory of air pollution sources) Business SIC classification: OPERATORS OF NONRESIDENTIAL BUILDINGS Alternative names: COMEPLAY PRODUCTS, MSF INCORPORATED COMEPLAY
PARKER MFG CO (13 LAMARTINE ST in WORCESTER, MA)
(Resource Conservation and Recovery Act (tracking hazardous waste))
Housing units lacking complete plumbing facilities: 4.8% Housing units lacking complete kitchen facilities: 4.2%
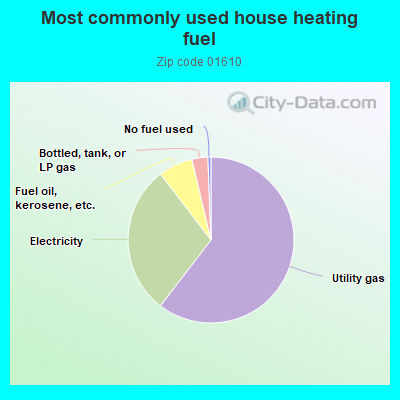
60.5%Utility gas
29.2%Electricity
6.7%Fuel oil, kerosene, etc.
3.1%Bottled, tank, or LP gas
0.6%No fuel used
Population in 1990: 23,720. Population change in the 1990s: +53 (+0.2%).
Place of birth for U.S.-born residents:
This state: 11,362
Northeast: 3,080
Midwest: 445
South: 895
West: 775
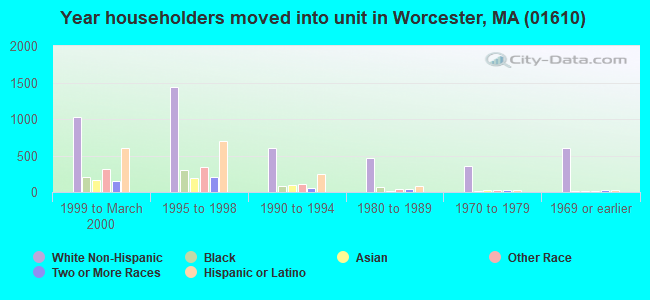
41% of the 01610 zip code residents lived in the same house 5 years ago. Out of people who lived in different houses, 58% lived in this county. Out of people who lived in different counties, 50% lived in Massachusetts.
84% of the 01610 zip code residents lived in the same house 1 year ago. Out of people who lived in different houses, 60% moved from this county. Out of people who lived in different houses, 13% moved from different county within same state. Out of people who lived in different houses, 8% moved from different state. Out of people who lived in different houses, 17% moved from abroad.
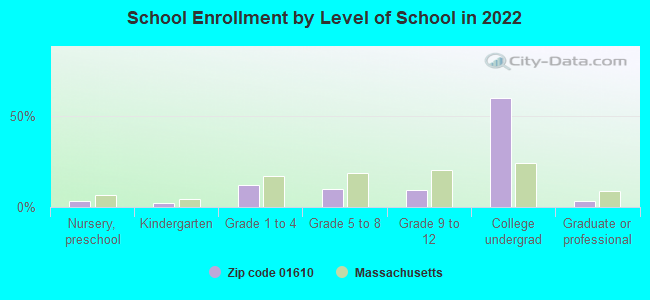
Private vs. public school enrollment:
Students in private schools in grades 1 to 8 (elementary and middle school): 162
Here:
7.0%
Massachusetts:
10.3%
Students in private schools in grades 9 to 12 (high school): 78
Here:
7.9%
Massachusetts:
12.3%
Students in private undergraduate colleges: 5,202
Here:
80.9%
Massachusetts:
51.2%
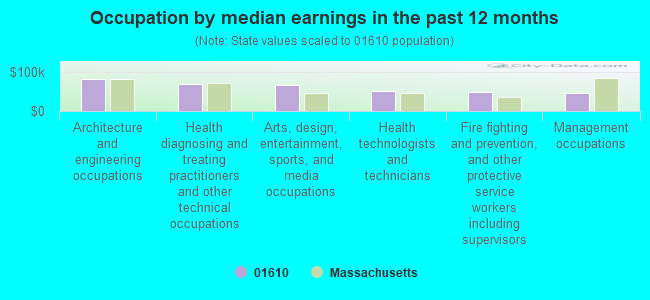
Occupation by median earnings in the past 12 months ($)
81,135Architecture and engineering occupations
69,295Health diagnosing and treating practitioners and other technical occupations
65,056Arts, design, entertainment, sports, and media occupations
50,616Health technologists and technicians
48,210Fire fighting and prevention, and other protective service workers including supervisors
46,596Management occupations
Companies with federal contracts located in this zip code (WORCESTER, MA):
BIGELOW WASTE CO INC (47 HERMON ST) : $1,028,478 in 7 contractsfrom 1999 to 2002
Contracts for Synchros and Resolvers, Motors, Electrical by Army Signed by year:2000: $420,240; 2001: $207,100; 2002: $430,836; 2003: $0; 2004: $0; 2005: $0; 2006: $0.
Biggest contracts:
$257,500 with Army for Synchros and Resolvers. Taking place in NC. Signed on 2000-11-20. Completion date: 2003-05-31.
$217,536, same as above.Signed on 2002-04-08. Completion date: 2003-05-31.
$213,300, same as above.Signed on 2002-01-31. Completion date: 2003-07-17.
$207,100, same as above.Signed on 2001-01-16. Completion date: 2002-07-17.
OXFORD MACHINERY SALES CORP (92 GARDNER ST; small business) : $192,685 in 3 contractsfrom 2004 to 2005
$97,490 with Army for Hydraulic and Pneumatic Presses, Power Driven. Signed on 2004-06-29. Completion date: 2004-08-13.
$65,745 with Army for Punching and Shearing Machines. Signed on 2005-04-25. Completion date: 2005-08-19.
$29,450 with Army for Hydraulic and Pneumatic Presses, Power Driven. Signed on 2004-07-02. Completion date: 2004-08-13.
SANWELD INDUSTRIES (25 SOUTHGATE STREET; small business) : $63,202 in 5 contractsfrom 2002 to 2003
Contracts for Truck and Tractor Attachments by Army Signed by year:2000: $0; 2001: $0; 2002: $31,377; 2003: $31,825; 2004: $0; 2005: $0; 2006: $0.
Biggest contracts:
$31,377 with Army for Truck and Tractor Attachments. Taking place in KS. Signed on 2002-09-09. Completion date: 2002-10-09.
$26,450 with Army for Truck and Tractor Attachments. Signed on 2003-09-10. Completion date: 2003-10-30.
$5,375 with Army for Truck and Tractor Attachments. Taking place in SC. Signed on 2003-06-27. Completion date: 2003-07-28.
$4,620 with Army for Truck and Tractor Attachments. Signed on 2003-05-14. Completion date: 2003-06-06.
PROVIDENCE & WORCESTER RR CO (75 HAMMOND ST) : $29,796 in 6 contractsfrom 2001 to 2006
Contracts for Facilities Operations Support Services by Navy Signed by year:2000: $0; 2001: $4,966; 2002: $0; 2003: $4,966; 2004: $9,932; 2005: $0; 2006: $9,932.
Biggest contracts:
$4,966 with Navy for Facilities Operations Support Services. Taking place in CT. Signed on 2006-02-15. Completion date: 2002-11-30.
$4,966, same as above.Signed on 2006-01-20. Completion date: 2002-11-30.
$4,966, same as above.Signed on 2004-12-07. Completion date: 2002-11-30.
$4,966, same as above.Signed on 2004-06-16. Completion date: 2002-11-30.
Top industries in this zip code by the number of employees in 2005:
Educational Services: Colleges, Universities, and Professional Schools (over 1000 employees: 2 establishments)
Utilities: Electric Power Distribution (100-249: 1, 50-99: 1, 1-4: 1)
Health Care and Social Assistance: Nursing Care Facilities (100-249: 1, 50-99: 1)
2002 - 2018 National Fire Incident Reporting System (NFIRS) incidents
Based on the data from the years 2002 - 2018 the average number of fires per year is 210. The highest number of fires - 438 took place in 2004, and the least - 143 in 2002. The data has a rising trend.
When looking into fire subcategories, the most incidents belonged to: Structure Fires (47.6%), and Outside Fires (24.7%).
Fire incident types reported to NFIRS in Zip Code 01610


 Nearest zip codes: 01608, 01607, 01603, 01604, 01609, 01605.


 Based on the data from the years 2002 - 2018 the average number of fires per year is 210. The highest number of fires - 438 took place in 2004, and the least - 143 in 2002. The data has a rising trend.
 When looking into fire subcategories, the most incidents belonged to: Structure Fires (47.6%), and Outside Fires (24.7%).