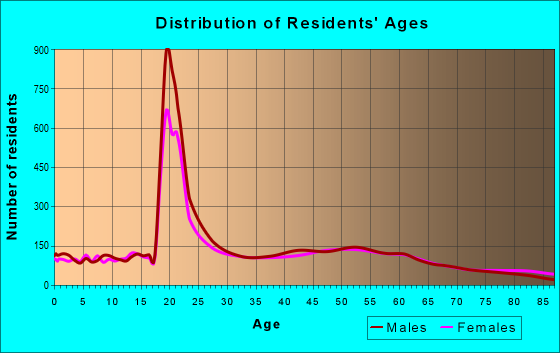
Estimated zip code population in 2022: 23,248 Zip code population in 2010: 22,421 Zip code population in 2000: 21,166
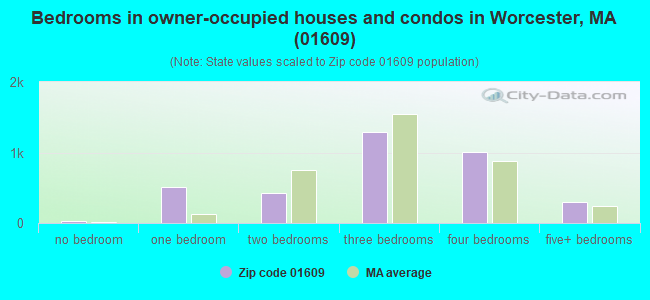
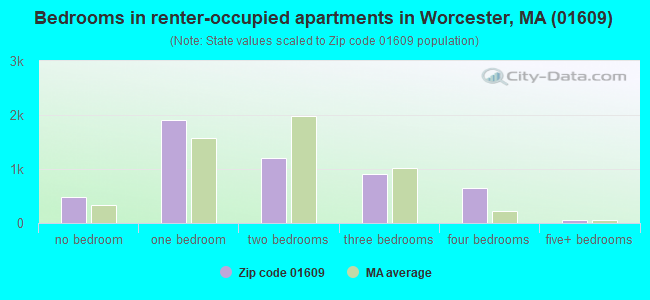
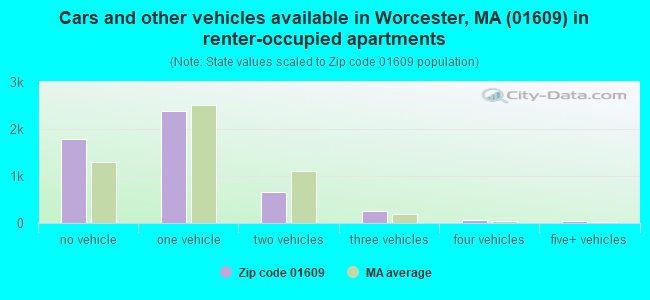
Houses and condos: 9,282 Renter-occupied apartments: 5,197
% of renters here:
60%
State:
38%
March 2022 cost of living index in zip code 01609: 129.9 (high, U.S. average is 100)
Land area: 3.8 sq. mi. Water area: 0.0 sq. mi.
Population density: 6,086 people per square mile
(high).
OSM Map
Google Map
MSN Map
OSM Map
General Map
Google Map
MSN Map
OSM Map
Google Map
MSN Map
OSM Map
Google Map
MSN Map
Please wait while loading the map...
Real estate property taxes paid for housing units in 2022:
This zip code:
1.2% ($4,948)
Massachusetts:
1.0% ($5,536)
Median real estate property taxes paid for housing units with mortgages in 2022: $5,100 (1.1%) Median real estate property taxes paid for housing units with no mortgage in 2022: $4,854 (1.2%)
Averages for the 2020 tax year for zip code 01609, filed in 2021:
Average Adjusted Gross Income (AGI) in 2020: $87,553 (Individual Income Tax Returns)
Here:
$87,553
State:
$105,130
Salary/wage: $63,494 (reported on 82.5% of returns)
Here:
$63,494
State:
$82,951
(% of AGI for various income ranges: 1181.0% for AGIs below $25k, 3777.0% for AGIs $25k-50k, 7085.3% for AGIs $50k-75k, 10304.4% for AGIs $75k-100k, 20292.8% for AGIs $100k-200k, 109580.0% for AGIs over 200k)
Taxable interest for individuals: $2,395 (reported on 33.9% of returns)
This zip code:
$2,395
Massachusetts:
$2,361
(% of AGI for various income ranges: 15.9% for AGIs below $25k, 18.1% for AGIs $25k-50k, 53.1% for AGIs $50k-75k, 117.1% for AGIs $75k-100k, 237.9% for AGIs $100k-200k, 2875.0% for AGIs over 200k)
Ordinary dividends: $13,992 (reported on 21.4% of returns)
Here:
$13,992
State:
$10,365
(% of AGI for various income ranges: 26.8% for AGIs below $25k, 38.8% for AGIs $25k-50k, 111.9% for AGIs $50k-75k, 367.6% for AGIs $75k-100k, 973.8% for AGIs $100k-200k, 11638.6% for AGIs over 200k)
Net capital gain/loss in AGI: +$36,012 (reported on 20.3% of returns)
Here:
+$36,012
State:
+$48,178
(% of AGI for various income ranges: 14.3% for AGIs below $25k, 23.8% for AGIs $25k-50k, 115.8% for AGIs $50k-75k, 329.1% for AGIs $75k-100k, 982.1% for AGIs $100k-200k, 36765.0% for AGIs over 200k)
Profit/loss from business: +$15,053 (reported on 15.6% of returns)
Here:
+$15,053
State:
+$20,792
(% of AGI for various income ranges: 79.5% for AGIs below $25k, 45.3% for AGIs $25k-50k, 179.6% for AGIs $50k-75k, 415.6% for AGIs $75k-100k, 865.1% for AGIs $100k-200k, 7044.3% for AGIs over 200k)
Taxable individual retirement arrangement distribution: $25,241 (reported on 7.9% of returns)
01609:
$25,241
Massachusetts:
$22,790
(% of AGI for various income ranges: 28.9% for AGIs below $25k, 67.4% for AGIs $25k-50k, 211.8% for AGIs $50k-75k, 451.2% for AGIs $75k-100k, 1277.2% for AGIs $100k-200k, 3696.4% for AGIs over 200k)
Self-employed (Keogh) retirement plans: $27,500 (reported on 0.7% of returns)
01609:
$27,500
Massachusetts:
$26,868
(% of AGI for various income ranges: 14.4% for AGIs $25k-50k, 1002.1% for AGIs over 200k)
Total itemized deductions: $34,996 (reported on 10.1% of returns)
Here:
$34,996
State:
$36,722
(% of AGI for various income ranges: 78.4% for AGIs below $25k, 102.8% for AGIs $25k-50k, 379.7% for AGIs $50k-75k, 903.5% for AGIs $75k-100k, 1512.6% for AGIs $100k-200k, 8775.7% for AGIs over 200k)
Charity contributions: $13,401 (reported on 8.5% of returns)
Here:
$13,401
State:
$12,529
(% of AGI for various income ranges: 3.6% for AGIs below $25k, 15.0% for AGIs $25k-50k, 62.6% for AGIs $50k-75k, 127.4% for AGIs $75k-100k, 346.8% for AGIs $100k-200k, 4485.0% for AGIs over 200k)
Taxes paid: $8,420 (reported on 10.1% of returns)
01609:
$8,420
State:
$8,782
(% of AGI for various income ranges: 10.8% for AGIs below $25k, 18.5% for AGIs $25k-50k, 102.5% for AGIs $50k-75k, 296.5% for AGIs $75k-100k, 461.9% for AGIs $100k-200k, 1711.4% for AGIs over 200k)
Earned income credit: $2,004 (reported on 14.1% of returns)
Here:
$2,004
State:
$1,909
(% of AGI for various income ranges: 75.6% for AGIs below $25k, 54.2% for AGIs $25k-50k)
Percentage of individuals using paid preparers for their 2020 taxes: 92.4%
Here:
92%
State:
92%
(% for various income ranges: 90.9% for AGIs below $25k, 93.2% for AGIs $25k-50k, 93.5% for AGIs $50k-75k, 91.2% for AGIs $75k-100k, 92.2% for AGIs $100k-200k, 94.9% for AGIs over 200k)
Averages for the 2012 tax year for zip code 01609, filed in 2013:
Average Adjusted Gross Income (AGI) in 2012: $75,560 (Individual Income Tax Returns)
Here:
$75,560
State:
$81,425
Salary/wage: $54,542 (reported on 83.8% of returns)
Here:
$54,542
State:
$64,752
(% of AGI for various income ranges: 79.7% for AGIs below $25k, 83.0% for AGIs $25k-50k, 71.6% for AGIs $50k-75k, 67.4% for AGIs $75k-100k, 69.9% for AGIs $100k-200k, 44.4% for AGIs over 200k)
Taxable interest for individuals: $2,621 (reported on 36.2% of returns)
This zip code:
$2,621
Massachusetts:
$2,136
(% of AGI for various income ranges: 1.1% for AGIs below $25k, 0.7% for AGIs $25k-50k, 1.4% for AGIs $50k-75k, 1.4% for AGIs $75k-100k, 1.1% for AGIs $100k-200k, 1.4% for AGIs over 200k)
Ordinary dividends: $12,796 (reported on 23.2% of returns)
Here:
$12,796
State:
$9,473
(% of AGI for various income ranges: 1.9% for AGIs below $25k, 1.3% for AGIs $25k-50k, 3.1% for AGIs $50k-75k, 3.1% for AGIs $75k-100k, 2.9% for AGIs $100k-200k, 5.6% for AGIs over 200k)
Net capital gain/loss in AGI: +$24,747 (reported on 20.1% of returns)
Here:
+$24,747
State:
+$31,437
(% of AGI for various income ranges: 0.2% for AGIs $25k-50k, 0.8% for AGIs $50k-75k, 1.4% for AGIs $75k-100k, 2.0% for AGIs $100k-200k, 13.3% for AGIs over 200k)
Profit/loss from business: +$20,700 (reported on 14.5% of returns)
Here:
+$20,700
State:
+$20,662
(% of AGI for various income ranges: 6.8% for AGIs below $25k, 3.4% for AGIs $25k-50k, 4.3% for AGIs $50k-75k, 4.2% for AGIs $75k-100k, 4.4% for AGIs $100k-200k, 3.4% for AGIs over 200k)
Taxable individual retirement arrangement distribution: $24,767 (reported on 10.9% of returns)
01609:
$24,767
Massachusetts:
$18,892
(% of AGI for various income ranges: 2.2% for AGIs below $25k, 2.0% for AGIs $25k-50k, 3.2% for AGIs $50k-75k, 4.8% for AGIs $75k-100k, 4.4% for AGIs $100k-200k, 3.6% for AGIs over 200k)
Self-employment retirement plans: $20,967 (reported on 1.3% of returns)
01609:
$20,967
Massachusetts:
$20,669
(% of AGI for various income ranges: 0.6% for AGIs $25k-50k, 0.3% for AGIs $100k-200k, 0.5% for AGIs over 200k)
Total itemized deductions: $30,832 (18% of AGI, reported on 34.5% of returns)
Here:
$30,832
State:
$28,907
Here:
18.5% of AGI
State:
18.2% of AGI
(% of AGI for various income ranges: 9.3% for AGIs below $25k, 9.9% for AGIs $25k-50k, 15.0% for AGIs $50k-75k, 17.8% for AGIs $75k-100k, 16.7% for AGIs $100k-200k, 13.8% for AGIs over 200k)
Charity contributions: $5,699 (reported on 30.2% of returns)
Here:
$5,699
State:
$4,208
(% of AGI for various income ranges: 0.6% for AGIs below $25k, 0.9% for AGIs $25k-50k, 1.7% for AGIs $50k-75k, 2.0% for AGIs $75k-100k, 2.0% for AGIs $100k-200k, 3.1% for AGIs over 200k)
Taxes paid: $13,952 (reported on 34.4% of returns)
01609:
$13,952
State:
$13,303
(% of AGI for various income ranges: 2.0% for AGIs below $25k, 2.6% for AGIs $25k-50k, 4.9% for AGIs $50k-75k, 7.2% for AGIs $75k-100k, 7.8% for AGIs $100k-200k, 7.4% for AGIs over 200k)
Earned income credit: $2,169 (reported on 19.2% of returns)
Here:
$2,169
State:
$1,971
(% of AGI for various income ranges: 6.8% for AGIs below $25k, 0.9% for AGIs $25k-50k)
Percentage of individuals using paid preparers for their 2012 taxes: 62.3%
Here:
62%
State:
56%
(% for various income ranges: 56.8% for AGIs below $25k, 59.9% for AGIs $25k-50k, 63.3% for AGIs $50k-75k, 68.9% for AGIs $75k-100k, 68.8% for AGIs $100k-200k, 85.1% for AGIs over 200k)
Averages for the 2004 tax year for zip code 01609, filed in 2005:
Average Adjusted Gross Income (AGI) in 2004: $58,799 (Individual Income Tax Returns)
Here:
$58,799
State:
$62,877
Salary/wage: $44,666 (reported on 84.8% of returns)
Here:
$44,666
State:
$52,969
(% of AGI for various income ranges: 116.8% for AGIs below $10k, 82.5% for AGIs $10k-25k, 85.8% for AGIs $25k-50k, 79.0% for AGIs $50k-75k, 73.4% for AGIs $75k-100k, 52.0% for AGIs over 100k)
Taxable interest for individuals: $3,082 (reported on 44.8% of returns)
This zip code:
$3,082
Massachusetts:
$1,945
(% of AGI for various income ranges: 6.2% for AGIs below $10k, 2.6% for AGIs $10k-25k, 1.2% for AGIs $25k-50k, 2.0% for AGIs $50k-75k, 1.8% for AGIs $75k-100k, 2.6% for AGIs over 100k)
Taxable dividends: $9,689 (reported on 26.8% of returns)
Here:
$9,689
State:
$5,323
(% of AGI for various income ranges: 5.5% for AGIs below $10k, 2.6% for AGIs $10k-25k, 1.4% for AGIs $25k-50k, 2.2% for AGIs $50k-75k, 2.6% for AGIs $75k-100k, 6.0% for AGIs over 100k)
Net capital gain/loss: +$17,805 (reported on 23.9% of returns)
Here:
+$17,805
State:
+$20,377
(% of AGI for various income ranges: -2.0% for AGIs below $10k, 0.4% for AGIs $10k-25k, 0.7% for AGIs $25k-50k, 0.8% for AGIs $50k-75k, 1.8% for AGIs $75k-100k, 11.8% for AGIs over 100k)
Profit/loss from business: +$21,813 (reported on 14.0% of returns)
Here:
+$21,813
State:
+$17,837
(% of AGI for various income ranges: 3.8% for AGIs below $10k, 4.7% for AGIs $10k-25k, 3.3% for AGIs $25k-50k, 3.5% for AGIs $50k-75k, 4.6% for AGIs $75k-100k, 6.1% for AGIs over 100k)
IRA payment deduction: $3,360 (reported on 2.2% of returns)
01609:
$3,360
Massachusetts:
$3,100
(% of AGI for various income ranges: 0.2% for AGIs $10k-25k, 0.2% for AGIs $25k-50k, 0.2% for AGIs $50k-75k, 0.2% for AGIs $75k-100k, 0.1% for AGIs over 100k)
Self-employed pension: $18,115 (reported on 1.6% of returns)
Here:
$18,115
Massachusetts:
$14,516
Total itemized deductions: $24,905 (20% of AGI, reported on 35.6% of returns)
Here:
$24,905
State:
$22,573
Here:
19.7% of AGI
State:
19.5% of AGI
(% of AGI for various income ranges: 20.0% for AGIs below $10k, 11.3% for AGIs $10k-25k, 13.0% for AGIs $25k-50k, 17.9% for AGIs $50k-75k, 19.1% for AGIs $75k-100k, 14.9% for AGIs over 100k)
Charity contributions deductions: $5,583 (4% of AGI, reported on 31.3% of returns)
Here:
$5,583
State:
$3,295
Here:
4.0% of AGI
State:
2.7% of AGI
(% of AGI for various income ranges: 0.8% for AGIs below $10k, 1.1% for AGIs $10k-25k, 1.8% for AGIs $25k-50k, 2.0% for AGIs $50k-75k, 2.3% for AGIs $75k-100k, 3.8% for AGIs over 100k)
Total tax: $12,440 (reported on 71.8% of returns)
01609:
$12,440
State:
$11,494
(% of AGI for various income ranges: 3.7% for AGIs below $10k, 4.2% for AGIs $10k-25k, 7.3% for AGIs $25k-50k, 9.9% for AGIs $50k-75k, 11.1% for AGIs $75k-100k, 20.2% for AGIs over 100k)
Earned income credit: $1,645 (reported on 15.1% of returns)
Here:
$1,645
State:
$1,518
Percentage of individuals using paid preparers for their 2004 taxes: 60.7%
Here:
61%
State:
58%
(% for various income ranges: 54.6% for AGIs below $10k, 58.2% for AGIs $10k-25k, 58.0% for AGIs $25k-50k, 62.8% for AGIs $50k-75k, 63.0% for AGIs $75k-100k, 77.5% for AGIs over 100k)
Likely homosexual households (counted as self-reported same-sex unmarried-partner households)
Lesbian couples: 0.0% of all households
Gay men: 0.2% of all households
Household received Food Stamps/SNAP in the past 12 months: 2,537 Household did not receive Food Stamps/SNAP in the past 12 months: 6,398
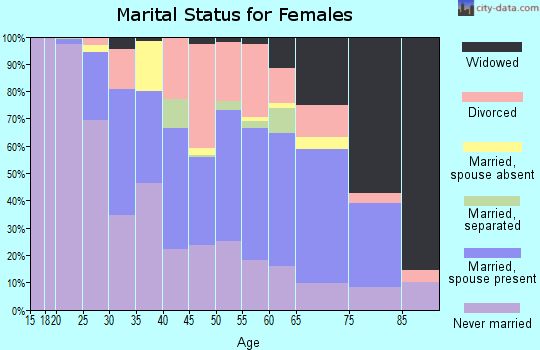
Women who had a birth in the past 12 months: 99 (73 now married, 25 unmarried) Women who did not have a birth in the past 12 months: 6,332 (1,661 now married, 4,712 unmarried)
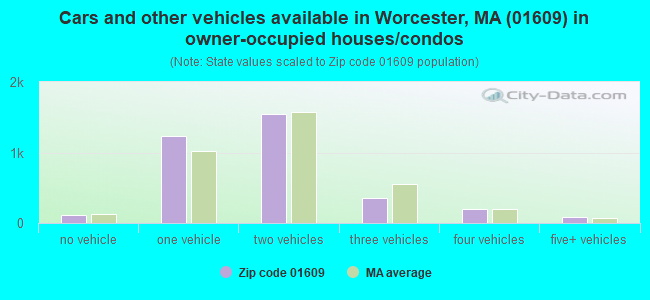
Housing units in zip code 01609 with a mortgage: 2,158 (190 second mortgage, 13 home equity loan, 146 both second mortgage and home equity loan) Houses without a mortgage: 155
Median monthly owner costs for units with a mortgage: $2,520 Median monthly owner costs for units without a mortgage: $1,007
Residents with income below the poverty level in 2022:
This zip code:
22.6%
Whole state:
10.4%
Residents with income below 50% of the poverty level in 2022:
This zip code:
9.5%
Whole state:
5.1%
Median number of rooms in houses and condos:
Here:
6.8
State:
6.5
Median number of rooms in apartments:
Here:
4.0
State:
4.0
Notable locations in this zip code not listed on our city pages
Notable locations in zip code 01609: American Antiquarian Society Library (A), Sister Justina Daley Library (B), Ruska Library (C), Waldo Street Police Station (D), Worcester Art Musuem Library (E), Worcester Art Museum (F), Pleasant Street Firehouse (G), Park Building (H), American Antiquarian Society (I), Harrington Corner (J), Odd Fellows Hall (K), Worcester Art Museum and School (L), Worcester Memorial Auditorium (M). Display/hide their locations on the map
Churches in zip code 01609 include: United Congregational Church (A), Trinity Lutheran Church (B), Temple Sinai (C), Saint Marys Albanian Orthodox Church (D), Park Congregational Church (E), Mount Olive Pentecostal Church (F), First Unitarian Church (G), First Baptist Church (H), The Church of Jesus Christ of Latter Day Saints (I). Display/hide their locations on the map
Parks in zip code 01609 include: Oxford-Crown Historic District (1), Massachusetts Avenue Historic District (2), Lincoln Estate-Elm Park Historic District (3), Institutional District (4), Elm Street Historic District (5). Display/hide their locations on the map
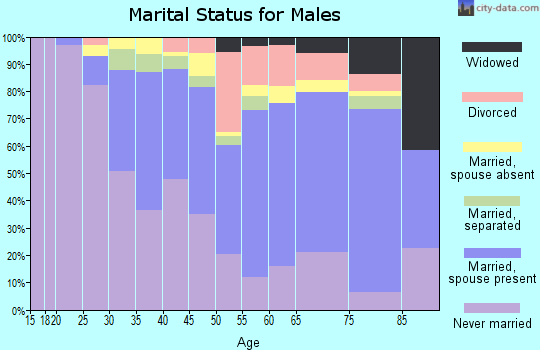
1,333 married couples with children.
689 single-parent households (37 men, 652 women).
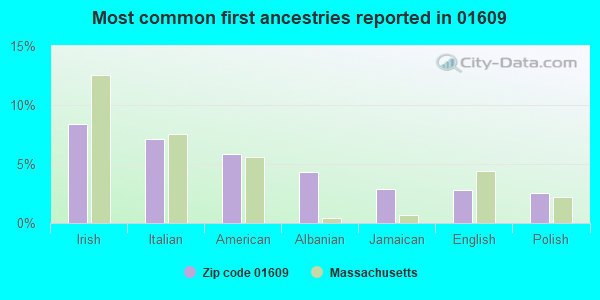
70.2% of residents of 01609 zip code speak English at home.
14.6% of residents speak Spanish at home (50% very well, 25% well, 15% not well, 11% not at all).
7.6% of residents speak other Indo-European language at home (57% very well, 20% well, 17% not well, 5% not at all).
4.5% of residents speak Asian or Pacific Island language at home (72% very well, 26% well, 1% not well).
3.2% of residents speak other language at home (69% very well, 23% well, 8% not well).
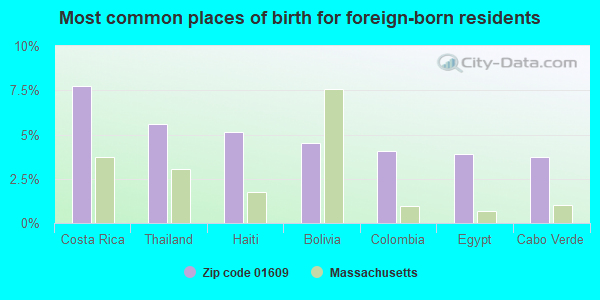
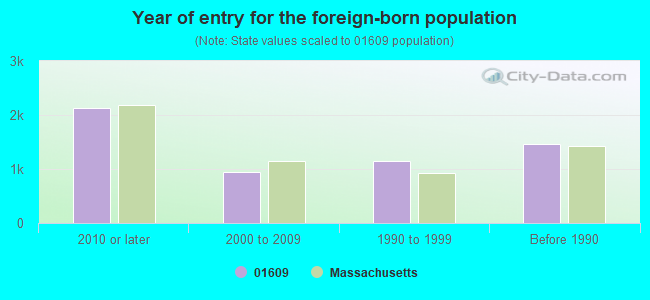
Foreign born population: 4,554 (19.6%) (45.4% of them are naturalized citizens)
Major facilities with environmental interests located in this zip code:
ASSUMPTION COLLEGE (500 SALISBURY ST in WORCESTER, MA)
AIR SYNTHETIC MINOR (AIRS/AFS) ENFORCEMENT/COMPLIANCE ACTIVITY (Integrated Compliance Information System) - ICIS-01-2003-9168, FORMAL ENFORCEMENT ACTION (Integrated Compliance Information System) - ICIS-01-2003-9168, FORMAL ENFORCEMENT ACTION CRITERIA AND HAZARDOUS AIR POLLUTANT INVENTORY (Inventory of air pollution sources) Business SIC classification: COLLEGES, UNIVERSITIES, AND PROFESSIONAL SCHOOLS
COLUMBUS PARK SCHOOL (75 LOVELL ST in WORCESTER, MA)
AIR MINOR (AIRS/AFS) (National Center for Education Statistics) - STATE ID-348060 CRITERIA AND HAZARDOUS AIR POLLUTANT INVENTORY (Inventory of air pollution sources) Business SIC classification: ELEMENTARY AND SECONDARY SCHOOLS Organizations: WORCESTER (SCHOOL DISTRICT)
NORTH HIGH SCHOOL (150 HARRINGTON WAY in WORCESTER, MA)
AIR MINOR (AIRS/AFS) (National Center for Education Statistics) - STATE ID-348515 CRITERIA AND HAZARDOUS AIR POLLUTANT INVENTORY (Inventory of air pollution sources) Business SIC classification: ELEMENTARY AND SECONDARY SCHOOLS Organizations: WORCESTER (SCHOOL DISTRICT)
ELM PARK COMMUNITY (23 NORTH ASHLAND STREET in WORCESTER, MA)
(National Center for Education Statistics) - STATE ID-348095 Organizations: WORCESTER (SCHOOL DISTRICT)
MA ACADEMY FOR MATH AND SCIENC (100 INSTITUTE RD in WORCESTER, MA)
(National Center for Education Statistics) - STATE ID-468505 Organizations: MA ACADEMY/MATH & SCIENCE (SCHOOL DISTRICT)
AMERICAN REMEDIATION TECHNOLOGIES LLC (6 PULLMAN ST in WORCESTER, MA)
(Resource Conservation and Recovery Act (tracking hazardous waste)) Business NAICS classification: CONSTRUCTION SAND AND GRAVEL MINING. Organizations: CORNELIUS J LUCEY JR (CONTACT/OWNER)
AUTOZONE #5013 (248 PARK AVE in WORCESTER, MA)
(Resource Conservation and Recovery Act (tracking hazardous waste)) Organizations: RITE AID CORPORATION (CONTACT/OWNER)
Alternative names: AMERICAN DISCOUNT AUTO PARTS
CANTERBURY TOWERS (6 WACHUSETT ST in WORCESTER, MA)
AIR MINOR (AIRS/AFS) CRITERIA AND HAZARDOUS AIR POLLUTANT INVENTORY (Inventory of air pollution sources) Business SIC classification: OPERATORS OF APARTMENT BUILDINGS
CIOCIOLO CORP DBA MARKS SERVICE STATION (102 HIGHLAND ST in WORCESTER, MA)
(Resource Conservation and Recovery Act (tracking hazardous waste)) Organizations: SUNOCO SERVICE STATION (CONTACT/OWNER)
Alternative names: MARK'S SERVICE CENTER, SUNOCO SERVICE STA
COLUMBIA SERVICES INC (455 PLEASANT ST in WORCESTER, MA)
(Resource Conservation and Recovery Act (tracking hazardous waste))
ALLAIRES POWER EQUIPMENT (41 CHANDLER ST in WORCESTER, MA)
(Resource Conservation and Recovery Act (tracking hazardous waste)) Business NAICS classification: GENERAL AUTOMOTIVE REPAIR.
LEX COMPANY (1 DIX ST in WORCESTER, MA)
Small Quantity Generators, between 100 kg and 1000 kg of hazardous waste/month (Resource Conservation and Recovery Act (tracking hazardous waste)) - notification Organizations: JAMES GLICKMAN (CONTACT/OWNER)
, LECH W DUDYCZ (CONTACT/OWNER)
MA TRANSPORT INC (12 MASON ST in WORCESTER, MA)
(Resource Conservation and Recovery Act (tracking hazardous waste)) Business NAICS classification: TIRE RETREADING. Organizations: MASS TRANSPORT INC (CONTACT/OWNER)
Housing units lacking complete plumbing facilities: 1.5% Housing units lacking complete kitchen facilities: 2.4%
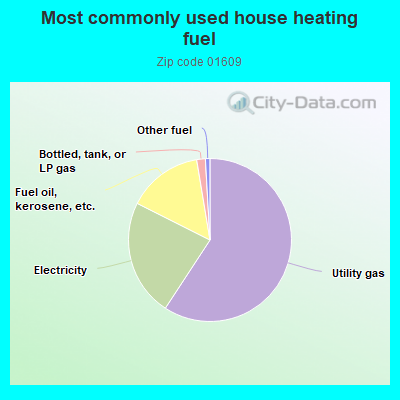
59.0%Utility gas
23.1%Electricity
14.9%Fuel oil, kerosene, etc.
1.7%Bottled, tank, or LP gas
0.9%Other fuel
Population in 1990: 21,905.
Place of birth for U.S.-born residents:
This state: 11,807
Northeast: 3,905
Midwest: 437
South: 747
West: 695
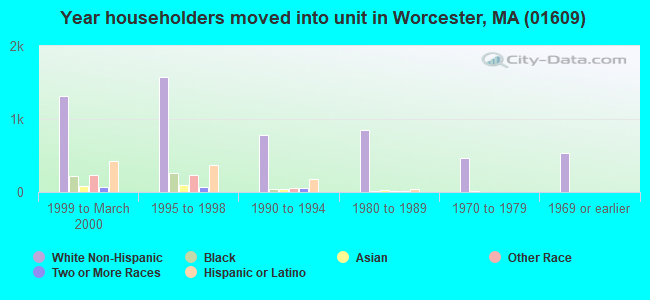
46% of the 01609 zip code residents lived in the same house 5 years ago. Out of people who lived in different houses, 53% lived in this county. Out of people who lived in different counties, 50% lived in Massachusetts.
84% of the 01609 zip code residents lived in the same house 1 year ago. Out of people who lived in different houses, 63% moved from this county. Out of people who lived in different houses, 15% moved from different county within same state. Out of people who lived in different houses, 8% moved from different state. Out of people who lived in different houses, 9% moved from abroad.
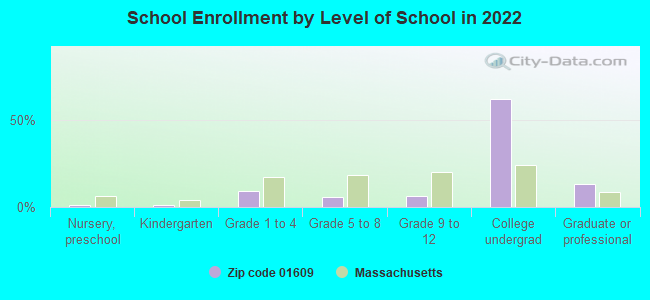
Private vs. public school enrollment:
Students in private schools in grades 1 to 8 (elementary and middle school): 147
Here:
10.6%
Massachusetts:
10.3%
Students in private schools in grades 9 to 12 (high school): 106
Here:
17.5%
Massachusetts:
12.3%
Students in private undergraduate colleges: 4,636
Here:
78.1%
Massachusetts:
51.2%
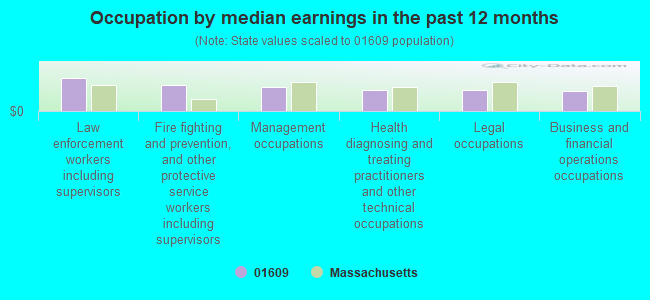
Occupation by median earnings in the past 12 months ($)
118,663Law enforcement workers including supervisors
91,069Fire fighting and prevention, and other protective service workers including supervisors
85,267Management occupations
75,533Health diagnosing and treating practitioners and other technical occupations
75,156Legal occupations
71,005Business and financial operations occupations
Companies with federal contracts located in this zip code:
CUTLER ASSOCIATES INC (43 HARVARD ST in WORCESTER, MA) : $13,076,333 in 8 contractsfrom 2004 to 2006
Contracts for Construction of Structures and Facilities -- Other Administrative Facilities and Service Buildings by Army Signed by year:2000: $0; 2001: $0; 2002: $0; 2003: $0; 2004: $12,747,497; 2005: -$102,103; 2006: $430,939.
Biggest contracts:
$10,728,320 with Army for Construction of Structures and Facilities -- Other Administrative Facilities and Service Buildings. Signed on 2004-09-27. Completion date: 2006-04-28.
$2,019,177, same as above.Signed on 2004-09-27. Completion date: 2006-04-28.
$178,189, same as above.Signed on 2006-06-15. Completion date: 2006-04-28.
$173,454, same as above.Signed on 2006-05-04. Completion date: 2006-04-28.
ANEPTEK CORPORATION (408 PLEASANT STREET, 2ND F in WORCESTER, MA; small business) : $899,106 in 4 contractsfrom 2000 to 2003
$812,211 with Army for Other Architect and Engineering Services. Taking place in CT. Signed on 2000-03-30. Completion date: 2000-04-30.
$40,800 with Bureau of Land Management for Other Professional Services. Taking place in CA. Signed on 2003-09-15. Completion date: 2003-11-15.
$28,515 with Army for Other Environmental Services, Studies, and Analytical Support. Taking place in MD. Signed on 2003-09-30. Completion date: 2004-06-26.
$17,580, same as above.Signed on 2003-09-25. Completion date: 2004-12-31.
JM ENVIRONMENTAL CORP , INC (71 ELM STREET in WORCESTER, MA; small business)
$6,125 with Army for Construction of Structures and Facilities -- Fuel Storage Buildings. Signed on 2004-08-19. Completion date: 2004-09-18.
Top industries in this zip code by the number of employees in 2005:
Educational Services: Other Technical and Trade Schools (over 1000 employees: 1 establishment)
2002 - 2018 National Fire Incident Reporting System (NFIRS) incidents
Based on the data from the years 2002 - 2018 the average number of fires per year is 229. The highest number of fires - 520 took place in 2004, and the least - 172 in 2005. The data has a rising trend.
When looking into fire subcategories, the most incidents belonged to: Structure Fires (57.2%), and Other (23.5%).
Fire incident types reported to NFIRS in Zip Code 01609


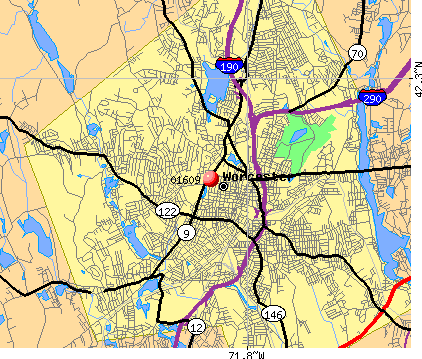 Nearest zip codes: 01602, 01608, 01605, 01603, 01610, 01606.


 Based on the data from the years 2002 - 2018 the average number of fires per year is 229. The highest number of fires - 520 took place in 2004, and the least - 172 in 2005. The data has a rising trend.
 When looking into fire subcategories, the most incidents belonged to: Structure Fires (57.2%), and Other (23.5%).