Estimated zip code population in 2022: 22,628 Zip code population in 2010: 19,077 Zip code population in 2000: 19,911
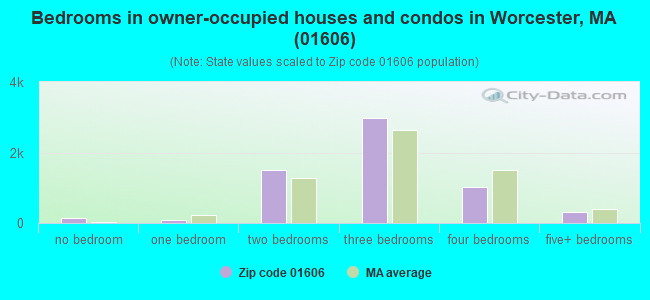
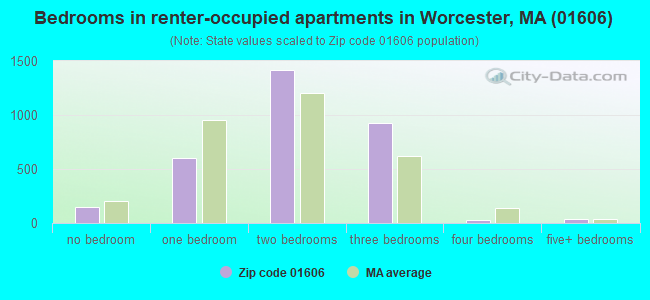
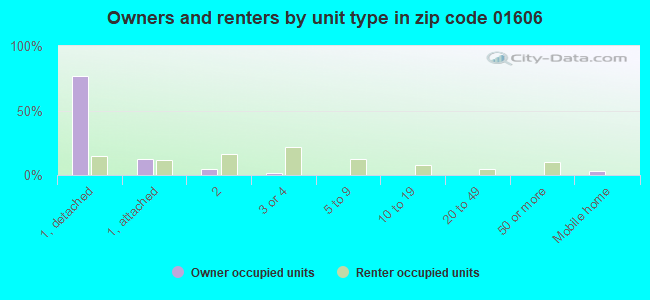
Houses and condos: 9,667 Renter-occupied apartments: 3,159
% of renters here:
34%
State:
38%
March 2022 cost of living index in zip code 01606: 126.1 (high, U.S. average is 100)
Land area: 5.9 sq. mi. Water area: 0.0 sq. mi.
Population density: 3,816 people per square mile
(average).
OSM Map
Google Map
MSN Map
OSM Map
General Map
Google Map
MSN Map
OSM Map
Google Map
MSN Map
OSM Map
Google Map
MSN Map
Please wait while loading the map...
Real estate property taxes paid for housing units in 2022:
This zip code:
1.3% ($4,306)
Massachusetts:
1.0% ($5,536)
Median real estate property taxes paid for housing units with mortgages in 2022: $4,370 (1.2%) Median real estate property taxes paid for housing units with no mortgage in 2022: $4,125 (1.5%)
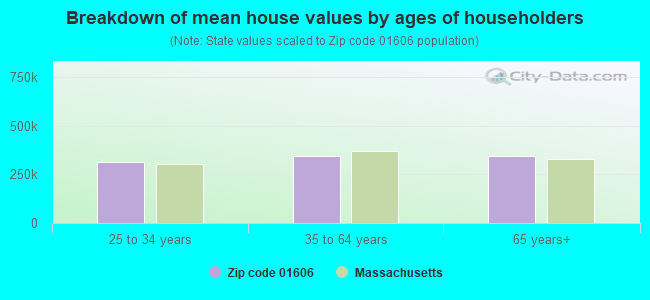
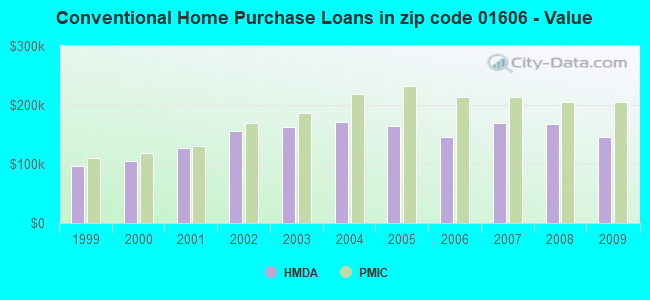
Estimated median house/condo value in 2022: $336,135
01606:
$336,135
Massachusetts:
$534,700
According to our research of Massachusetts and other state lists, there were 12 registered sex offenders living in 01606 zip code as of April 27, 2024. The ratio of all residents to sex offenders in zip code 01606 is 1,628 to 1. The ratio of registered sex offenders to all residents in this zip code is near the state average.
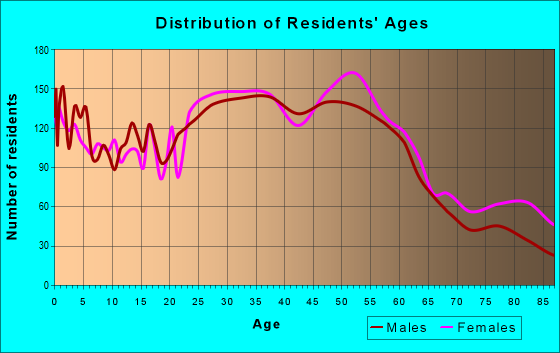
Median resident age:
This zip code:
40.4 years
Massachusetts median age:
40.3 years
Average household size:
This zip code:
2.4 people
Massachusetts:
2.4 people
Averages for the 2020 tax year for zip code 01606, filed in 2021:
Average Adjusted Gross Income (AGI) in 2020: $64,200 (Individual Income Tax Returns)
Here:
$64,200
State:
$105,130
Salary/wage: $58,641 (reported on 83.5% of returns)
Here:
$58,641
State:
$82,951
(% of AGI for various income ranges: 1155.4% for AGIs below $25k, 3565.9% for AGIs $25k-50k, 6683.7% for AGIs $50k-75k, 9879.5% for AGIs $75k-100k, 18442.4% for AGIs $100k-200k, 56792.7% for AGIs over 200k)
Taxable interest for individuals: $727 (reported on 34.7% of returns)
This zip code:
$727
Massachusetts:
$2,361
(% of AGI for various income ranges: 16.7% for AGIs below $25k, 15.9% for AGIs $25k-50k, 31.6% for AGIs $50k-75k, 45.1% for AGIs $75k-100k, 91.2% for AGIs $100k-200k, 297.3% for AGIs over 200k)
Ordinary dividends: $2,987 (reported on 16.5% of returns)
Here:
$2,987
State:
$10,365
(% of AGI for various income ranges: 22.3% for AGIs below $25k, 28.3% for AGIs $25k-50k, 52.9% for AGIs $50k-75k, 95.7% for AGIs $75k-100k, 170.8% for AGIs $100k-200k, 944.5% for AGIs over 200k)
Net capital gain/loss in AGI: +$9,299 (reported on 14.6% of returns)
Here:
+$9,299
State:
+$48,178
(% of AGI for various income ranges: 8.3% for AGIs below $25k, 23.2% for AGIs $25k-50k, 43.2% for AGIs $50k-75k, 98.2% for AGIs $75k-100k, 360.0% for AGIs $100k-200k, 8544.5% for AGIs over 200k)
Profit/loss from business: +$10,830 (reported on 13.1% of returns)
Here:
+$10,830
State:
+$20,792
(% of AGI for various income ranges: 111.2% for AGIs below $25k, 144.9% for AGIs $25k-50k, 155.2% for AGIs $50k-75k, 198.8% for AGIs $75k-100k, 441.4% for AGIs $100k-200k, 1658.2% for AGIs over 200k)
Taxable individual retirement arrangement distribution: $16,487 (reported on 8.8% of returns)
01606:
$16,487
Massachusetts:
$22,790
(% of AGI for various income ranges: 71.1% for AGIs below $25k, 88.8% for AGIs $25k-50k, 194.6% for AGIs $50k-75k, 310.9% for AGIs $75k-100k, 424.7% for AGIs $100k-200k, 2464.5% for AGIs over 200k)
Self-employed (Keogh) retirement plans: $8,950 (reported on 0.4% of returns)
01606:
$8,950
Massachusetts:
$26,868
(% of AGI for various income ranges: 34.4% for AGIs $100k-200k)
Total itemized deductions: $25,004 (reported on 10.3% of returns)
Here:
$25,004
State:
$36,722
(% of AGI for various income ranges: 95.4% for AGIs below $25k, 128.2% for AGIs $25k-50k, 450.8% for AGIs $50k-75k, 655.3% for AGIs $75k-100k, 795.4% for AGIs $100k-200k, 2691.8% for AGIs over 200k)
Charity contributions: $4,843 (reported on 7.8% of returns)
Here:
$4,843
State:
$12,529
(% of AGI for various income ranges: 4.1% for AGIs below $25k, 17.7% for AGIs $25k-50k, 57.6% for AGIs $50k-75k, 86.5% for AGIs $75k-100k, 147.6% for AGIs $100k-200k, 510.9% for AGIs over 200k)
Taxes paid: $7,601 (reported on 10.3% of returns)
01606:
$7,601
State:
$8,782
(% of AGI for various income ranges: 13.1% for AGIs below $25k, 27.1% for AGIs $25k-50k, 134.2% for AGIs $50k-75k, 242.6% for AGIs $75k-100k, 280.8% for AGIs $100k-200k, 637.3% for AGIs over 200k)
Earned income credit: $1,827 (reported on 10.1% of returns)
Here:
$1,827
State:
$1,909
(% of AGI for various income ranges: 56.5% for AGIs below $25k, 46.3% for AGIs $25k-50k)
Percentage of individuals using paid preparers for their 2020 taxes: 91.6%
Here:
92%
State:
92%
(% for various income ranges: 89.1% for AGIs below $25k, 92.0% for AGIs $25k-50k, 92.2% for AGIs $50k-75k, 91.9% for AGIs $75k-100k, 93.3% for AGIs $100k-200k, 93.5% for AGIs over 200k)
Averages for the 2012 tax year for zip code 01606, filed in 2013:
Average Adjusted Gross Income (AGI) in 2012: $52,441 (Individual Income Tax Returns)
Here:
$52,441
State:
$81,425
Salary/wage: $49,691 (reported on 85.8% of returns)
Here:
$49,691
State:
$64,752
(% of AGI for various income ranges: 71.7% for AGIs below $25k, 82.8% for AGIs $25k-50k, 82.2% for AGIs $50k-75k, 83.2% for AGIs $75k-100k, 84.1% for AGIs $100k-200k, 67.1% for AGIs over 200k)
Taxable interest for individuals: $753 (reported on 36.4% of returns)
This zip code:
$753
Massachusetts:
$2,136
(% of AGI for various income ranges: 1.1% for AGIs below $25k, 0.6% for AGIs $25k-50k, 0.5% for AGIs $50k-75k, 0.5% for AGIs $75k-100k, 0.4% for AGIs $100k-200k, 0.6% for AGIs over 200k)
Ordinary dividends: $2,532 (reported on 17.2% of returns)
Here:
$2,532
State:
$9,473
(% of AGI for various income ranges: 1.6% for AGIs below $25k, 0.7% for AGIs $25k-50k, 0.7% for AGIs $50k-75k, 0.7% for AGIs $75k-100k, 0.7% for AGIs $100k-200k, 1.9% for AGIs over 200k)
Net capital gain/loss in AGI: +$2,152 (reported on 11.9% of returns)
Here:
+$2,152
State:
+$31,437
(% of AGI for various income ranges: 0.2% for AGIs $50k-75k, 0.3% for AGIs $75k-100k, 0.7% for AGIs $100k-200k, 3.6% for AGIs over 200k)
Profit/loss from business: +$11,746 (reported on 10.4% of returns)
Here:
+$11,746
State:
+$20,662
(% of AGI for various income ranges: 6.5% for AGIs below $25k, 2.4% for AGIs $25k-50k, 1.5% for AGIs $50k-75k, 2.0% for AGIs $75k-100k, 2.4% for AGIs $100k-200k)
Taxable individual retirement arrangement distribution: $11,422 (reported on 9.5% of returns)
01606:
$11,422
Massachusetts:
$18,892
(% of AGI for various income ranges: 4.1% for AGIs below $25k, 2.0% for AGIs $25k-50k, 2.0% for AGIs $50k-75k, 1.7% for AGIs $75k-100k, 2.2% for AGIs $100k-200k)
Self-employment retirement plans: $17,600 (reported on 0.3% of returns)
01606:
$17,600
Massachusetts:
$20,669
Total itemized deductions: $18,389 (22% of AGI, reported on 38.2% of returns)
Here:
$18,389
State:
$28,907
Here:
21.6% of AGI
State:
18.2% of AGI
(% of AGI for various income ranges: 11.0% for AGIs below $25k, 10.8% for AGIs $25k-50k, 14.3% for AGIs $50k-75k, 15.1% for AGIs $75k-100k, 14.5% for AGIs $100k-200k, 10.9% for AGIs over 200k)
Charity contributions: $1,984 (reported on 30.4% of returns)
Here:
$1,984
State:
$4,208
(% of AGI for various income ranges: 0.7% for AGIs below $25k, 0.8% for AGIs $25k-50k, 1.3% for AGIs $50k-75k, 1.2% for AGIs $75k-100k, 1.3% for AGIs $100k-200k, 1.3% for AGIs over 200k)
Taxes paid: $7,271 (reported on 38.1% of returns)
01606:
$7,271
State:
$13,303
(% of AGI for various income ranges: 2.4% for AGIs below $25k, 3.1% for AGIs $25k-50k, 5.2% for AGIs $50k-75k, 6.0% for AGIs $75k-100k, 6.8% for AGIs $100k-200k, 6.1% for AGIs over 200k)
Earned income credit: $1,943 (reported on 13.0% of returns)
Here:
$1,943
State:
$1,971
(% of AGI for various income ranges: 4.6% for AGIs below $25k, 0.7% for AGIs $25k-50k)
Percentage of individuals using paid preparers for their 2012 taxes: 54.6%
Here:
55%
State:
56%
(% for various income ranges: 52.1% for AGIs below $25k, 51.1% for AGIs $25k-50k, 56.3% for AGIs $50k-75k, 60.2% for AGIs $75k-100k, 60.2% for AGIs $100k-200k, 72.7% for AGIs over 200k)
Averages for the 2004 tax year for zip code 01606, filed in 2005:
Average Adjusted Gross Income (AGI) in 2004: $44,985 (Individual Income Tax Returns)
Here:
$44,985
State:
$62,877
Salary/wage: $43,620 (reported on 84.8% of returns)
Here:
$43,620
State:
$52,969
(% of AGI for various income ranges: 78.4% for AGIs below $10k, 69.8% for AGIs $10k-25k, 84.7% for AGIs $25k-50k, 84.1% for AGIs $50k-75k, 86.6% for AGIs $75k-100k, 78.7% for AGIs over 100k)
Taxable interest for individuals: $1,054 (reported on 52.9% of returns)
This zip code:
$1,054
Massachusetts:
$1,945
(% of AGI for various income ranges: 4.6% for AGIs below $10k, 2.7% for AGIs $10k-25k, 1.1% for AGIs $25k-50k, 1.3% for AGIs $50k-75k, 0.7% for AGIs $75k-100k, 1.1% for AGIs over 100k)
Taxable dividends: $1,927 (reported on 21.9% of returns)
Here:
$1,927
State:
$5,323
(% of AGI for various income ranges: 2.5% for AGIs below $10k, 1.6% for AGIs $10k-25k, 0.8% for AGIs $25k-50k, 0.7% for AGIs $50k-75k, 0.5% for AGIs $75k-100k, 1.3% for AGIs over 100k)
Net capital gain/loss: +$5,065 (reported on 16.6% of returns)
Here:
+$5,065
State:
+$20,377
(% of AGI for various income ranges: -1.4% for AGIs below $10k, 0.4% for AGIs $10k-25k, 0.2% for AGIs $25k-50k, 0.4% for AGIs $50k-75k, 0.7% for AGIs $75k-100k, 6.5% for AGIs over 100k)
Profit/loss from business: +$11,434 (reported on 11.4% of returns)
Here:
+$11,434
State:
+$17,837
(% of AGI for various income ranges: 8.1% for AGIs below $10k, 5.7% for AGIs $10k-25k, 1.8% for AGIs $25k-50k, 2.3% for AGIs $50k-75k, 2.8% for AGIs $75k-100k, 3.4% for AGIs over 100k)
IRA payment deduction: $2,708 (reported on 2.0% of returns)
01606:
$2,708
Massachusetts:
$3,100
(% of AGI for various income ranges: 0.2% for AGIs $10k-25k, 0.2% for AGIs $25k-50k, 0.1% for AGIs $50k-75k, 0.1% for AGIs $75k-100k, 0.1% for AGIs over 100k)
Self-employed pension: $7,206 (reported on 0.7% of returns)
Here:
$7,206
Massachusetts:
$14,516
(% of AGI for various income ranges: 0.1% for AGIs $10k-25k, 0.1% for AGIs $50k-75k, 0.2% for AGIs $75k-100k, 0.2% for AGIs over 100k)
Total itemized deductions: $16,179 (23% of AGI, reported on 41.4% of returns)
Here:
$16,179
State:
$22,573
Here:
23.5% of AGI
State:
19.5% of AGI
(% of AGI for various income ranges: 15.3% for AGIs below $10k, 13.6% for AGIs $10k-25k, 13.4% for AGIs $25k-50k, 16.0% for AGIs $50k-75k, 16.5% for AGIs $75k-100k, 14.5% for AGIs over 100k)
Charity contributions deductions: $1,834 (3% of AGI, reported on 37.1% of returns)
Here:
$1,834
State:
$3,295
Here:
2.6% of AGI
State:
2.7% of AGI
(% of AGI for various income ranges: 0.9% for AGIs below $10k, 1.1% for AGIs $10k-25k, 1.4% for AGIs $25k-50k, 1.4% for AGIs $50k-75k, 1.6% for AGIs $75k-100k, 1.8% for AGIs over 100k)
Total tax: $5,636 (reported on 81.5% of returns)
01606:
$5,636
State:
$11,494
(% of AGI for various income ranges: 2.7% for AGIs below $10k, 4.5% for AGIs $10k-25k, 7.8% for AGIs $25k-50k, 9.5% for AGIs $50k-75k, 10.7% for AGIs $75k-100k, 15.2% for AGIs over 100k)
Earned income credit: $1,440 (reported on 9.0% of returns)
Here:
$1,440
State:
$1,518
Percentage of individuals using paid preparers for their 2004 taxes: 56.7%
Here:
57%
State:
58%
(% for various income ranges: 46.7% for AGIs below $10k, 57.8% for AGIs $10k-25k, 55.1% for AGIs $25k-50k, 61.0% for AGIs $50k-75k, 63.4% for AGIs $75k-100k, 61.5% for AGIs over 100k)
Likely homosexual households (counted as self-reported same-sex unmarried-partner households)
Lesbian couples: 0.2% of all households
Gay men: 0.1% of all households
Household received Food Stamps/SNAP in the past 12 months: 1,483 Household did not receive Food Stamps/SNAP in the past 12 months: 7,733
Women who had a birth in the past 12 months: 206 (172 now married, 36 unmarried) Women who did not have a birth in the past 12 months: 5,171 (1,857 now married, 3,316 unmarried)
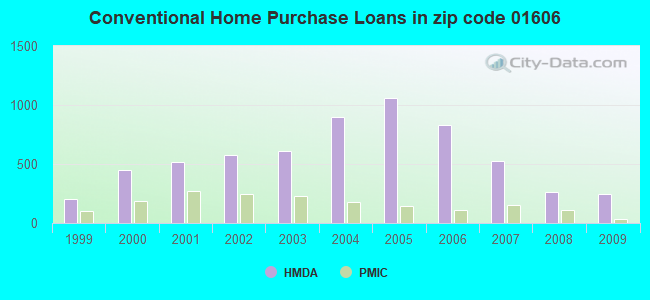
Housing units in zip code 01606 with a mortgage: 3,875 (510 second mortgage, 14 home equity loan, 362 both second mortgage and home equity loan) Houses without a mortgage: 81
Median monthly owner costs for units with a mortgage: $1,936 Median monthly owner costs for units without a mortgage: $758
Residents with income below the poverty level in 2022:
This zip code:
10.8%
Whole state:
10.4%
Residents with income below 50% of the poverty level in 2022:
This zip code:
5.3%
Whole state:
5.1%
Median number of rooms in houses and condos:
Here:
6.1
State:
6.5
Median number of rooms in apartments:
Here:
4.6
State:
4.0
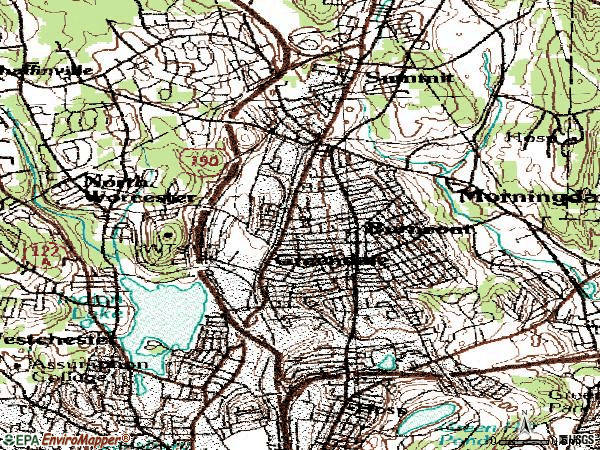
Notable locations in this zip code not listed on our city pages
Notable locations in zip code 01606: Higgins Industrial Park (A), Indian Hill-North Village (B), Worcester Country Club (C), Worcester Fire Department Greendale Station (D), Burncoat High School Library (E), Worcester County Jail and House of Corrections Library (F), Worcester County Jail and House of Corrections (G), Quinsigamond Community College Learning Resources Center (H), Odd Fellows Home (I), Higgins Armory Mueseum Memorial Library (J), Higgins Armory Museum (K), Greendale Branch Library (L). Display/hide their locations on the map
Churches in zip code 01606 include: Zion Lutheran Church (A), Unitarian Universalist Church (B), Saint Michaels on-the-Heights Church (C), Saint Johns Episcopal Church (D), Our Lady of the Rosary Church (E), Heritage Baptist Church (F), Greendale People Church (G), First Presbyterian Church (H), Burncoat Baptist Church (I). Display/hide their locations on the map
In group quarters: 509 (-1 institutionalized population)
Size of family households: 1,873 2-persons, 1,277 3-persons, 1,056 4-persons, 372 5-persons, 446 6-persons, 134 7-or-more-persons
Size of nonfamily households: 3,295 1-person, 663 2-persons, 90 3-persons
2,758 married couples with children.
1,206 single-parent households (287 men, 919 women).
73.9% of residents of 01606 zip code speak English at home.
10.9% of residents speak Spanish at home (51% very well, 17% well, 24% not well, 8% not at all).
6.2% of residents speak other Indo-European language at home (60% very well, 21% well, 16% not well, 2% not at all).
4.1% of residents speak Asian or Pacific Island language at home (54% very well, 19% well, 26% not well).
4.7% of residents speak other language at home (95% very well, 3% well, 3% not well).
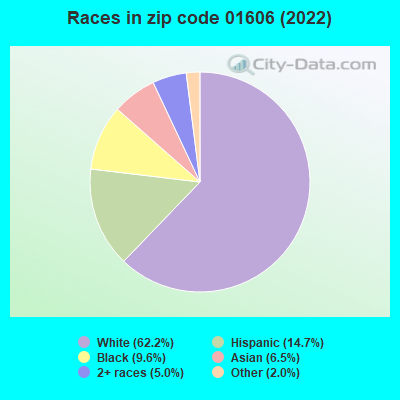
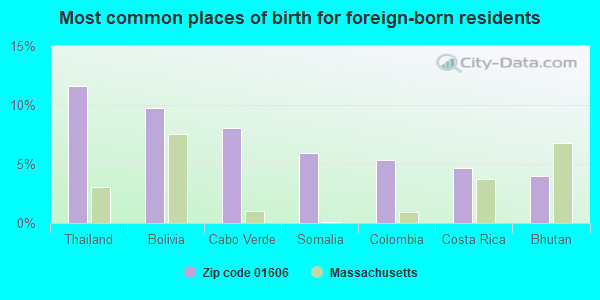
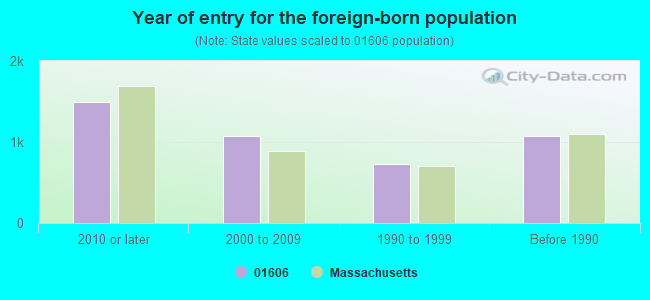
Foreign born population: 3,274 (14.5%) (62.5% of them are naturalized citizens)
Major facilities with environmental interests located in this zip code:
ALLEGRO MICROSYSTEMS (115 NORTHEAST CUTOFF in WORCESTER, MA)
AIR SYNTHETIC MINOR (AIRS/AFS) - ICIS-, ENFORCEMENT/COMPLIANCE ACTIVITY ENFORCEMENT/COMPLIANCE ACTIVITY (Integrated Compliance Information System) - ICIS-01-1995-0031, FORMAL ENFORCEMENT ACTION (Integrated Compliance Information System) - ICIS-01-1995-0031, FORMAL ENFORCEMENT ACTION CRITERIA AND HAZARDOUS AIR POLLUTANT INVENTORY (Inventory of air pollution sources) HAZARDOUS WASTE BIENNIAL REPORTER (Resource Conservation and Recovery Act (tracking hazardous waste)) Large Quantity Generators, more that 1000 kg of hazardous waste/month (Resource Conservation and Recovery Act (tracking hazardous waste)) - notification TRI REPORTER (Tracking of toxic chemicals releasing facilities) Business SIC classification: SEMICONDUCTORS AND RELATED DEVICES; ELECTRONIC CAPACITORS; ELECTRONIC COMPONENTS Business NAICS classification: COMPUTER TERMINAL MANUFACTURING.; SEMICONDUCTOR AND RELATED DEVICE MANUFACTURING. Organizations: ALLEGRO MICROSYSTEMS, INC. (CONTACT/OPERATOR)
Alternative names: ALLEGRO MICROSYSTEMS INC.
KOM TEK TECHNOLOGIES (40 ROCKDALE ST. in WORCESTER, MA)
AIR MINOR (AIRS/AFS) STATE MASTER (MA-EPICS) - NEI-1180238, AIR PROGRAM, RCRAINFO-MAD094266459, HAZARDOUS WASTE PROGRAM CRITERIA AND HAZARDOUS AIR POLLUTANT INVENTORY (Inventory of air pollution sources) HAZARDOUS WASTE BIENNIAL REPORTER (Resource Conservation and Recovery Act (tracking hazardous waste)) Large Quantity Generators, more that 1000 kg of hazardous waste/month (Resource Conservation and Recovery Act (tracking hazardous waste)) - notification TRI REPORTER (Tracking of toxic chemicals releasing facilities) Business SIC classification: STEEL INVESTMENT FOUNDRIES; IRON AND STEEL FORGINGS Business NAICS classification: STEEL INVESTMENT FOUNDRIES.; STEEL INVESTMENT FOUNDRIES.; IRON AND STEEL FORGING.; NONFERROUS FORGING. Organizations: KOMTEK (CONTACT/OPERATOR)
, KOMTEK REALTY INC (CONTACT/OWNER)
, KT ACQUISITION LLC DBA KOM TEK (CONTACT/OWNER)
Alternative names: KOM TECH, KOMTEK, KOMTEK DIV KERVICK, KT ACQUISITION LLC DBA KOM TEK
BURNCOAT MIDDLE SCHO (135 BURNCOAT STREET in WORCESTER, MA)
AIR MINOR (AIRS/AFS) (National Center for Education Statistics) - STATE ID-348405 CRITERIA AND HAZARDOUS AIR POLLUTANT INVENTORY (Inventory of air pollution sources) Business SIC classification: ELEMENTARY AND SECONDARY SCHOOLS Organizations: WORCESTER (SCHOOL DISTRICT)
BURNCOAT SR HIGH SCH (179 BURNCOAT STREET in WORCESTER, MA)
AIR MINOR (AIRS/AFS) (National Center for Education Statistics) - STATE ID-348503 CRITERIA AND HAZARDOUS AIR POLLUTANT INVENTORY (Inventory of air pollution sources) Business SIC classification: ELEMENTARY AND SECONDARY SCHOOLS Organizations: WORCESTER (SCHOOL DISTRICT)
Alternative names: BURNCOAT SENIOR HIGH, BURNCOAT SENIOR HIGH SCHOOL
WRIGHT LINE LLC (160 GOLD STAR BLVD. in WORCESTER, MA)
AIR MINOR (AIRS/AFS) CRITERIA AND HAZARDOUS AIR POLLUTANT INVENTORY (Inventory of air pollution sources) Small Quantity Generators, between 100 kg and 1000 kg of hazardous waste/month (Resource Conservation and Recovery Act (tracking hazardous waste)) - notification TRI REPORTER (Tracking of toxic chemicals releasing facilities) Business SIC classification: OFFICE FURNITURE, EXCEPT WOOD Organizations: WRIGHT LINE INC (CONTACT/OPERATOR)
Alternative names: WRIGHT LINE INC
NORRBACK AVENUE (44 MALDEN STREET in WORCESTER, MA)
(National Center for Education Statistics) - STATE ID-348202 Organizations: WORCESTER (SCHOOL DISTRICT)
ABBY KELLEY FOSTER REGIONAL CH (10 NEW BOND STREET in WORCESTER, MA)
(National Center for Education Statistics) - STATE ID-445105 Organizations: ABBY KELLEY FOSTER REG CH (SCHOOL DISTRICT)
BURNCOAT STREET (526 BURNCOAT STREET in WORCESTER, MA)
(National Center for Education Statistics) - STATE ID-348035 Organizations: WORCESTER (SCHOOL DISTRICT)
CINCINATTI MILACRON HERALD CORPORATION (10 NEW BOND STREET in WORCESTER, MA)
AIR MINOR (AIRS/AFS) CRITERIA AND HAZARDOUS AIR POLLUTANT INVENTORY (Inventory of air pollution sources) Conditionally Exempt Small Quantity Generators, less than 100 kg/month of hazardous waste (Resource Conservation and Recovery Act (tracking hazardous waste)) - notification TRI REPORTER (Tracking of toxic chemicals releasing facilities) Business SIC classification: MACHINE TOOLS, METAL CUTTING TYPES Business NAICS classification: MACHINE TOOL (METAL CUTTING TYPES) MANUFACTURING. Organizations: CINCINNATI MILACRON HEALD CORP (CONTACT/OWNER)
Alternative names: CINCINNATI MILACRON HEALD CORP
CLARK ST COMMUNITY (280 CLARK STREET in WORCESTER, MA)
(National Center for Education Statistics) - STATE ID-348055 Organizations: WORCESTER (SCHOOL DISTRICT)
OS WALKER CO (20 ROCKDALE ST in WORCESTER, MA)
COMPLIANCE ACTIVITY (Tracking inspections of insecticide, fungicide, and rodenticide, and toxic substances) Small Quantity Generators, between 100 kg and 1000 kg of hazardous waste/month (Resource Conservation and Recovery Act (tracking hazardous waste)) - notification TRI REPORTER (Tracking of toxic chemicals releasing facilities) Business SIC classification: CUTTING TOOLS, MACHINE TOOL ACCESSORIES, AND MACHINISTS' PRECISION MEASURING DEVICES Organizations: ENGELSTED JOHN (CONTACT/OWNER)
Alternative names: O. S. WALKER CO., WALKER O S
LUTCO BEARINGS INC (130 HIGGINS ST in WORCESTER, MA)
(Resource Conservation and Recovery Act (tracking hazardous waste)) Organizations: JOHN STOWE (CONTACT/OWNER)
ORIGENIX TECHNOLOGIES INC (100 BARBER AVE in WORCESTER, MA)
(Resource Conservation and Recovery Act (tracking hazardous waste))
Housing units lacking complete plumbing facilities: 1.7% Housing units lacking complete kitchen facilities: 1.4%
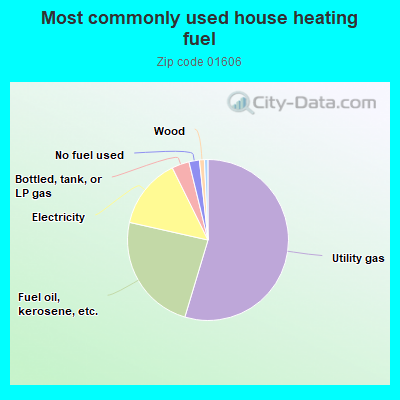
54.7%Utility gas
23.9%Fuel oil, kerosene, etc.
14.2%Electricity
3.5%Bottled, tank, or LP gas
2.1%No fuel used
1.0%Wood
0.7%Other fuel
Population in 1990: 18,213. Population change in the 1990s: +1,698 (+9.3%).
Place of birth for U.S.-born residents:
This state: 14,632
Northeast: 2,123
Midwest: 318
South: 713
West: 361
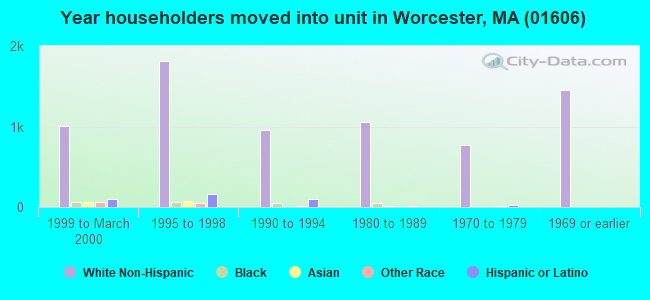
57% of the 01606 zip code residents lived in the same house 5 years ago. Out of people who lived in different houses, 68% lived in this county. Out of people who lived in different counties, 50% lived in Massachusetts.
89% of the 01606 zip code residents lived in the same house 1 year ago. Out of people who lived in different houses, 43% moved from this county. Out of people who lived in different houses, 41% moved from different county within same state. Out of people who lived in different houses, 12% moved from different state. Out of people who lived in different houses, 3% moved from abroad.
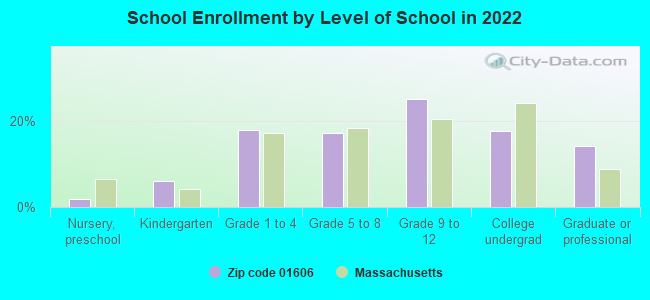
Private vs. public school enrollment:
Students in private schools in grades 1 to 8 (elementary and middle school): 106
Here:
5.5%
Massachusetts:
10.3%
Students in private schools in grades 9 to 12 (high school): 195
Here:
14.0%
Massachusetts:
12.3%
Students in private undergraduate colleges: 389
Here:
39.3%
Massachusetts:
51.2%
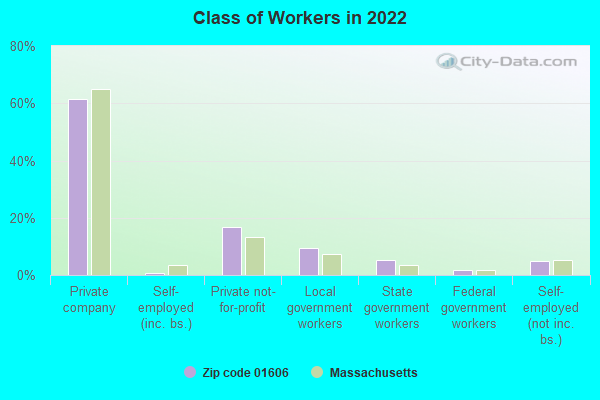
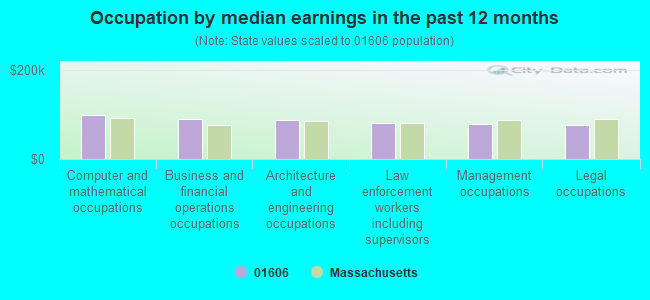
Occupation by median earnings in the past 12 months ($)
98,305Computer and mathematical occupations
89,226Business and financial operations occupations
87,833Architecture and engineering occupations
81,380Law enforcement workers including supervisors
79,956Management occupations
77,768Legal occupations
Companies with federal contracts located in this zip code (WORCESTER, MA):
MICRO NETWORKS CORPORATION (324 CLARK ST; small business) : $697,865 in 17 contractsfrom 2000 to 2005
Contracts for Miscellaneous Electrical and Electronic Components, Microcircuits, Electronic, Electrical and Electronic Properties Measuring and Testing Instruments by Navy, Defense Logistics Agency, Army Signed by year:2000: $57,720; 2001: $53,120; 2002: $323,862; 2003: $77,728; 2004: $79,127; 2005: $106,308; 2006: $0.
Biggest contracts:
$176,127 with Navy for Miscellaneous Electrical and Electronic Components. Taking place in NY. Signed on 2002-02-04. Completion date: 2002-12-10.
$64,256 with Navy for Microcircuits, Electronic. Taking place in NY. Signed on 2002-03-05. Completion date: 2002-08-02.
$61,947 with Defense Logistics Agency for Microcircuits, Electronic. Signed on 2004-10-08. Completion date: 2005-01-28.
$60,453 with Navy for Microcircuits, Electronic. Signed on 2003-12-17. Completion date: 2004-05-21.
MICRO NETWORKS CORPORATION (324 CLARK STREET; small business) : $597,675 in 9 contractsfrom 1999 to 2005
Contracts for Ammunition -- Management and Support (R&D), Miscellaneous Electrical and Electronic Components by Air Force, Navy, Defense Logistics Agency Signed by year:2000: $0; 2001: $0; 2002: $0; 2003: $0; 2004: $385,220; 2005: $16,250; 2006: $0.
Biggest contracts:
$196,205 with Air Force for Ammunition -- Management and Support (R&D). Taking place in CT. Signed on 1999-12-07. Completion date: 2001-03-29.
$107,411 with Navy for Miscellaneous Electrical and Electronic Components. Taking place in CT. Signed on 2004-07-26. Completion date: 2004-11-01.
$97,683 with Defense Logistics Agency for Miscellaneous Electrical and Electronic Components. Signed on 2004-05-11. Completion date: 2004-09-24.
$94,978, same as above.Signed on 2004-11-17. Completion date: 2005-05-24.
KOMTEK (40 ROCKDALE STREET; small business) : $133,891 in 6 contractsfrom 2003 to 2005
Contracts for Parachutes; Aerial Pick Up, Delivery, Recovery Systems; and Cargo Tie Down Equipment by Army Signed by year:2000: $0; 2001: $0; 2002: $0; 2003: $163,476; 2004: $85,215; 2005: -$114,800; 2006: $0.
Biggest contracts:
$114,800 with Army for Parachutes; Aerial Pick Up, Delivery, Recovery Systems; and Cargo Tie Down Equipment. Signed on 2003-09-19. Completion date: 2004-07-19.
$85,215, same as above.Signed on 2004-01-09. Completion date: 2004-02-23.
$48,076, same as above.Signed on 2003-05-05. Completion date: 2002-02-23.
$1,200 with Army for Parachutes; Aerial Pick Up, Delivery, Recovery Systems; and Cargo Tie Down Equipment. Taking place in AR. Signed on 2003-05-05. Completion date: 2002-02-23.
WALKER LDJ SCIENTIFIC, INC (10 ROCKDALE ST) : $106,278 in 7 contractsfrom 2000 to 2006
Contracts for Electronic Modules, Other Defense -- Applied Research and Exploratory Development (R&D), Miscellaneous Electric Power and Distribution Equipment, Electrical and Electronic Properties Measuring and Testing Instruments, and moreby Air Force, Navy, National Oceanic and Atmospheric Administration/Under Secretary for Oceans and Atmosphere, Army, and others Signed by year:2000: $32,100; 2001: $0; 2002: $0; 2003: $3,945; 2004: $2,723; 2005: $30,140; 2006: $37,370.
Biggest contracts:
$37,370 with Air Force for Electronic Modules. Signed on 2006-05-29. Completion date: 2006-06-26.
$32,100 with Navy for Other Defense -- Applied Research and Exploratory Development (R&D). Signed on 2000-09-21. Completion date: 2000-11-05.
$22,667 with National Oceanic and Atmospheric Administration/Under Secretary for Oceans and Atmosphere for Miscellaneous Electric Power and Distribution Equipment. Signed on 2005-02-15. Completion date: 2005-06-15.
$4,280 with National Oceanic and Atmospheric Administration/Under Secretary for Oceans and Atmosphere for Electrical and Electronic Properties Measuring and Testing Instruments. Signed on 2005-06-23. Completion date: 2005-08-22.
SPECIALIZED SOLUTIONS, INC (67 MILLBROOK STREET; small business) : $9,547 in 2 contractsfrom 2005 to 2006
$10,024 with Defense Information Systems Agency for Other ADP and Telecommunications Services (includes data storage on tapes, compact disks, etc.). Taking place in PA. Signed on 2005-10-01. Completion date: 2006-09-30.
-$477 with Defense Information Systems Agency for ADP Software. Taking place in PA. Signed on 2006-06-06. Completion date: 2006-09-30.
WORAD INC (299 BROOKS ST; small business)
$9,500 with U.S. Army Corps of Engineers - civil program financing only for Installation of Equipment -- Electrical and Electronic Equipment Components. Signed on 2002-04-23. Completion date: 2002-06-30.
PIRANI ELECTRIC INC (846 W BOYLSTON ST; small business) : $4,425 in 2 contractsin 2002
$3,225 with U.S. Army Corps of Engineers - civil program financing only for Maintenance, Repair or Alteration of Real Property -- Other Administrative Facilities and Service Buildings. Signed on 2002-06-25. Completion date: 2002-07-12.
$1,200, same as above.Signed on 2002-08-01. Completion date: 2002-07-12.
CURTIS TRACTOR CAB INC (111 HIGGINS ST; small business) : $0 in 2 contractsfrom 2004 to 2006
$6,038 with Army for Miscellaneous Vehicular Components. Signed on 2004-09-30. Completion date: 2004-10-30.
-$6,038, same as above.Signed on 2006-01-17. Completion date: 2004-10-30.
Top industries in this zip code by the number of employees in 2005:
Administrative and Support and Waste Management and Remediation Services: Temporary Help Services (250-499 employees: 1 establishment, 100-249 employees: 1 establishment)
Information: Cable and Other Program Distribution (250-499: 1, 50-99: 1, 1-4: 1)
2002 - 2018 National Fire Incident Reporting System (NFIRS) incidents
Based on the data from the years 2002 - 2018 the average number of fires per year is 124. The highest number of fires - 272 took place in 2004, and the least - 73 in 2002. The data has a rising trend.
When looking into fire subcategories, the most incidents belonged to: Outside Fires (38.9%), and Structure Fires (32.9%).
Fire incident types reported to NFIRS in Zip Code 01606


 Nearest zip codes: 01605, 01609, 01608, 01583, 01520, 01604.
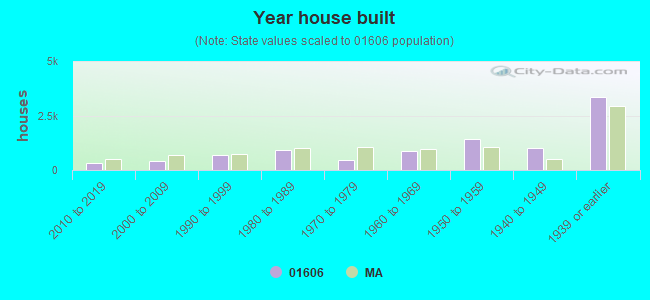


 Based on the data from the years 2002 - 2018 the average number of fires per year is 124. The highest number of fires - 272 took place in 2004, and the least - 73 in 2002. The data has a rising trend.
 When looking into fire subcategories, the most incidents belonged to: Outside Fires (38.9%), and Structure Fires (32.9%).