Estimated zip code population in 2022: 40,978 Zip code population in 2010: 38,903 Zip code population in 2000: 37,258
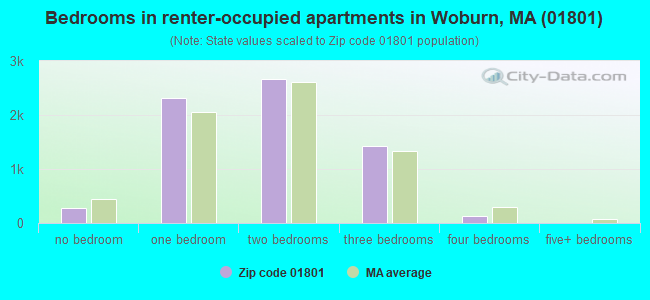
Houses and condos: 17,034 Renter-occupied apartments: 6,809
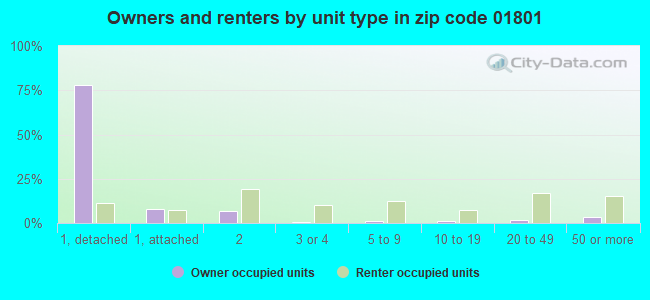
% of renters here:
41%
State:
38%
March 2022 cost of living index in zip code 01801: 136.7 (high, U.S. average is 100)
Land area: 12.7 sq. mi. Water area: 0.3 sq. mi.
Population density: 3,238 people per square mile
(average).
OSM Map
Google Map
MSN Map
OSM Map
General Map
Google Map
MSN Map
OSM Map
Google Map
MSN Map
OSM Map
Google Map
MSN Map
Please wait while loading the map...
Real estate property taxes paid for housing units in 2022:
This zip code:
0.7% ($4,907)
Massachusetts:
1.0% ($5,536)
Median real estate property taxes paid for housing units with mortgages in 2022: $4,950 (0.7%) Median real estate property taxes paid for housing units with no mortgage in 2022: $4,821 (0.8%)
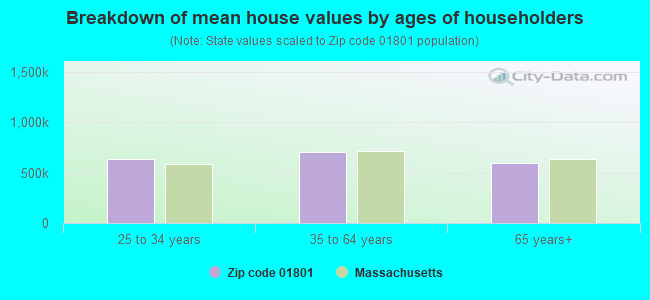
Estimated median house/condo value in 2022: $676,800
01801:
$676,800
Massachusetts:
$534,700
According to our research of Massachusetts and other state lists, there were 9 registered sex offenders living in 01801 zip code as of April 27, 2024. The ratio of all residents to sex offenders in zip code 01801 is 4,483 to 1. The ratio of registered sex offenders to all residents in this zip code is much lower than the state average.
Median resident age:
This zip code:
39.7 years
Massachusetts median age:
40.3 years
Average household size:
This zip code:
2.5 people
Massachusetts:
2.4 people
Averages for the 2020 tax year for zip code 01801, filed in 2021:
Average Adjusted Gross Income (AGI) in 2020: $87,403 (Individual Income Tax Returns)
Here:
$87,403
State:
$105,130
Salary/wage: $76,152 (reported on 81.7% of returns)
Here:
$76,152
State:
$82,951
(% of AGI for various income ranges: 1142.2% for AGIs below $25k, 3718.1% for AGIs $25k-50k, 6768.0% for AGIs $50k-75k, 10162.8% for AGIs $75k-100k, 19648.3% for AGIs $100k-200k, 75333.5% for AGIs over 200k)
Taxable interest for individuals: $1,849 (reported on 40.9% of returns)
This zip code:
$1,849
Massachusetts:
$2,361
(% of AGI for various income ranges: 32.7% for AGIs below $25k, 36.0% for AGIs $25k-50k, 50.5% for AGIs $50k-75k, 70.6% for AGIs $75k-100k, 130.1% for AGIs $100k-200k, 1697.0% for AGIs over 200k)
Ordinary dividends: $4,456 (reported on 24.7% of returns)
Here:
$4,456
State:
$10,365
(% of AGI for various income ranges: 35.5% for AGIs below $25k, 41.3% for AGIs $25k-50k, 76.3% for AGIs $50k-75k, 126.4% for AGIs $75k-100k, 225.0% for AGIs $100k-200k, 2343.3% for AGIs over 200k)
Net capital gain/loss in AGI: +$28,364 (reported on 21.4% of returns)
Here:
+$28,364
State:
+$48,178
(% of AGI for various income ranges: 14.5% for AGIs below $25k, 37.1% for AGIs $25k-50k, 77.4% for AGIs $50k-75k, 135.5% for AGIs $75k-100k, 466.4% for AGIs $100k-200k, 22239.6% for AGIs over 200k)
Profit/loss from business: +$15,918 (reported on 15.2% of returns)
Here:
+$15,918
State:
+$20,792
(% of AGI for various income ranges: 174.0% for AGIs below $25k, 241.2% for AGIs $25k-50k, 233.7% for AGIs $50k-75k, 347.9% for AGIs $75k-100k, 571.6% for AGIs $100k-200k, 2779.3% for AGIs over 200k)
Taxable individual retirement arrangement distribution: $17,784 (reported on 9.9% of returns)
01801:
$17,784
Massachusetts:
$22,790
(% of AGI for various income ranges: 95.6% for AGIs below $25k, 116.1% for AGIs $25k-50k, 223.5% for AGIs $50k-75k, 306.4% for AGIs $75k-100k, 529.3% for AGIs $100k-200k, 1627.8% for AGIs over 200k)
Self-employed (Keogh) retirement plans: $19,650 (reported on 0.6% of returns)
01801:
$19,650
Massachusetts:
$26,868
(% of AGI for various income ranges: 8.4% for AGIs $25k-50k, 32.4% for AGIs $100k-200k, 302.2% for AGIs over 200k)
Total itemized deductions: $35,272 (reported on 13.6% of returns)
Here:
$35,272
State:
$36,722
(% of AGI for various income ranges: 115.4% for AGIs below $25k, 191.6% for AGIs $25k-50k, 354.5% for AGIs $50k-75k, 633.1% for AGIs $75k-100k, 1205.2% for AGIs $100k-200k, 8907.0% for AGIs over 200k)
Charity contributions: $4,601 (reported on 10.6% of returns)
Here:
$4,601
State:
$12,529
(% of AGI for various income ranges: 4.8% for AGIs below $25k, 11.9% for AGIs $25k-50k, 33.9% for AGIs $50k-75k, 59.9% for AGIs $75k-100k, 124.8% for AGIs $100k-200k, 1007.0% for AGIs over 200k)
Taxes paid: $8,528 (reported on 13.5% of returns)
01801:
$8,528
State:
$8,782
(% of AGI for various income ranges: 21.1% for AGIs below $25k, 46.6% for AGIs $25k-50k, 108.5% for AGIs $50k-75k, 218.0% for AGIs $75k-100k, 420.8% for AGIs $100k-200k, 1243.9% for AGIs over 200k)
Earned income credit: $1,713 (reported on 7.0% of returns)
Here:
$1,713
State:
$1,909
(% of AGI for various income ranges: 47.4% for AGIs below $25k, 36.8% for AGIs $25k-50k)
Percentage of individuals using paid preparers for their 2020 taxes: 90.0%
Here:
90%
State:
92%
(% for various income ranges: 86.5% for AGIs below $25k, 90.5% for AGIs $25k-50k, 91.3% for AGIs $50k-75k, 90.0% for AGIs $75k-100k, 91.7% for AGIs $100k-200k, 92.9% for AGIs over 200k)
Averages for the 2012 tax year for zip code 01801, filed in 2013:
Average Adjusted Gross Income (AGI) in 2012: $64,162 (Individual Income Tax Returns)
Here:
$64,162
State:
$81,425
Salary/wage: $59,442 (reported on 84.5% of returns)
Here:
$59,442
State:
$64,752
(% of AGI for various income ranges: 69.8% for AGIs below $25k, 79.2% for AGIs $25k-50k, 79.7% for AGIs $50k-75k, 81.2% for AGIs $75k-100k, 84.1% for AGIs $100k-200k, 65.0% for AGIs over 200k)
Taxable interest for individuals: $1,284 (reported on 43.9% of returns)
This zip code:
$1,284
Massachusetts:
$2,136
(% of AGI for various income ranges: 1.7% for AGIs below $25k, 0.7% for AGIs $25k-50k, 0.7% for AGIs $50k-75k, 0.5% for AGIs $75k-100k, 0.5% for AGIs $100k-200k, 2.0% for AGIs over 200k)
Ordinary dividends: $4,339 (reported on 22.5% of returns)
Here:
$4,339
State:
$9,473
(% of AGI for various income ranges: 1.7% for AGIs below $25k, 0.8% for AGIs $25k-50k, 0.8% for AGIs $50k-75k, 0.8% for AGIs $75k-100k, 0.9% for AGIs $100k-200k, 4.7% for AGIs over 200k)
Net capital gain/loss in AGI: +$7,287 (reported on 15.8% of returns)
Here:
+$7,287
State:
+$31,437
(% of AGI for various income ranges: 0.3% for AGIs $50k-75k, 0.4% for AGIs $75k-100k, 1.0% for AGIs $100k-200k, 8.0% for AGIs over 200k)
Profit/loss from business: +$15,929 (reported on 12.5% of returns)
Here:
+$15,929
State:
+$20,662
(% of AGI for various income ranges: 8.6% for AGIs below $25k, 4.3% for AGIs $25k-50k, 2.8% for AGIs $50k-75k, 2.2% for AGIs $75k-100k, 2.1% for AGIs $100k-200k, 3.3% for AGIs over 200k)
Taxable individual retirement arrangement distribution: $13,820 (reported on 11.1% of returns)
01801:
$13,820
Massachusetts:
$18,892
(% of AGI for various income ranges: 4.6% for AGIs below $25k, 2.6% for AGIs $25k-50k, 2.4% for AGIs $50k-75k, 2.4% for AGIs $75k-100k, 2.2% for AGIs $100k-200k, 1.9% for AGIs over 200k)
Self-employment retirement plans: $19,700 (reported on 0.5% of returns)
01801:
$19,700
Massachusetts:
$20,669
(% of AGI for various income ranges: 0.2% for AGIs $50k-75k, 0.1% for AGIs $100k-200k, 0.5% for AGIs over 200k)
Total itemized deductions: $22,818 (21% of AGI, reported on 36.8% of returns)
Here:
$22,818
State:
$28,907
Here:
20.8% of AGI
State:
18.2% of AGI
(% of AGI for various income ranges: 13.0% for AGIs below $25k, 8.9% for AGIs $25k-50k, 11.5% for AGIs $50k-75k, 13.3% for AGIs $75k-100k, 14.6% for AGIs $100k-200k, 14.7% for AGIs over 200k)
Charity contributions: $2,293 (reported on 30.7% of returns)
Here:
$2,293
State:
$4,208
(% of AGI for various income ranges: 0.7% for AGIs below $25k, 0.8% for AGIs $25k-50k, 0.9% for AGIs $50k-75k, 1.0% for AGIs $75k-100k, 1.2% for AGIs $100k-200k, 1.7% for AGIs over 200k)
Taxes paid: $9,372 (reported on 36.7% of returns)
01801:
$9,372
State:
$13,303
(% of AGI for various income ranges: 3.1% for AGIs below $25k, 2.5% for AGIs $25k-50k, 4.1% for AGIs $50k-75k, 5.1% for AGIs $75k-100k, 6.5% for AGIs $100k-200k, 7.5% for AGIs over 200k)
Earned income credit: $1,732 (reported on 8.6% of returns)
Here:
$1,732
State:
$1,971
(% of AGI for various income ranges: 3.1% for AGIs below $25k, 0.5% for AGIs $25k-50k)
Percentage of individuals using paid preparers for their 2012 taxes: 53.8%
Here:
54%
State:
56%
(% for various income ranges: 50.0% for AGIs below $25k, 50.1% for AGIs $25k-50k, 56.0% for AGIs $50k-75k, 58.6% for AGIs $75k-100k, 58.9% for AGIs $100k-200k, 64.5% for AGIs over 200k)
Averages for the 2004 tax year for zip code 01801, filed in 2005:
Average Adjusted Gross Income (AGI) in 2004: $54,788 (Individual Income Tax Returns)
Here:
$54,788
State:
$62,877
Salary/wage: $48,449 (reported on 84.9% of returns)
Here:
$48,449
State:
$52,969
(% of AGI for various income ranges: 101.6% for AGIs below $10k, 69.5% for AGIs $10k-25k, 81.2% for AGIs $25k-50k, 83.1% for AGIs $50k-75k, 85.4% for AGIs $75k-100k, 64.1% for AGIs over 100k)
Taxable interest for individuals: $1,305 (reported on 58.3% of returns)
This zip code:
$1,305
Massachusetts:
$1,945
(% of AGI for various income ranges: 7.5% for AGIs below $10k, 3.1% for AGIs $10k-25k, 1.5% for AGIs $25k-50k, 1.2% for AGIs $50k-75k, 1.1% for AGIs $75k-100k, 1.1% for AGIs over 100k)
Taxable dividends: $1,943 (reported on 26.7% of returns)
Here:
$1,943
State:
$5,323
(% of AGI for various income ranges: 3.0% for AGIs below $10k, 1.3% for AGIs $10k-25k, 0.7% for AGIs $25k-50k, 0.8% for AGIs $50k-75k, 0.7% for AGIs $75k-100k, 1.1% for AGIs over 100k)
Net capital gain/loss: +$7,365 (reported on 20.2% of returns)
Here:
+$7,365
State:
+$20,377
(% of AGI for various income ranges: -2.5% for AGIs below $10k, 0.1% for AGIs $10k-25k, 0.3% for AGIs $25k-50k, 0.6% for AGIs $50k-75k, 0.7% for AGIs $75k-100k, 6.2% for AGIs over 100k)
Profit/loss from business: +$12,439 (reported on 11.9% of returns)
Here:
+$12,439
State:
+$17,837
(% of AGI for various income ranges: 3.0% for AGIs below $10k, 5.4% for AGIs $10k-25k, 3.2% for AGIs $25k-50k, 2.5% for AGIs $50k-75k, 2.4% for AGIs $75k-100k, 2.4% for AGIs over 100k)
IRA payment deduction: $3,057 (reported on 2.6% of returns)
01801:
$3,057
Massachusetts:
$3,100
(% of AGI for various income ranges: 0.3% for AGIs below $10k, 0.2% for AGIs $10k-25k, 0.2% for AGIs $25k-50k, 0.2% for AGIs $50k-75k, 0.1% for AGIs $75k-100k, 0.1% for AGIs over 100k)
Self-employed pension: $9,916 (reported on 0.7% of returns)
Here:
$9,916
Massachusetts:
$14,516
(% of AGI for various income ranges: 0.1% for AGIs $25k-50k, 0.1% for AGIs $50k-75k, 0.1% for AGIs $75k-100k, 0.2% for AGIs over 100k)
Total itemized deductions: $20,038 (22% of AGI, reported on 38.7% of returns)
Here:
$20,038
State:
$22,573
Here:
21.6% of AGI
State:
19.5% of AGI
(% of AGI for various income ranges: 20.0% for AGIs below $10k, 13.0% for AGIs $10k-25k, 11.4% for AGIs $25k-50k, 14.4% for AGIs $50k-75k, 16.4% for AGIs $75k-100k, 14.3% for AGIs over 100k)
Charity contributions deductions: $2,352 (3% of AGI, reported on 35.2% of returns)
Here:
$2,352
State:
$3,295
Here:
2.5% of AGI
State:
2.7% of AGI
(% of AGI for various income ranges: 0.8% for AGIs below $10k, 1.0% for AGIs $10k-25k, 1.1% for AGIs $25k-50k, 1.3% for AGIs $50k-75k, 1.5% for AGIs $75k-100k, 1.9% for AGIs over 100k)
Total tax: $8,054 (reported on 83.0% of returns)
01801:
$8,054
State:
$11,494
(% of AGI for various income ranges: 3.2% for AGIs below $10k, 4.8% for AGIs $10k-25k, 8.5% for AGIs $25k-50k, 10.3% for AGIs $50k-75k, 11.0% for AGIs $75k-100k, 16.7% for AGIs over 100k)
Earned income credit: $1,449 (reported on 6.6% of returns)
Here:
$1,449
State:
$1,518
Percentage of individuals using paid preparers for their 2004 taxes: 54.6%
Here:
55%
State:
58%
(% for various income ranges: 46.5% for AGIs below $10k, 55.8% for AGIs $10k-25k, 52.7% for AGIs $25k-50k, 58.0% for AGIs $50k-75k, 57.9% for AGIs $75k-100k, 60.7% for AGIs over 100k)
Likely homosexual households (counted as self-reported same-sex unmarried-partner households)
Lesbian couples: 0.4% of all households
Gay men: 0.1% of all households
Household received Food Stamps/SNAP in the past 12 months: 1,665 Household did not receive Food Stamps/SNAP in the past 12 months: 14,626
Women who had a birth in the past 12 months: 517 (505 now married, 31 unmarried) Women who did not have a birth in the past 12 months: 9,458 (3,764 now married, 5,675 unmarried)
Housing units in zip code 01801 with a mortgage: 6,501 (857 second mortgage, 20 home equity loan, 803 both second mortgage and home equity loan) Houses without a mortgage: 439
Median monthly owner costs for units with a mortgage: $2,639 Median monthly owner costs for units without a mortgage: $883
Residents with income below the poverty level in 2022:
This zip code:
6.8%
Whole state:
10.4%
Residents with income below 50% of the poverty level in 2022:
This zip code:
3.4%
Whole state:
5.1%
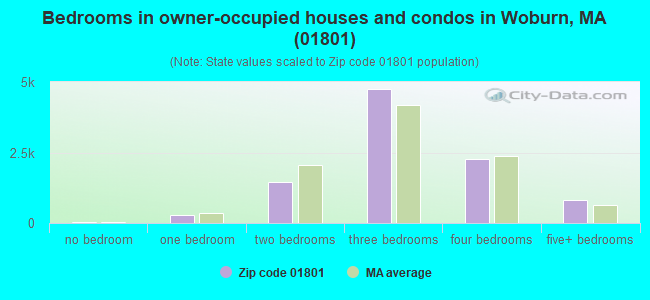
Median number of rooms in houses and condos:
Here:
6.7
State:
6.5
Median number of rooms in apartments:
Here:
4.0
State:
4.0
Notable locations in this zip code not listed on our city pages
Notable locations in zip code 01801: Mishawum Station (A), Anderson-Woburn Station (B), Industriplex 128 (C), Northeast Trade Center and Exhibition (D), Unicorn Office Park (E), Woburn Commerce Center (F), Woburn Country Club (G), Eastern Ambulance Service (H), LifeLine Ambulance Service (I), Woburn Fire Department Station 5 (J), Woburn Fire Department Station 2 (K), Woburn Fire Department Station 4 (L), Woburn Fire Department Station 1 Headquarters (M), Woburn Fire Department Station 3 (N), Janice Callahan Library (O), Woburn City Hall (P), World Phenomenology Institute (Q), Middlesex Law Library (R), Woburn Public Library (S). Display/hide their locations on the map
Shopping Centers: Route 128-38 Shopping Center (1), Woburn Mall (2), Woburn Mall Shopping Center (3), Woburn Plaza Shopping Center (4), E-Z Way Shopping Center (5). Display/hide their locations on the map
Churches in zip code 01801 include: Trinity Church (A), Saint Johns Baptist Church (B), Saint Barbaras Church (C), Montvale Congregational Church (D), Lutheran Church of the Redeemer (E), First Congregational Church (F), Faith Chapel (G), Church of the Living God (H), Boston Church of Christ (I). Display/hide their locations on the map
5,383 married couples with children.
1,326 single-parent households (360 men, 966 women).
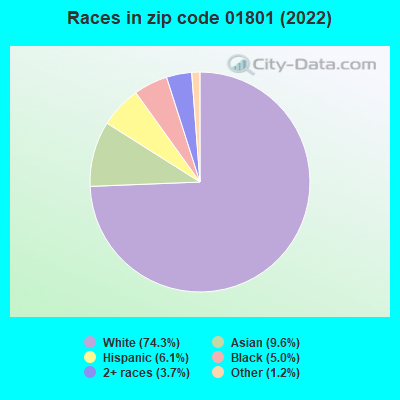
75.6% of residents of 01801 zip code speak English at home.
4.4% of residents speak Spanish at home (35% very well, 25% well, 24% not well, 16% not at all).
14.0% of residents speak other Indo-European language at home (62% very well, 25% well, 8% not well, 6% not at all).
4.1% of residents speak Asian or Pacific Island language at home (59% very well, 24% well, 12% not well, 5% not at all).
1.9% of residents speak other language at home (89% very well, 11% well).
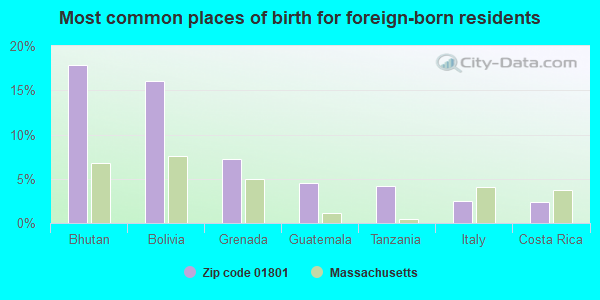
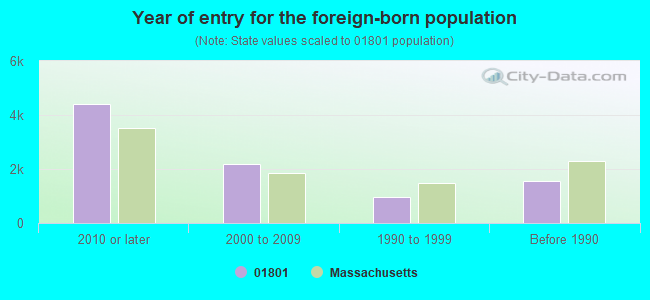
Foreign born population: 8,481 (20.7%) (54.7% of them are naturalized citizens)
Major facilities with environmental interests located in this zip code:
KENNEDY MIDDLE SCHOOL (35 MIDDLE ST in WOBURN, MA)
AIR MINOR (AIRS/AFS) STATE MASTER (MA-EPICS) - NEI-1191022, AIR PROGRAM (National Center for Education Statistics) - STATE ID-347405 CRITERIA AND HAZARDOUS AIR POLLUTANT INVENTORY (Inventory of air pollution sources) Business SIC classification: ELEMENTARY AND SECONDARY SCHOOLS Organizations: WOBURN (SCHOOL DISTRICT)
Alternative names: JOHN F. KENNEDY MEMORIAL MIDDLE SCHOOL, KENNEDY JR HIGH
WR GRACE CRYOVAC (369 WASHINGTON STREET in WOBURN, MA)
SUPERFUND (Superfund database) - ICIS-, ENFORCEMENT/COMPLIANCE ACTIVITY ENFORCEMENT/COMPLIANCE ACTIVITY (Integrated Compliance Information System) (Resource Conservation and Recovery Act (tracking hazardous waste)) - ICIS-, ENFORCEMENT/COMPLIANCE ACTIVITY Organizations: W R GRACE & CO (CONTACT/OWNER)
Alternative names: GRACE W R & CO, WR GRACE & COMPANY, WR GRACE & COmpany
MADICO, INC. (64 INDUSTRIAL PARKWAY in WOBURN, MA)
AIR SYNTHETIC MINOR (AIRS/AFS) COMPLIANCE ACTIVITY (Tracking inspections of insecticide, fungicide, and rodenticide, and toxic substances) CRITERIA AND HAZARDOUS AIR POLLUTANT INVENTORY (Inventory of air pollution sources) HAZARDOUS WASTE BIENNIAL REPORTER (Resource Conservation and Recovery Act (tracking hazardous waste)) Large Quantity Generators, more that 1000 kg of hazardous waste/month (Resource Conservation and Recovery Act (tracking hazardous waste)) - notification (Resource Conservation and Recovery Act (tracking hazardous waste)) TRI REPORTER (Tracking of toxic chemicals releasing facilities) Business SIC classification: COATED FABRICS, NOT RUBBERIZED; COATED AND LAMINATED PAPER Business NAICS classification: COATED AND LAMINATED PAPER MANUFACTURING.; UNLAMINATED PLASTICS FILM AND SHEET (EXCEPT PACKAGING) MANUFACTURING. Organizations: VAN LEER USA (CONTACT/OWNER)
Alternative names: VAN LEER PLASTICS MADICO DIVISION, VAN LEER U S A HYSIL MADICO DIV, VAN LEER U S A HYSIL MADICO DIV
KRAFT FOODS (HILL ST. in WOBURN, MA)
AIR MAJOR (AIRS/AFS) - ICIS-01-2006-1004, ENFORCEMENT/COMPLIANCE ACTIVITY, ICIS-, ICIS-01-2005-1017, ICIS-, SUPERFUND (Superfund database) COMPLIANCE ACTIVITY (Tracking inspections of insecticide, fungicide, and rodenticide, and toxic substances) CRITERIA AND HAZARDOUS AIR POLLUTANT INVENTORY (Inventory of air pollution sources) HAZARDOUS WASTE BIENNIAL REPORTER (Resource Conservation and Recovery Act (tracking hazardous waste)) Small Quantity Generators, between 100 kg and 1000 kg of hazardous waste/month (Resource Conservation and Recovery Act (tracking hazardous waste)) - notification TRI REPORTER (Tracking of toxic chemicals releasing facilities) Business SIC classification: ANIMAL AND MARINE FATS AND OILS; FLAVORING EXTRACTS AND FLAVORING SYRUPS; FOOD PREPARATIONS; CHEMICALS AND CHEMICAL PREPARATIONS Business NAICS classification: ALL OTHER MISCELLANEOUS FOOD MANUFACTURING. Organizations: KRAFT FOODS INC (CONTACT/OWNER)
Alternative names: ATLANTIC GELATIN-GENERAL FOODS, ATLANTIC GELATINE, KRAFT FOODS N.A. INC., KRAFT GENERAL FOODS
MAHONEYS GARDEN CENTER (200 WILDWOOD STREET in WOBURN, MA)
AIR MINOR (AIRS/AFS) AIR SYNTHETIC MINOR (AIRS/AFS) STATE MASTER (MA-EPICS) - NEI-1191120, AIR PROGRAM CRITERIA AND HAZARDOUS AIR POLLUTANT INVENTORY (Inventory of air pollution sources) Business SIC classification: ORNAMENTAL FLORICULTURE AND NURSERY PRODUCTS Alternative names: JOHNSON'S ROSES INC, JOHNSONS ROSES INCORPORATED, MAHONEYS WHOLESALE GROWING GREENHOUSE
A 1 PRECIOUS METAL PLATING INC (36 SIXTH RD in WOBURN, MA)
(Integrated Compliance Information System) - ICIS-01-1999-0201, FORMAL ENFORCEMENT ACTION, ICIS-01-2001-0058, HAZARDOUS WASTE BIENNIAL REPORTER (Resource Conservation and Recovery Act (tracking hazardous waste)) (Resource Conservation and Recovery Act (tracking hazardous waste)) Business SIC and NAICS classification: ELECTROPLATING, PLATING, POLISHING, ANODIZING, AND COLORING Organizations: SUPERFUND PRPS (CONTACT/OWNER)
Alternative names: 6 AVE RLTY TRST A 1 PRECIOUS METALS STE
ABERJONA AUTO PARTS INC (278-280 SALEM ST in WOBURN, MA)
SUPERFUND (Superfund database) (Integrated Compliance Information System) - ICIS-01-1997-0153, FORMAL ENFORCEMENT ACTION Conditionally Exempt Small Quantity Generators, less than 100 kg/month of hazardous waste (Resource Conservation and Recovery Act (tracking hazardous waste)) - notification Organizations: WILLIAM BOUTWELL (CONTACT/OWNER)
CHOMERICS DIVISION (12D CABOT RD in WOBURN, MA)
AIR MINOR (AIRS/AFS) CRITERIA AND HAZARDOUS AIR POLLUTANT INVENTORY (Inventory of air pollution sources) HAZARDOUS WASTE BIENNIAL REPORTER (Resource Conservation and Recovery Act (tracking hazardous waste)) (Resource Conservation and Recovery Act (tracking hazardous waste)) Business SIC classification: COMMERCIAL PRINTING, LITHOGRAPHIC Business NAICS classification: GASKET, PACKING, AND SEALING DEVICE MANUFACTURING. Organizations: PARKER HANNIFIN CROP. CHOMERICS DIV (CONTACT/OPERATOR)
, PARKER HANNIFIN CORP. (CONTACT/OWNER)
, PARKER HANNIFIN CORP (CONTACT/OWNER)
Alternative names: CHOMERICKS DIV PARKER HANNIFIN CORP, CHOMERICS DIV PARKER HANNIFIN CORP, CHOMERICS DIV PARKER HANNIFIN CORP
ARQULE INC (19 PRESIDENTIAL WAY in WOBURN, MA)
AIR SYNTHETIC MINOR (AIRS/AFS) CRITERIA AND HAZARDOUS AIR POLLUTANT INVENTORY (Inventory of air pollution sources) HAZARDOUS WASTE BIENNIAL REPORTER (Resource Conservation and Recovery Act (tracking hazardous waste)) Large Quantity Generators, more that 1000 kg of hazardous waste/month (Resource Conservation and Recovery Act (tracking hazardous waste)) Business SIC classification: NONCLASSIFIABLE ESTABLISHMENTS Organizations: ARQULE, INCORPORATED (CONTACT/OPERATOR)
MARSHALLS DISTRIBUTION CENTER (83 COMMERCE WAY in WOBURN, MA)
AIR MINOR (AIRS/AFS) ENFORCEMENT/COMPLIANCE ACTIVITY (Integrated Compliance Information System) Conditionally Exempt Small Quantity Generators, less than 100 kg/month of hazardous waste (Resource Conservation and Recovery Act (tracking hazardous waste)) - notification TRI REPORTER (Tracking of toxic chemicals releasing facilities) Business SIC classification: APPAREL AND ACCESSORIES; PRESSED AND BLOWN GLASS AND GLASSWARE; FINE EARTHENWARE (WHITEWARE) TABLE AND KITCHEN ARTICLES; DEPARTMENT STORES Organizations: MELVILLE CORPORATION (CONTACT/OWNER)
, MELVILLE CORP (CONTACT/OWNER)
LYTRON INC (55 DRAGON CT. in WOBURN, MA)
AIR MINOR (AIRS/AFS) ENFORCEMENT/COMPLIANCE ACTIVITY (Integrated Compliance Information System) CRITERIA AND HAZARDOUS AIR POLLUTANT INVENTORY (Inventory of air pollution sources) Small Quantity Generators, between 100 kg and 1000 kg of hazardous waste/month (Resource Conservation and Recovery Act (tracking hazardous waste)) - notification TRI REPORTER (Tracking of toxic chemicals releasing facilities) Business SIC classification: FABRICATED PLATE WORK (BOILER SHOPS); FABRICATED METAL PRODUCTS Organizations: COLE RICHARD F (CONTACT/OWNER)
NORTHERN RESEARCH & ENGINEERING (39 OLYMPIA AVENUE in WOBURN, MA)
AIR MINOR (AIRS/AFS) CRITERIA AND HAZARDOUS AIR POLLUTANT INVENTORY (Inventory of air pollution sources) (Resource Conservation and Recovery Act (tracking hazardous waste)) Organizations: INGERSOLL-RAND COMPANY (CONTACT/OWNER)
AVNET TECHNOLOGIES (160 NEW BOSTON STREET in WOBURN, MA)
AIR MINOR (AIRS/AFS) (Resource Conservation and Recovery Act (tracking hazardous waste)) Business SIC classification: NONCLASSIFIABLE ESTABLISHMENTS
Housing units lacking complete plumbing facilities: 0.9% Housing units lacking complete kitchen facilities: 1.2%
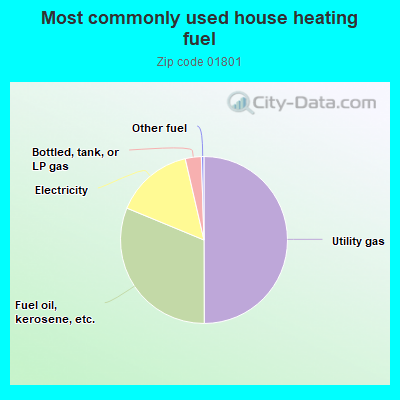
49.8%Utility gas
31.2%Fuel oil, kerosene, etc.
15.1%Electricity
3.1%Bottled, tank, or LP gas
0.5%Other fuel
Population in 1990: 36,152. Population change in the 1990s: +1,106 (+3.1%).
Place of birth for U.S.-born residents:
This state: 26,176
Northeast: 3,102
Midwest: 632
South: 1,244
West: 785
65% of the 01801 zip code residents lived in the same house 5 years ago. Out of people who lived in different houses, 68% lived in this county. Out of people who lived in different counties, 50% lived in Massachusetts.
87% of the 01801 zip code residents lived in the same house 1 year ago. Out of people who lived in different houses, 55% moved from this county. Out of people who lived in different houses, 14% moved from different county within same state. Out of people who lived in different houses, 22% moved from different state. Out of people who lived in different houses, 8% moved from abroad.
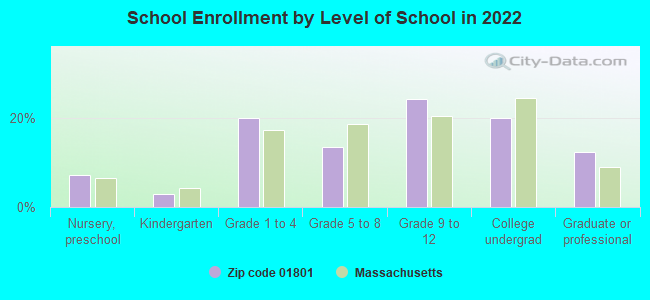
Private vs. public school enrollment:
Students in private schools in grades 1 to 8 (elementary and middle school): 278
Here:
9.7%
Massachusetts:
10.3%
Students in private schools in grades 9 to 12 (high school): 215
Here:
10.3%
Massachusetts:
12.3%
Students in private undergraduate colleges: 799
Here:
46.5%
Massachusetts:
51.2%
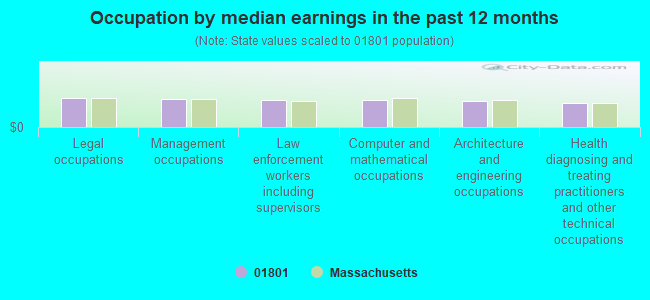
Occupation by median earnings in the past 12 months ($)
108,748Legal occupations
104,481Management occupations
101,929Law enforcement workers including supervisors
99,968Computer and mathematical occupations
97,583Architecture and engineering occupations
90,463Health diagnosing and treating practitioners and other technical occupations
Companies with biggest federal contracts located in this zip code (WOBURN, MA):
RAYTHEON COMPANY (225 PRESIDENTIAL WAY) : $56,466,934 in 44 contractsfrom 2004 to 2006
Contracts for Defense Missile and Space Systems -- Engineering Development (R&D), Defense Missile and Space Systems -- Basic Research (R&D), Maintenance, Repair or Alteration of Real Property -- Missile System Facilities, Maintenance, Repair and Rebuilding of Equipment -- Alarm, Signal, and Security Detection Systems by Missile Defense Agency Signed by year:2000: $0; 2001: $0; 2002: $0; 2003: $0; 2004: $2,405,000; 2005: $8,705,032; 2006: $45,356,902.
Biggest contracts:
$5,820,000 with Missile Defense Agency for Defense Missile and Space Systems -- Engineering Development (R&D). Signed on 2006-05-02. Completion date: 2005-12-31.
$5,714,714, same as above.Signed on 2006-05-10. Completion date: 2006-09-30.
$5,441,000, same as above.Signed on 2005-08-22. Completion date: 2006-06-30.
$5,382,000, same as above.Signed on 2006-04-07. Completion date: 2010-09-30.
SCIENTIFIC SYSTEMS COMPANY, IN (500 W CUMMINGS PK , SUITE; small business) : $34,325,912 in 210 contractsfrom 1999 to 2006
Contracts for Defense Electronics and Communication Equipment -- Applied Research and Exploratory Development (R&D), Space Flight -- Basic Research (R&D), Other Defense -- Applied Research and Exploratory Development (R&D), Defense Missile and Space Systems -- Applied Research and Exploratory Development (R&D), and moreby Navy, NASA, Army, Air Force, and others Signed by year:2000: $4,509,138; 2001: $4,322,812; 2002: $5,481,174; 2003: $5,982,397; 2004: $5,306,716; 2005: $5,159,149; 2006: $2,674,526.
Biggest contracts:
$1,000,000 with Navy for Defense Electronics and Communication Equipment -- Applied Research and Exploratory Development (R&D). Signed on 2004-11-17. Completion date: 2006-10-27.
$782,000 with NASA for Space Flight -- Basic Research (R&D). Signed on 2001-11-15. Completion date: 2001-10-15.
$750,000 with Army for Other Defense -- Applied Research and Exploratory Development (R&D). Signed on 2000-05-18. Completion date: 2002-08-30.
$636,356 with Navy for Defense Electronics and Communication Equipment -- Applied Research and Exploratory Development (R&D). Signed on 2005-09-27. Completion date: 2006-10-27.
HERLEY INDUSTRIES INC D/B/A HE (10 SONAR DR; small business) : $19,634,670 in 181 contractsfrom 1999 to 2006
Contracts for Miscellaneous Communication Equipment, Switches, Radar Equipment, Airborne, Aircraft Gunnery Fire Control Components, and moreby Air Force, Navy, Defense Logistics Agency Signed by year:2000: $3,642,366; 2001: $1,767,943; 2002: $3,774,711; 2003: $996,868; 2004: $5,770,574; 2005: $2,712,137; 2006: $552,269.
Biggest contracts:
$1,675,100 with Air Force for Miscellaneous Communication Equipment. Signed on 2004-01-23. Completion date: 2005-03-01.
$1,420,385, same as above.Signed on 2002-07-23. Completion date: 2003-09-30.
$995,355, same as above.Signed on 2000-01-13. Completion date: 2000-07-31.
$744,000 with Navy for Switches. Signed on 2004-04-06. Completion date: 2005-01-02.
L L ROWE COMPANY (66 HOLTON ST; small business) : $14,701,700 in 428 contractsfrom 1999 to 2006
Contracts for Miscellaneous Electric Power and Distribution Equipment, Marine Hardware and Hull Items, Switches, Electrical Contact Brushes and Electrodes, and moreby Navy, Defense Logistics Agency Signed by year:2000: $1,442,052; 2001: $1,423,057; 2002: $2,730,443; 2003: $1,972,232; 2004: $2,689,261; 2005: $2,358,215; 2006: $1,995,300.
Biggest contracts:
$411,886 with Navy for Miscellaneous Electric Power and Distribution Equipment. Signed on 2006-06-29. Completion date: 2006-11-30.
$296,544 with Navy for Marine Hardware and Hull Items. Signed on 2002-05-16. Completion date: 2002-05-16.
$285,097 with Defense Logistics Agency for Switches. Signed on 2000-05-01. Completion date: 2001-01-26.
$270,810 with Navy for Electrical Contact Brushes and Electrodes. Signed on 2002-06-04. Completion date: 2002-06-04.
LYTRON INCORPORATED (55 DRAGON CT; small business) : $13,856,785 in 134 contractsfrom 1999 to 2006
Contracts for Heat Exchangers and Steam Condensers, Valves, Nonpowered, Cable, Cord, and Wire Assemblies: Communications Equipment, Fans, Air Circulators, and Blower Equipment, and moreby Navy, Defense Logistics Agency, Air Force, Bureau of the Public Debt, and others Signed by year:2000: $516,798; 2001: $2,518,215; 2002: $2,526,679; 2003: $3,571,558; 2004: $1,740,398; 2005: $2,375,550; 2006: $289,598.
Biggest contracts:
$1,181,970 with Navy for Heat Exchangers and Steam Condensers. Signed on 2005-10-06. Completion date: 2006-04-04.
$769,234, same as above.Signed on 2003-10-23. Completion date: 2005-03-14.
$759,468, same as above.Signed on 2003-04-16. Completion date: 2004-01-13.
$515,496, same as above.Signed on 2002-11-15. Completion date: 2003-10-15.
AGILTRON INC (15 CABOT RD; small business) : $11,561,949 in 81 contractsfrom 2001 to 2006
Contracts for Services -- Advanced Development (R&D), Defense Electronics and Communication Equipment -- Operational Systems Development (R&D), Defense Electronics and Communication Equipment -- Management and Support (R&D), Other Defense -- Applied Research and Exploratory Development (R&D), and moreby Air Force, Defense Advanced Research Projects Agency, Department of Defense, Navy, and others Signed by year:2000: $0; 2001: $333,712; 2002: $1,204,336; 2003: $1,334,107; 2004: $3,978,661; 2005: $3,772,421; 2006: $938,712.
Biggest contracts:
$550,000 with Air Force for Services -- Advanced Development (R&D). Signed on 2004-06-07. Completion date: 2006-07-24.
$499,901 with Air Force for Defense Electronics and Communication Equipment -- Operational Systems Development (R&D). Signed on 2004-07-08. Completion date: 2006-07-31.
$424,971 with Defense Advanced Research Projects Agency for Defense Electronics and Communication Equipment -- Management and Support (R&D). Signed on 2004-03-29. Completion date: 2006-03-31.
$424,943 with Department of Defense for Defense Electronics and Communication Equipment -- Management and Support (R&D). Signed on 2005-03-02. Completion date: 2006-03-31.
VERIZON NEW ENGLAND INC (285 LOCUST STREET) : $5,026,852 in 194 contractsfrom 2000 to 2006
Contracts for ADP Telecommunications and Transmission Services, Telephone and/or Communications Services (includes Telegraph, Telex, and Cablevision Services), Telecommunications Network Management Services, Maintenance, Repair or Alteration of Real Property -- Other Non-Building Facilities, and moreby Department of Defense, Air Force, Defense Information Systems Agency, Office of Policy, Management and Budget/Chief Financial Officer, and others Signed by year:2000: $1,132,750; 2001: $1,117,305; 2002: $2,214,842; 2003: $688,016; 2004: -$299,902; 2005: $163,591; 2006: $10,250.
Biggest contracts:
$1,072,422 with Department of Defense for ADP Telecommunications and Transmission Services. Signed on 2003-09-30. Completion date: 2008-12-16.
$903,000, same as above.Signed on 2001-11-30. Completion date: 2011-11-14.
$900,000 with Air Force for Telephone and/or Communications Services (includes Telegraph, Telex, and Cablevision Services). Signed on 2000-09-28. Completion date: 2001-09-29.
$759,000 with Department of Defense for ADP Telecommunications and Transmission Services. Signed on 2002-01-31. Completion date: 2012-01-06.
MAGNOLIA OPTICAL TECHNOLOGIES, (52B CUMMINGS PARK STE 314; small business) : $3,070,281 in 19 contractsfrom 2002 to 2006
Contracts for Defense Missile and Space Systems -- Advanced Development (R&D), Defense Tank - Automotive -- Operational Systems Development (R&D), Other Defense -- Applied Research and Exploratory Development (R&D), Defense Missile and Space Systems -- Basic Research (R&D), and moreby Army, Missile Defense Agency, Air Force, Department of Defense, and others Signed by year:2000: $0; 2001: $0; 2002: $517,532; 2003: $718,391; 2004: $861,936; 2005: $597,422; 2006: $375,000.
Biggest contracts:
$749,984 with Army for Defense Missile and Space Systems -- Advanced Development (R&D). Signed on 2004-05-07. Completion date: 2006-05-06.
$378,214 with Army for Defense Tank - Automotive -- Operational Systems Development (R&D). Signed on 2002-12-27. Completion date: 2004-12-31.
$339,832, same as above.Signed on 2003-09-15. Completion date: 2004-12-26.
$325,000 with Army for Other Defense -- Applied Research and Exploratory Development (R&D). Signed on 2006-03-23. Completion date: 2008-06-30.
CORNING APPLIED TECHNOLOGIES (14 D GILL STREET; small business) : $2,555,351 in 14 contractsfrom 1999 to 2002
Contracts for Defense Tank - Automotive -- Engineering Development (R&D), Weapons -- Management and Support (R&D), Other Defense -- Basic Research (R&D), Aeronautics and Space Technology -- Basic Research (R&D), and moreby Army, Air Force, Navy, NASA, and others Signed by year:2000: $1,914,422; 2001: $367,918; 2002: -$46,023; 2003: $0; 2004: $0; 2005: $0; 2006: $0.
Biggest contracts:
$374,625 with Army for Defense Tank - Automotive -- Engineering Development (R&D). Signed on 2000-01-05. Completion date: 2001-09-30.
$367,918 with Air Force for Weapons -- Management and Support (R&D). Signed on 2001-02-02. Completion date: 2002-04-30.
$269,993 with Navy for Other Defense -- Basic Research (R&D). Signed on 2000-04-04. Completion date: 2000-09-25.
$255,000 with NASA for Aeronautics and Space Technology -- Basic Research (R&D). Signed on 2000-02-15. Completion date: 2001-03-15.
CYTOMATRIX LLC (50 CUMMINGS PARK; small business) : $2,491,346 in 9 contractsfrom 2000 to 2005
Contracts for Biomedical -- Basic Research (R&D), Other Defense -- Applied Research and Exploratory Development (R&D), Life Sciences -- Applied Research and Exploratory Development (R&D) by Army, National Institutes of Health Signed by year:2000: $349,624; 2001: $350,000; 2002: $0; 2003: $726,120; 2004: $0; 2005: $1,065,602; 2006: $0.
Biggest contracts:
$1,066,000 with Army for Biomedical -- Basic Research (R&D). Signed on 2005-01-19. Completion date: 2005-12-31.
$673,000, same as above.Signed on 2004-03-10. Completion date: 2005-12-31.
$618,000, same as above.Signed on 2003-12-03. Completion date: 2005-12-31.
$350,000 with Army for Other Defense -- Applied Research and Exploratory Development (R&D). Signed on 2001-04-27. Completion date: 2002-04-30.
Top industries in this zip code by the number of employees in 2005:
Administrative and Support and Waste Management and Remediation Services: Temporary Help Services (500-999 employees: 1 establishment, 250-499 employees: 1 establishment, 100-249 employees: 7 establishments, 50-99 employees: 3 establishments, 20-49 employees: 5 establishments, 10-19 employees: 1 establishment, 5-9 employees: 2 establishments, 1-4 employees: 2 establishments)
Administrative and Support and Waste Management and Remediation Services: Janitorial Services (250-499: 1, 100-249: 2, 50-99: 1, 20-49: 1, 10-19: 1, 5-9: 1, 1-4: 7)
Professional, Scientific, and Technical Services: Research and Development in the Physical, Engineering, and Life Sciences (250-499: 1, 50-99: 2, 20-49: 4, 10-19: 6, 5-9: 7, 1-4: 13)
Health Care and Social Assistance: Specialty (except Psychiatric and Substance Abuse) Hospitals (500-999: 1)
Management of Companies and Enterprises: Corporate, Subsidiary, and Regional Managing Offices (100-249: 2, 50-99: 2, 20-49: 5, 10-19: 2, 5-9: 4, 1-4: 2)
People in group quarters in 2010:
238 people in nursing facilities/skilled-nursing facilities
70 people in group homes intended for adults
8 people in other noninstitutional facilities
6 people in residential treatment centers for adults
People in group quarters in 2000:
100 people in nursing homes
77 people in homes or halfway houses for drug/alcohol abuse
34 people in other noninstitutional group quarters
23 people in homes for the mentally retarded
8 people in homes for the mentally ill
2 people in religious group quarters
Fatal accident statistics in 2014:
Fatal accident count: 3
Vehicles involved in fatal accidents: 5
Fatal accidents caused by drunken drivers: 0
Fatalities: 3
Persons involved in fatal accidents: 5
Pedestrians involved in fatal accidents: 0
Fatal accident statistics in 2012:
Fatal accident count: 3
Vehicles involved in fatal accidents: 4
Fatal accidents caused by drunken drivers: 2
Fatalities: 3
Persons involved in fatal accidents: 6
Pedestrians involved in fatal accidents: 1
Home Mortgage Disclosure Act Aggregated Statistics For Year 2009 (Based on 13 full tracts)
A) FHA, FSA/RHS & VA Home Purchase Loans
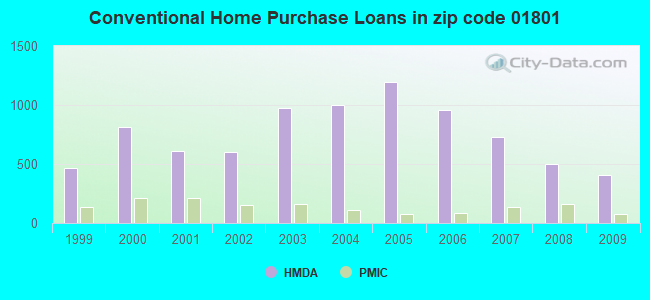
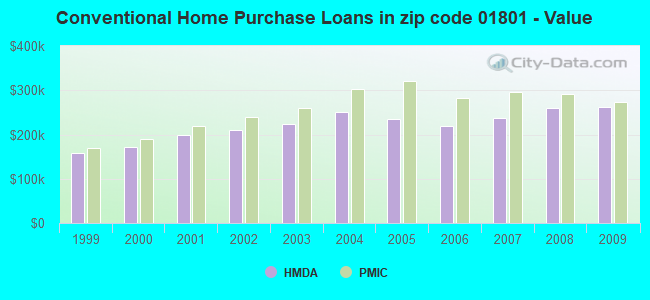
B) Conventional Home Purchase Loans
C) Refinancings
D) Home Improvement Loans
E) Loans on Dwellings For 5+ Families
F) Non-occupant Loans on < 5 Family Dwellings (A B C & D)
Number
Average Value
Number
Average Value
Number
Average Value
Number
Average Value
Number
Average Value
Number
Average Value
LOANS ORIGINATED
209
$307,203
405
$261,603
2,150
$246,108
119
$129,615
6
$1,648,923
66
$210,890
APPLICATIONS APPROVED, NOT ACCEPTED
9
$241,242
18
$239,873
135
$269,168
24
$38,123
4
$7,814,520
10
$240,748
APPLICATIONS DENIED
38
$253,781
51
$230,710
445
$286,232
36
$88,541
0
$0
40
$235,932
APPLICATIONS WITHDRAWN
30
$278,073
43
$251,880
311
$267,148
10
$169,296
2
$15,333,780
8
$218,456
FILES CLOSED FOR INCOMPLETENESS
2
$223,440
7
$332,431
109
$262,856
7
$144,503
0
$0
4
$240,058
Aggregated Statistics For Year 2008 (Based on 13 full tracts)
A) FHA, FSA/RHS & VA Home Purchase Loans
B) Conventional Home Purchase Loans
C) Refinancings
D) Home Improvement Loans
E) Loans on Dwellings For 5+ Families
F) Non-occupant Loans on < 5 Family Dwellings (A B C & D)
G) Loans On Manufactured Home Dwelling (A B C & D)
Number
Average Value
Number
Average Value
Number
Average Value
Number
Average Value
Number
Average Value
Number
Average Value
Number
Average Value
LOANS ORIGINATED
130
$307,232
500
$260,387
941
$249,068
116
$99,100
11
$4,142,303
91
$249,777
2
$86,685
APPLICATIONS APPROVED, NOT ACCEPTED
8
$317,914
53
$208,643
147
$249,160
28
$61,488
2
$648,375
18
$144,721
0
$0
APPLICATIONS DENIED
31
$262,875
74
$276,831
398
$267,144
89
$69,204
0
$0
17
$180,873
0
$0
APPLICATIONS WITHDRAWN
12
$316,207
65
$244,441
218
$287,548
14
$189,819
1
$760,000
20
$204,809
0
$0
FILES CLOSED FOR INCOMPLETENESS
3
$271,073
18
$304,450
51
$263,361
4
$169,788
0
$0
2
$142,385
0
$0
Aggregated Statistics For Year 2007 (Based on 13 full tracts)
A) FHA, FSA/RHS & VA Home Purchase Loans
B) Conventional Home Purchase Loans
C) Refinancings
D) Home Improvement Loans
E) Loans on Dwellings For 5+ Families
F) Non-occupant Loans on < 5 Family Dwellings (A B C & D)
G) Loans On Manufactured Home Dwelling (A B C & D)
Number
Average Value
Number
Average Value
Number
Average Value
Number
Average Value
Number
Average Value
Number
Average Value
Number
Average Value
LOANS ORIGINATED
15
$324,829
727
$237,671
1,056
$228,997
293
$108,045
11
$726,821
106
$250,032
2
$79,650
APPLICATIONS APPROVED, NOT ACCEPTED
0
$0
130
$216,225
204
$239,931
36
$85,653
0
$0
22
$216,421
0
$0
APPLICATIONS DENIED
2
$293,230
118
$207,583
631
$263,409
115
$78,899
0
$0
30
$183,214
1
$385,000
APPLICATIONS WITHDRAWN
2
$173,565
109
$207,050
257
$235,951
22
$123,218
2
$418,150
34
$221,748
0
$0
FILES CLOSED FOR INCOMPLETENESS
0
$0
31
$240,022
140
$275,881
5
$58,832
0
$0
12
$268,081
0
$0
Aggregated Statistics For Year 2006 (Based on 13 full tracts)
A) FHA, FSA/RHS & VA Home Purchase Loans
B) Conventional Home Purchase Loans
C) Refinancings
D) Home Improvement Loans
E) Loans on Dwellings For 5+ Families
F) Non-occupant Loans on < 5 Family Dwellings (A B C & D)
G) Loans On Manufactured Home Dwelling (A B C & D)
Number
Average Value
Number
Average Value
Number
Average Value
Number
Average Value
Number
Average Value
Number
Average Value
Number
Average Value
LOANS ORIGINATED
10
$299,920
961
$220,331
1,529
$213,680
360
$87,652
9
$504,469
146
$258,768
6
$40,513
APPLICATIONS APPROVED, NOT ACCEPTED
0
$0
120
$208,722
235
$224,100
46
$121,678
0
$0
31
$248,310
0
$0
APPLICATIONS DENIED
1
$309,000
246
$225,330
680
$250,369
154
$88,309
4
$249,375
43
$215,523
2
$510,795
APPLICATIONS WITHDRAWN
0
$0
112
$221,354
576
$248,427
29
$172,673
2
$74,815
27
$206,091
0
$0
FILES CLOSED FOR INCOMPLETENESS
0
$0
4
$184,695
109
$326,029
7
$28,480
0
$0
6
$250,988
2
$358,705
Aggregated Statistics For Year 2005 (Based on 13 full tracts)
A) FHA, FSA/RHS & VA Home Purchase Loans
B) Conventional Home Purchase Loans
C) Refinancings
D) Home Improvement Loans
E) Loans on Dwellings For 5+ Families
F) Non-occupant Loans on < 5 Family Dwellings (A B C & D)
G) Loans On Manufactured Home Dwelling (A B C & D)
Number
Average Value
Number
Average Value
Number
Average Value
Number
Average Value
Number
Average Value
Number
Average Value
Number
Average Value
LOANS ORIGINATED
8
$260,214
1,199
$234,540
1,959
$233,428
320
$136,344
6
$1,639,000
176
$256,987
2
$8,945
APPLICATIONS APPROVED, NOT ACCEPTED
0
$0
106
$223,798
231
$246,015
51
$92,547
2
$1,130,005
27
$205,969
0
$0
APPLICATIONS DENIED
0
$0
288
$239,886
677
$257,823
133
$122,078
1
$550,000
69
$204,733
2
$458,850
APPLICATIONS WITHDRAWN
0
$0
300
$260,451
895
$259,269
61
$163,927
2
$349,125
65
$335,251
0
$0
FILES CLOSED FOR INCOMPLETENESS
0
$0
30
$210,166
96
$269,287
8
$113,796
0
$0
11
$308,756
2
$289,275
Aggregated Statistics For Year 2004 (Based on 13 full tracts)
A) FHA, FSA/RHS & VA Home Purchase Loans
B) Conventional Home Purchase Loans
C) Refinancings
D) Home Improvement Loans
E) Loans on Dwellings For 5+ Families
F) Non-occupant Loans on < 5 Family Dwellings (A B C & D)
G) Loans On Manufactured Home Dwelling (A B C & D)
Number
Average Value
Number
Average Value
Number
Average Value
Number
Average Value
Number
Average Value
Number
Average Value
Number
Average Value
LOANS ORIGINATED
4
$229,265
1,002
$250,011
2,196
$223,021
273
$118,659
16
$383,230
199
$250,124
2
$74,670
APPLICATIONS APPROVED, NOT ACCEPTED
2
$272,315
93
$249,910
272
$218,731
54
$71,122
0
$0
12
$219,246
0
$0
APPLICATIONS DENIED
0
$0
137
$247,716
551
$240,037
143
$66,199
0
$0
34
$290,399
6
$70,905
APPLICATIONS WITHDRAWN
0
$0
107
$244,673
781
$237,828
58
$142,325
2
$372,355
29
$194,883
2
$421,130
FILES CLOSED FOR INCOMPLETENESS
0
$0
16
$253,346
100
$246,585
10
$90,389
0
$0
8
$239,226
0
$0
Aggregated Statistics For Year 2003 (Based on 13 full tracts)
A) FHA, FSA/RHS & VA Home Purchase Loans
B) Conventional Home Purchase Loans
C) Refinancings
D) Home Improvement Loans
E) Loans on Dwellings For 5+ Families
F) Non-occupant Loans on < 5 Family Dwellings (A B C & D)
Number
Average Value
Number
Average Value
Number
Average Value
Number
Average Value
Number
Average Value
Number
Average Value
LOANS ORIGINATED
26
$247,094
977
$224,440
5,565
$188,625
168
$47,170
11
$933,790
291
$210,478
APPLICATIONS APPROVED, NOT ACCEPTED
0
$0
95
$239,005
608
$190,889
48
$52,412
0
$0
24
$165,074
APPLICATIONS DENIED
0
$0
68
$231,673
842
$212,865
83
$55,636
0
$0
49
$196,858
APPLICATIONS WITHDRAWN
0
$0
97
$225,164
892
$198,159
37
$51,222
0
$0
22
$223,549
FILES CLOSED FOR INCOMPLETENESS
0
$0
26
$260,844
91
$213,612
16
$27,934
0
$0
8
$138,352
Aggregated Statistics For Year 2002 (Based on 10 full tracts)
A) FHA, FSA/RHS & VA Home Purchase Loans
B) Conventional Home Purchase Loans
C) Refinancings
D) Home Improvement Loans
E) Loans on Dwellings For 5+ Families
F) Non-occupant Loans on < 5 Family Dwellings (A B C & D)
Number
Average Value
Number
Average Value
Number
Average Value
Number
Average Value
Number
Average Value
Number
Average Value
LOANS ORIGINATED
18
$202,218
599
$209,372
3,273
$180,386
167
$63,873
14
$1,323,044
173
$208,215
APPLICATIONS APPROVED, NOT ACCEPTED
0
$0
74
$219,535
386
$177,596
72
$73,375
0
$0
14
$161,191
APPLICATIONS DENIED
2
$217,455
50
$203,400
378
$191,346
86
$52,828
0
$0
28
$174,174
APPLICATIONS WITHDRAWN
4
$223,588
74
$255,571
468
$186,410
22
$38,110
0
$0
24
$226,025
FILES CLOSED FOR INCOMPLETENESS
0
$0
22
$249,640
68
$190,813
4
$24,772
0
$0
8
$147,262
Aggregated Statistics For Year 2001 (Based on 10 full tracts)
A) FHA, FSA/RHS & VA Home Purchase Loans
B) Conventional Home Purchase Loans
C) Refinancings
D) Home Improvement Loans
E) Loans on Dwellings For 5+ Families
F) Non-occupant Loans on < 5 Family Dwellings (A B C & D)
Number
Average Value
Number
Average Value
Number
Average Value
Number
Average Value
Number
Average Value
Number
Average Value
LOANS ORIGINATED
52
$197,059
607
$198,382
2,527
$173,327
209
$52,728
2
$99,090
137
$202,893
APPLICATIONS APPROVED, NOT ACCEPTED
2
$110,725
68
$189,685
280
$159,929
30
$41,109
0
$0
14
$170,386
APPLICATIONS DENIED
8
$234,412
50
$222,439
364
$141,168
101
$42,153
2
$311,220
50
$159,500
APPLICATIONS WITHDRAWN
6
$231,403
52
$186,728
402
$165,619
34
$63,274
2
$169,575
18
$176,395
FILES CLOSED FOR INCOMPLETENESS
0
$0
12
$151,309
78
$164,877
0
$0
0
$0
4
$153,615
Aggregated Statistics For Year 2000 (Based on 10 full tracts)
A) FHA, FSA/RHS & VA Home Purchase Loans
B) Conventional Home Purchase Loans
C) Refinancings
D) Home Improvement Loans
E) Loans on Dwellings For 5+ Families
F) Non-occupant Loans on < 5 Family Dwellings (A B C & D)
Number
Average Value
Number
Average Value
Number
Average Value
Number
Average Value
Number
Average Value
Number
Average Value
LOANS ORIGINATED
34
$180,639
810
$171,806
627
$128,685
207
$32,365
8
$654,800
76
$164,123
APPLICATIONS APPROVED, NOT ACCEPTED
6
$137,415
80
$188,846
102
$123,288
64
$31,548
0
$0
6
$124,022
APPLICATIONS DENIED
8
$203,325
96
$196,023
225
$111,893
102
$35,467
0
$0
26
$125,099
APPLICATIONS WITHDRAWN
4
$215,460
76
$183,486
185
$99,931
20
$53,945
0
$0
14
$120,982
FILES CLOSED FOR INCOMPLETENESS
2
$249,375
2
$169,575
66
$154,273
0
$0
0
$0
0
$0
Aggregated Statistics For Year 1999 (Based on 6 full tracts)
A) FHA, FSA/RHS & VA Home Purchase Loans
B) Conventional Home Purchase Loans
C) Refinancings
D) Home Improvement Loans
E) Loans on Dwellings For 5+ Families
F) Non-occupant Loans on < 5 Family Dwellings (A B C & D)
2002 - 2018 National Fire Incident Reporting System (NFIRS) incidents
According to the data from the years 2002 - 2018 the average number of fires per year is 114. The highest number of reported fire incidents - 247 took place in 2016, and the least - 22 in 2003. The data has a rising trend.
When looking into fire subcategories, the most incidents belonged to: Structure Fires (55.1%), and Outside Fires (23.7%).
Fire incident types reported to NFIRS in Zip Code 01801


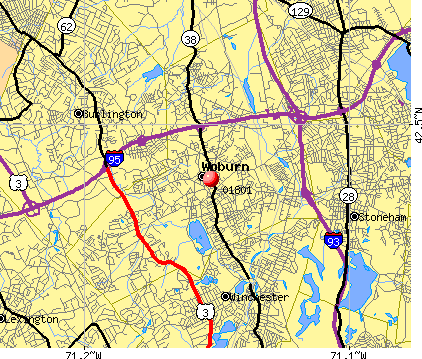 Nearest zip codes: 01890, 01803, 02180, 01867, 02474, 02420.


 According to the data from the years 2002 - 2018 the average number of fires per year is 114. The highest number of reported fire incidents - 247 took place in 2016, and the least - 22 in 2003. The data has a rising trend.
 When looking into fire subcategories, the most incidents belonged to: Structure Fires (55.1%), and Outside Fires (23.7%).