Estimated zip code population in 2022: 18,350 Zip code population in 2010: 17,416 Zip code population in 2000: 18,268
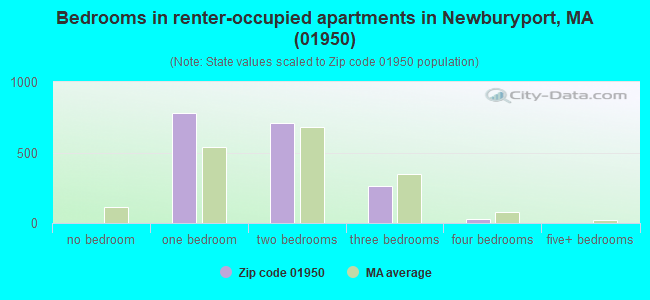
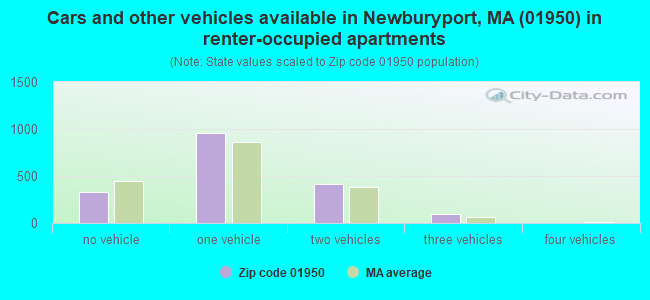
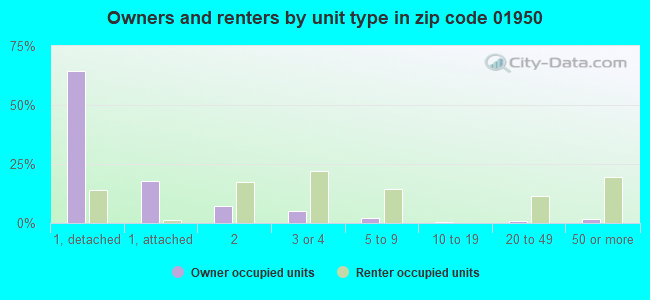
Houses and condos: 8,340 Renter-occupied apartments: 1,790
% of renters here:
23%
State:
38%
March 2022 cost of living index in zip code 01950: 134.5 (high, U.S. average is 100)
Land area: 8.3 sq. mi. Water area: 2.3 sq. mi.
Population density: 2,198 people per square mile
(low).
OSM Map
Google Map
MSN Map
OSM Map
General Map
Google Map
MSN Map
OSM Map
Google Map
MSN Map
OSM Map
Google Map
MSN Map
Please wait while loading the map...
Real estate property taxes paid for housing units in 2022:
This zip code:
1.0% ($7,800)
Massachusetts:
1.0% ($5,536)
Median real estate property taxes paid for housing units with mortgages in 2022: $7,898 (1.0%) Median real estate property taxes paid for housing units with no mortgage in 2022: $7,539 (1.0%)
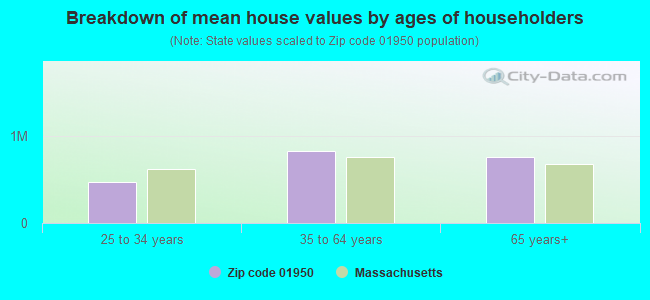
Estimated median house/condo value in 2022: $814,592
01950:
$814,592
Massachusetts:
$534,700
According to our research of Massachusetts and other state lists, there were 3 registered sex offenders living in 01950 zip code as of April 26, 2024. The ratio of all residents to sex offenders in zip code 01950 is 6,031 to 1. The ratio of registered sex offenders to all residents in this zip code is much lower than the state average.
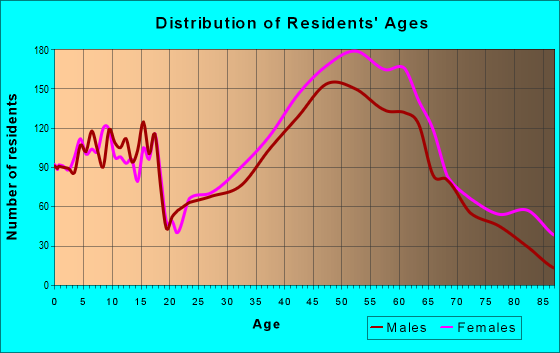
Median resident age:
This zip code:
47.1 years
Massachusetts median age:
40.3 years
Average household size:
This zip code:
2.3 people
Massachusetts:
2.4 people
Averages for the 2020 tax year for zip code 01950, filed in 2021:
Average Adjusted Gross Income (AGI) in 2020: $144,449 (Individual Income Tax Returns)
Here:
$144,449
State:
$105,130
Salary/wage: $120,822 (reported on 76.1% of returns)
Here:
$120,822
State:
$82,951
(% of AGI for various income ranges: 1066.3% for AGIs below $25k, 3354.9% for AGIs $25k-50k, 6200.3% for AGIs $50k-75k, 8884.0% for AGIs $75k-100k, 19867.3% for AGIs $100k-200k, 110033.0% for AGIs over 200k)
Taxable interest for individuals: $1,962 (reported on 55.2% of returns)
This zip code:
$1,962
Massachusetts:
$2,361
(% of AGI for various income ranges: 40.6% for AGIs below $25k, 61.2% for AGIs $25k-50k, 120.6% for AGIs $50k-75k, 157.2% for AGIs $75k-100k, 233.6% for AGIs $100k-200k, 1081.9% for AGIs over 200k)
Ordinary dividends: $8,806 (reported on 38.5% of returns)
Here:
$8,806
State:
$10,365
(% of AGI for various income ranges: 77.0% for AGIs below $25k, 169.9% for AGIs $25k-50k, 287.5% for AGIs $50k-75k, 420.2% for AGIs $75k-100k, 729.0% for AGIs $100k-200k, 3739.2% for AGIs over 200k)
Net capital gain/loss in AGI: +$40,628 (reported on 35.2% of returns)
Here:
+$40,628
State:
+$48,178
(% of AGI for various income ranges: 38.9% for AGIs below $25k, 109.4% for AGIs $25k-50k, 344.3% for AGIs $50k-75k, 352.4% for AGIs $75k-100k, 1092.1% for AGIs $100k-200k, 23697.5% for AGIs over 200k)
Profit/loss from business: +$31,300 (reported on 20.2% of returns)
Here:
+$31,300
State:
+$20,792
(% of AGI for various income ranges: 133.2% for AGIs below $25k, 388.1% for AGIs $25k-50k, 496.1% for AGIs $50k-75k, 726.0% for AGIs $75k-100k, 1532.5% for AGIs $100k-200k, 6668.5% for AGIs over 200k)
Taxable individual retirement arrangement distribution: $29,283 (reported on 15.2% of returns)
01950:
$29,283
Massachusetts:
$22,790
(% of AGI for various income ranges: 107.8% for AGIs below $25k, 284.9% for AGIs $25k-50k, 541.8% for AGIs $50k-75k, 826.4% for AGIs $75k-100k, 1399.3% for AGIs $100k-200k, 3464.5% for AGIs over 200k)
Self-employed (Keogh) retirement plans: $24,874 (reported on 2.7% of returns)
01950:
$24,874
Massachusetts:
$26,868
(% of AGI for various income ranges: 64.2% for AGIs $50k-75k, 124.5% for AGIs $100k-200k, 945.1% for AGIs over 200k)
Total itemized deductions: $32,648 (reported on 23.1% of returns)
Here:
$32,648
State:
$36,722
(% of AGI for various income ranges: 220.9% for AGIs below $25k, 318.5% for AGIs $25k-50k, 682.2% for AGIs $50k-75k, 1197.0% for AGIs $75k-100k, 1779.1% for AGIs $100k-200k, 7704.9% for AGIs over 200k)
Charity contributions: $6,228 (reported on 18.9% of returns)
Here:
$6,228
State:
$12,529
(% of AGI for various income ranges: 9.9% for AGIs below $25k, 21.2% for AGIs $25k-50k, 60.0% for AGIs $50k-75k, 109.2% for AGIs $75k-100k, 178.0% for AGIs $100k-200k, 1630.6% for AGIs over 200k)
Taxes paid: $9,203 (reported on 23.0% of returns)
01950:
$9,203
State:
$8,782
(% of AGI for various income ranges: 45.3% for AGIs below $25k, 92.0% for AGIs $25k-50k, 239.2% for AGIs $50k-75k, 405.8% for AGIs $75k-100k, 608.4% for AGIs $100k-200k, 1861.9% for AGIs over 200k)
Earned income credit: $1,267 (reported on 3.9% of returns)
Here:
$1,267
State:
$1,909
(% of AGI for various income ranges: 23.0% for AGIs below $25k, 23.3% for AGIs $25k-50k)
Percentage of individuals using paid preparers for their 2020 taxes: 91.9%
Here:
92%
State:
92%
(% for various income ranges: 88.1% for AGIs below $25k, 89.9% for AGIs $25k-50k, 90.2% for AGIs $50k-75k, 93.2% for AGIs $75k-100k, 94.3% for AGIs $100k-200k, 95.8% for AGIs over 200k)
Averages for the 2012 tax year for zip code 01950, filed in 2013:
Average Adjusted Gross Income (AGI) in 2012: $105,945 (Individual Income Tax Returns)
Here:
$105,945
State:
$81,425
Salary/wage: $86,794 (reported on 79.8% of returns)
Here:
$86,794
State:
$64,752
(% of AGI for various income ranges: 59.4% for AGIs below $25k, 65.3% for AGIs $25k-50k, 69.2% for AGIs $50k-75k, 71.6% for AGIs $75k-100k, 77.8% for AGIs $100k-200k, 57.0% for AGIs over 200k)
Taxable interest for individuals: $1,467 (reported on 54.7% of returns)
This zip code:
$1,467
Massachusetts:
$2,136
(% of AGI for various income ranges: 1.9% for AGIs below $25k, 1.1% for AGIs $25k-50k, 1.0% for AGIs $50k-75k, 0.8% for AGIs $75k-100k, 0.6% for AGIs $100k-200k, 0.7% for AGIs over 200k)
Ordinary dividends: $7,261 (reported on 34.9% of returns)
Here:
$7,261
State:
$9,473
(% of AGI for various income ranges: 4.0% for AGIs below $25k, 2.7% for AGIs $25k-50k, 2.0% for AGIs $50k-75k, 2.1% for AGIs $75k-100k, 1.8% for AGIs $100k-200k, 2.7% for AGIs over 200k)
Net capital gain/loss in AGI: +$16,391 (reported on 28.5% of returns)
Here:
+$16,391
State:
+$31,437
(% of AGI for various income ranges: 0.9% for AGIs $25k-50k, 0.8% for AGIs $50k-75k, 1.5% for AGIs $75k-100k, 2.0% for AGIs $100k-200k, 7.6% for AGIs over 200k)
Profit/loss from business: +$24,047 (reported on 21.2% of returns)
Here:
+$24,047
State:
+$20,662
(% of AGI for various income ranges: 12.1% for AGIs below $25k, 9.5% for AGIs $25k-50k, 5.8% for AGIs $50k-75k, 5.9% for AGIs $75k-100k, 5.7% for AGIs $100k-200k, 3.0% for AGIs over 200k)
Taxable individual retirement arrangement distribution: $18,728 (reported on 14.1% of returns)
01950:
$18,728
Massachusetts:
$18,892
(% of AGI for various income ranges: 5.6% for AGIs below $25k, 4.0% for AGIs $25k-50k, 3.8% for AGIs $50k-75k, 3.3% for AGIs $75k-100k, 2.5% for AGIs $100k-200k, 1.7% for AGIs over 200k)
Self-employment retirement plans: $21,211 (reported on 2.1% of returns)
01950:
$21,211
Massachusetts:
$20,669
(% of AGI for various income ranges: 0.5% for AGIs below $25k, 0.6% for AGIs $50k-75k, 0.4% for AGIs $100k-200k, 0.5% for AGIs over 200k)
Total itemized deductions: $27,959 (17% of AGI, reported on 53.4% of returns)
Here:
$27,959
State:
$28,907
Here:
16.6% of AGI
State:
18.2% of AGI
(% of AGI for various income ranges: 24.2% for AGIs below $25k, 15.8% for AGIs $25k-50k, 15.8% for AGIs $50k-75k, 17.7% for AGIs $75k-100k, 17.0% for AGIs $100k-200k, 10.7% for AGIs over 200k)
Charity contributions: $2,379 (reported on 45.5% of returns)
Here:
$2,379
State:
$4,208
(% of AGI for various income ranges: 1.0% for AGIs below $25k, 1.0% for AGIs $25k-50k, 1.1% for AGIs $50k-75k, 1.1% for AGIs $75k-100k, 1.1% for AGIs $100k-200k, 0.9% for AGIs over 200k)
Taxes paid: $13,655 (reported on 53.2% of returns)
01950:
$13,655
State:
$13,303
(% of AGI for various income ranges: 6.5% for AGIs below $25k, 5.1% for AGIs $25k-50k, 6.5% for AGIs $50k-75k, 7.6% for AGIs $75k-100k, 8.2% for AGIs $100k-200k, 6.3% for AGIs over 200k)
Earned income credit: $1,256 (reported on 5.9% of returns)
Here:
$1,256
State:
$1,971
(% of AGI for various income ranges: 2.0% for AGIs below $25k, 0.2% for AGIs $25k-50k)
Percentage of individuals using paid preparers for their 2012 taxes: 60.6%
Here:
61%
State:
56%
(% for various income ranges: 54.4% for AGIs below $25k, 57.3% for AGIs $25k-50k, 59.8% for AGIs $50k-75k, 61.7% for AGIs $75k-100k, 64.2% for AGIs $100k-200k, 74.5% for AGIs over 200k)
Averages for the 2004 tax year for zip code 01950, filed in 2005:
Average Adjusted Gross Income (AGI) in 2004: $69,258 (Individual Income Tax Returns)
Here:
$69,258
State:
$62,877
Salary/wage: $64,960 (reported on 81.1% of returns)
Here:
$64,960
State:
$52,969
(% of AGI for various income ranges: 141.2% for AGIs below $10k, 58.1% for AGIs $10k-25k, 74.1% for AGIs $25k-50k, 77.0% for AGIs $50k-75k, 80.6% for AGIs $75k-100k, 75.6% for AGIs over 100k)
Taxable interest for individuals: $1,400 (reported on 68.7% of returns)
This zip code:
$1,400
Massachusetts:
$1,945
(% of AGI for various income ranges: 15.9% for AGIs below $10k, 4.1% for AGIs $10k-25k, 2.2% for AGIs $25k-50k, 1.3% for AGIs $50k-75k, 0.8% for AGIs $75k-100k, 1.1% for AGIs over 100k)
Taxable dividends: $3,085 (reported on 39.1% of returns)
Here:
$3,085
State:
$5,323
(% of AGI for various income ranges: 14.0% for AGIs below $10k, 3.4% for AGIs $10k-25k, 1.6% for AGIs $25k-50k, 1.7% for AGIs $50k-75k, 1.4% for AGIs $75k-100k, 1.6% for AGIs over 100k)
Net capital gain/loss: +$10,281 (reported on 31.9% of returns)
Here:
+$10,281
State:
+$20,377
(% of AGI for various income ranges: -4.8% for AGIs below $10k, 0.9% for AGIs $10k-25k, 0.8% for AGIs $25k-50k, 1.4% for AGIs $50k-75k, 1.6% for AGIs $75k-100k, 7.4% for AGIs over 100k)
Profit/loss from business: +$19,901 (reported on 21.1% of returns)
Here:
+$19,901
State:
+$17,837
(% of AGI for various income ranges: 17.6% for AGIs below $10k, 12.3% for AGIs $10k-25k, 6.8% for AGIs $25k-50k, 6.4% for AGIs $50k-75k, 6.0% for AGIs $75k-100k, 5.3% for AGIs over 100k)
IRA payment deduction: $3,281 (reported on 3.8% of returns)
01950:
$3,281
Massachusetts:
$3,100
(% of AGI for various income ranges: 0.5% for AGIs $10k-25k, 0.4% for AGIs $25k-50k, 0.3% for AGIs $50k-75k, 0.2% for AGIs $75k-100k, 0.1% for AGIs over 100k)
Self-employed pension: $12,013 (reported on 2.6% of returns)
Here:
$12,013
Massachusetts:
$14,516
(% of AGI for various income ranges: 0.2% for AGIs $10k-25k, 0.3% for AGIs $25k-50k, 0.4% for AGIs $50k-75k, 0.4% for AGIs $75k-100k, 0.5% for AGIs over 100k)
Total itemized deductions: $21,886 (21% of AGI, reported on 53.6% of returns)
Here:
$21,886
State:
$22,573
Here:
20.6% of AGI
State:
19.5% of AGI
(% of AGI for various income ranges: 44.2% for AGIs below $10k, 21.3% for AGIs $10k-25k, 16.2% for AGIs $25k-50k, 18.4% for AGIs $50k-75k, 20.3% for AGIs $75k-100k, 15.3% for AGIs over 100k)
Charity contributions deductions: $2,009 (2% of AGI, reported on 49.1% of returns)
Here:
$2,009
State:
$3,295
Here:
1.8% of AGI
State:
2.7% of AGI
(% of AGI for various income ranges: 1.6% for AGIs below $10k, 1.5% for AGIs $10k-25k, 1.2% for AGIs $25k-50k, 1.4% for AGIs $50k-75k, 1.5% for AGIs $75k-100k, 1.4% for AGIs over 100k)
Total tax: $11,980 (reported on 85.2% of returns)
01950:
$11,980
State:
$11,494
(% of AGI for various income ranges: 6.0% for AGIs below $10k, 5.8% for AGIs $10k-25k, 9.1% for AGIs $25k-50k, 10.8% for AGIs $50k-75k, 11.1% for AGIs $75k-100k, 18.4% for AGIs over 100k)
Earned income credit: $1,071 (reported on 5.5% of returns)
Here:
$1,071
State:
$1,518
Percentage of individuals using paid preparers for their 2004 taxes: 60.5%
Here:
60%
State:
58%
(% for various income ranges: 51.2% for AGIs below $10k, 60.7% for AGIs $10k-25k, 57.4% for AGIs $25k-50k, 62.8% for AGIs $50k-75k, 62.6% for AGIs $75k-100k, 67.7% for AGIs over 100k)
Likely homosexual households (counted as self-reported same-sex unmarried-partner households)
Lesbian couples: 0.6% of all households
Gay men: 0.0% of all households
Household received Food Stamps/SNAP in the past 12 months: 420 Household did not receive Food Stamps/SNAP in the past 12 months: 7,183
Women who had a birth in the past 12 months: 110 (113 now married, 2 unmarried) Women who did not have a birth in the past 12 months: 3,607 (1,681 now married, 1,902 unmarried)
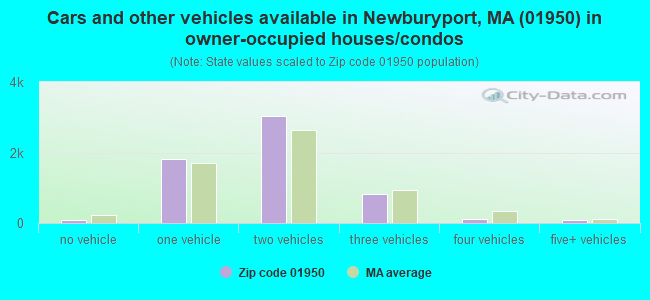
Housing units in zip code 01950 with a mortgage: 3,826 (545 second mortgage, 29 home equity loan, 445 both second mortgage and home equity loan) Houses without a mortgage: 86
Median monthly owner costs for units with a mortgage: $3,137 Median monthly owner costs for units without a mortgage: $1,251
Residents with income below the poverty level in 2022:
This zip code:
6.0%
Whole state:
10.4%
Residents with income below 50% of the poverty level in 2022:
This zip code:
3.8%
Whole state:
5.1%
Median number of rooms in houses and condos:
Here:
6.8
State:
6.5
Median number of rooms in apartments:
Here:
3.7
State:
4.0
Notable locations in this zip code not listed on our city pages
Notable locations in zip code 01950: Curzon Mill (A), Dexter Industrial Green (B), Newburyport Station (C), Arrowhead Farm (D), Port Plaza (E), Newburyport Harbor Light (F), Healy House (G), Newburyport City Hall (H), Newburyport Fire Department (I), Greater Newburyport Chamber of Commerce (J), Rogers Medical Library (K), Newburyport Public Library (L), Newburyport High School Library (M), Dalton House (N), Cushing House (O). Display/hide their locations on the map
Churches in zip code 01950 include: First Religious Society Church (A), First Church of Christ Scientist (B), Central Congregational Church (C), Assembly of God Church (D). Display/hide their locations on the map
Cemeteries: Sawyer Hill Burying Ground (1), Saint Marys Cemetery (2), Belleville Cemetery (3), Highland Cemetery (4), Oak Hill Cemetery (5), First Parish Burying Ground (6). Display/hide their locations on the map
Lakes and reservoirs: Frog Pond (A), Upper Artichoke Reservoir (B), Frog Pond (C), Lower Artichoke Reservoir (D), Artichoke River Reservoir (E). Display/hide their locations on the map
In group quarters: 331 (-1 institutionalized population)
Size of family households: 2,507 2-persons, 1,102 3-persons, 919 4-persons, 284 5-persons, 242 6-persons, 9 7-or-more-persons
Size of nonfamily households: 2,193 1-person, 492 2-persons
3,356 married couples with children.
583 single-parent households (53 men, 530 women).
93.1% of residents of 01950 zip code speak English at home.
1.2% of residents speak Spanish at home (85% very well, 14% well, 1% not at all).
5.0% of residents speak other Indo-European language at home (49% very well, 20% well, 17% not well, 14% not at all).
0.2% of residents speak Asian or Pacific Island language at home (85% very well, 15% well).
0.3% of residents speak other language at home (100% very well).
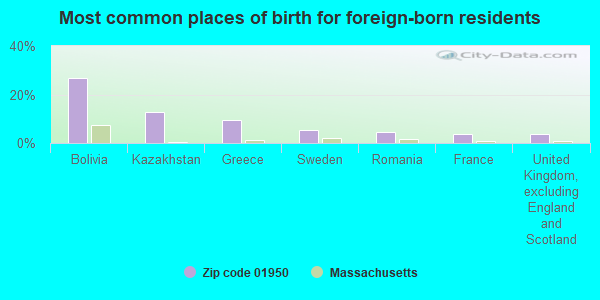
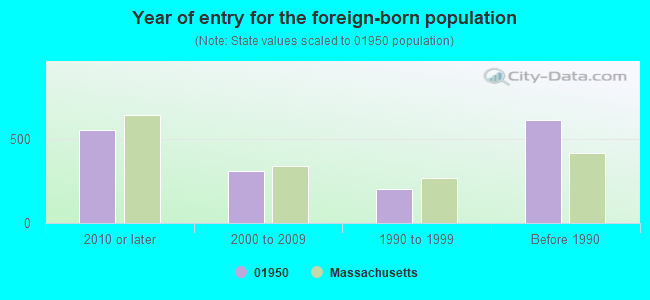
Foreign born population: 1,439 (7.8%) (46.5% of them are naturalized citizens)
Major facilities with environmental interests located in this zip code:
NEWBURYPORT WASTEWATER TREATMENT PLANT (157 WATER STREET in NEWBURYPORT, MA)
AIR MINOR (AIRS/AFS) - ICIS-, ENFORCEMENT/COMPLIANCE ACTIVITY CRITERIA AND HAZARDOUS AIR POLLUTANT INVENTORY (Inventory of air pollution sources) National Pollutant Discharge Elimination System MAJOR (Tracking pollutant discharge elimination systems) - permit - ICIS-, ENFORCEMENT/COMPLIANCE ACTIVITY Conditionally Exempt Small Quantity Generators, less than 100 kg/month of hazardous waste (Resource Conservation and Recovery Act (tracking hazardous waste)) - notification Business SIC classification: SEWERAGE SYSTEMS Organizations: NEWBURYPORT W W T F (CONTACT/OPERATOR)
, CITY OF NEWBURYPORT (CONTACT/OWNER)
Alternative names: NEWBURYPORT TOWN OF W W T P, NEWBURYPORT W P C F, NEWBURYPORT WWTP
M & V ELECTROPLATING CORPORATION (5 GREENLEAF ST. in NEWBURYPORT, MA)
AIR MINOR (AIRS/AFS) SUPERFUND (Superfund database) (Integrated Compliance Information System) - ICIS-01-1999-0175, FORMAL ENFORCEMENT ACTION, ICIS-01-1995-0084, ICIS-01-1993-0024, ICIS-01-1996-0131, ICIS-01-1995-0084, COMPLIANCE ACTIVITY (Tracking inspections of insecticide, fungicide, and rodenticide, and toxic substances) (Resource Conservation and Recovery Act (tracking hazardous waste)) TRI REPORTER (Tracking of toxic chemicals releasing facilities) Business SIC and NAICS classification: ELECTROPLATING, PLATING, POLISHING, ANODIZING, AND COLORING Alternative names: M&V ELECTROPLATING C, M + V ELECTROPLATING CORP
DYNAMIC CHROMIUM INDUSTRIES (50 PARKER ST #5 in NEWBURYPORT, MA)
AIR MINOR (AIRS/AFS) STATE MASTER (MA-EPICS) - NEI-1210449, CRITERIA AND HAZARDOUS AIR POLLUTANT INVENTORY, RCRAINFO-, GENERATOR OF HAZARDOUS WASTE, NEI-1210449, AIR PROGRAM, RCRAINFO-, HAZARDOUS WASTE PROGRAM Organizations: DYNAMIC CHROMIUM INDUSTRIES INC (CONTACT/OWNER)
ACCUTEK MICROCIRCUIT CORP (2 NEW PASTURE ROAD, SUITE ONE in NEWBURYPORT, MA)
STATE MASTER (MA-EPICS) - RCRAINFO-MV9784656200, HAZARDOUS WASTE PROGRAM National Pollutant Discharge Elimination System NON-MAJOR (Tracking pollutant discharge elimination systems) - permit
ZENTRIX TECHNOLOGIES INC (22 GRAF ROAD in NEWBURYPORT, MA)
AIR MINOR (AIRS/AFS) CRITERIA AND HAZARDOUS AIR POLLUTANT INVENTORY (Inventory of air pollution sources) HAZARDOUS WASTE BIENNIAL REPORTER (Resource Conservation and Recovery Act (tracking hazardous waste)) Large Quantity Generators, more that 1000 kg of hazardous waste/month (Resource Conservation and Recovery Act (tracking hazardous waste)) - notification TRI REPORTER (Tracking of toxic chemicals releasing facilities) Business SIC and NAICS classification: ELECTROPLATING, PLATING, POLISHING, ANODIZING, AND COLORING Organizations: ZENTRIX TECHNOLOGIES INC. (CONTACT/OPERATOR)
, BRUSH ENGINEERED MATERIALS INC. (CONTACT/OWNER)
Alternative names: BRUSH WELLMAN, BRUSH WELLMAN INC NEWBURYPORT PLT, ZENTRIX TECHS. INC.
LEGGETT & PLATT INC (122 PARKER ST. in NEWBURYPORT, MA)
AIR MINOR (AIRS/AFS) ENFORCEMENT/COMPLIANCE ACTIVITY (Integrated Compliance Information System) CRITERIA AND HAZARDOUS AIR POLLUTANT INVENTORY (Inventory of air pollution sources) Small Quantity Generators, between 100 kg and 1000 kg of hazardous waste/month (Resource Conservation and Recovery Act (tracking hazardous waste)) - notification TRI REPORTER (Tracking of toxic chemicals releasing facilities) Business SIC classification: PLASTICS FOAM PRODUCTS Alternative names: CREST FOAM, LEGGETT & PLATT INC URETHANE DIVISION
BERKSHIRE MANUFACTURED PRODUCTS INC (116 PARKER STREET in NEWBURYPORT, MA)
AIR MINOR (AIRS/AFS) CRITERIA AND HAZARDOUS AIR POLLUTANT INVENTORY (Inventory of air pollution sources) (Resource Conservation and Recovery Act (tracking hazardous waste)) Business SIC classification: METAL STAMPINGS Business NAICS classification: IRON AND STEEL FORGING. Alternative names: BERKSHIRE MANUFACTURing products
BIXBY INTERNATIONAL CORP (1 PREBLE RD in NEWBURYPORT, MA)
AIR MINOR (AIRS/AFS) ENFORCEMENT/COMPLIANCE ACTIVITY (Integrated Compliance Information System) CRITERIA AND HAZARDOUS AIR POLLUTANT INVENTORY (Inventory of air pollution sources) Small Quantity Generators, between 100 kg and 1000 kg of hazardous waste/month (Resource Conservation and Recovery Act (tracking hazardous waste)) - notification TRI REPORTER (Tracking of toxic chemicals releasing facilities) Organizations: BIXBY INTERNATIONAL COPORATION (CONTACT/OWNER)
AIR MINOR (AIRS/AFS) CRITERIA AND HAZARDOUS AIR POLLUTANT INVENTORY (Inventory of air pollution sources) Small Quantity Generators, between 100 kg and 1000 kg of hazardous waste/month (Resource Conservation and Recovery Act (tracking hazardous waste)) - notification TRI REPORTER (Tracking of toxic chemicals releasing facilities) Business SIC classification: COMMUNICATIONS EQUIPMENT Organizations: L-3 COMMUNICATIONS (CONTACT/OWNER)
Alternative names: L 3 COMMUNICATIONS SPD TECH INC HENSCHEL, L-3 COMUNICATIONS HENSCHOL
KELLEY (149 HIGH STREET in NEWBURYPORT, MA)
(National Center for Education Statistics) - STATE ID-204020 Organizations: NEWBURYPORT (SCHOOL DISTRICT)
NEWBURYPORT HIGH (241 HIGH STREET in NEWBURYPORT, MA)
(National Center for Education Statistics) - STATE ID-204505
CIRCLE FINISHING INC (19 GRAF RD in NEWBURYPORT, MA)
AIR MINOR (AIRS/AFS) CRITERIA AND HAZARDOUS AIR POLLUTANT INVENTORY (Inventory of air pollution sources) Small Quantity Generators, between 100 kg and 1000 kg of hazardous waste/month (Resource Conservation and Recovery Act (tracking hazardous waste)) - notification Business SIC and NAICS classification: ELECTROPLATING, PLATING, POLISHING, ANODIZING, AND COLORING Organizations: RODNEY D L`ITALIEN SR (CONTACT/OWNER)
M&V ELECTROPLATING CORPOARATION (4 PERKINS WAY in NEWBURYPORT, MA)
COMPLIANCE ACTIVITY (Tracking inspections of insecticide, fungicide, and rodenticide, and toxic substances) HAZARDOUS WASTE BIENNIAL REPORTER (Resource Conservation and Recovery Act (tracking hazardous waste)) Large Quantity Generators, more that 1000 kg of hazardous waste/month (Resource Conservation and Recovery Act (tracking hazardous waste)) - notification TRI REPORTER (Tracking of toxic chemicals releasing facilities) Business SIC classification: ELECTROPLATING, PLATING, POLISHING, ANODIZING, AND COLORING; COATING, ENGRAVING, AND ALLIED SERVICES Business NAICS classification: ELECTROPLATING, PLATING, POLISHING, ANODIZING, AND COLORING. Organizations: THOMAS VIGEANT (CONTACT/OPERATOR)
Alternative names: M & V ELECTROPLATING CO
Housing units lacking complete plumbing facilities: 0.2% Housing units lacking complete kitchen facilities: 0.2%
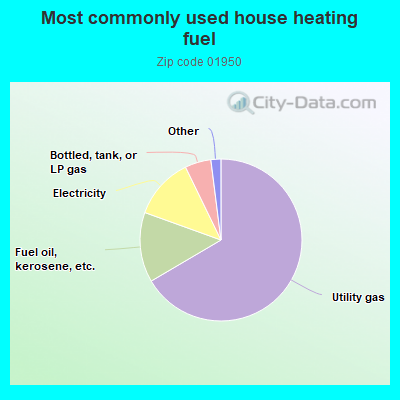
66.6%Utility gas
14.0%Fuel oil, kerosene, etc.
12.3%Electricity
5.2%Bottled, tank, or LP gas
0.9%Wood
0.8%Other fuel
Population in 1990: 16,317. Population change in the 1990s: +1,951 (+12.0%).
Place of birth for U.S.-born residents:
This state: 10,927
Northeast: 3,710
Midwest: 727
South: 565
West: 695
60% of the 01950 zip code residents lived in the same house 5 years ago. Out of people who lived in different houses, 58% lived in this county. Out of people who lived in different counties, 50% lived in Massachusetts.
91% of the 01950 zip code residents lived in the same house 1 year ago. Out of people who lived in different houses, 44% moved from this county. Out of people who lived in different houses, 32% moved from different county within same state. Out of people who lived in different houses, 17% moved from different state. Out of people who lived in different houses, 7% moved from abroad.
Private vs. public school enrollment:
Students in private schools in grades 1 to 8 (elementary and middle school): 227
Here:
9.5%
Massachusetts:
10.3%
Students in private schools in grades 9 to 12 (high school): 146
Here:
22.4%
Massachusetts:
12.3%
Students in private undergraduate colleges: 279
Here:
51.3%
Massachusetts:
51.2%
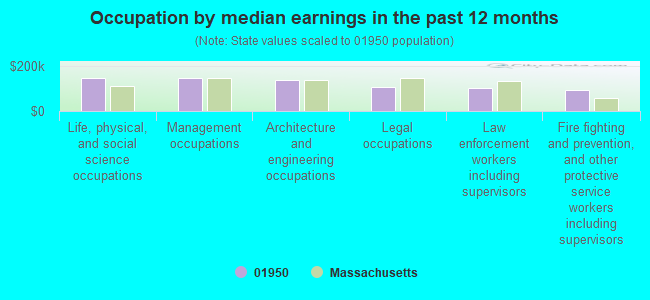
Occupation by median earnings in the past 12 months ($)
147,761Life, physical, and social science occupations
146,171Management occupations
137,871Architecture and engineering occupations
107,788Legal occupations
101,594Law enforcement workers including supervisors
93,455Fire fighting and prevention, and other protective service workers including supervisors
Companies with biggest federal contracts located in this zip code (NEWBURYPORT, MA):
L-3/HENSCHEL (9 MALCOLM HOYT DRIVE) : $21,639,378 in 380 contractsfrom 1999 to 2006
Contracts for Electrical and Electronic assemblies, Boards, Cards, and Associated Hardware, ADPE System Configuration, Miscellaneous Communication Equipment, Maintenance, Repair and Rebuilding of Equipment -- Ship and Marine Equipment, and moreby Navy, Defense Logistics Agency, Federal Technology Service, U.S. Coast Guard, and others Signed by year:2000: $1,360,717; 2001: $2,250,252; 2002: $806,742; 2003: $880,667; 2004: $2,010,802; 2005: $3,813,372; 2006: $10,275,586.
Biggest contracts:
$7,648,000 with Navy for Electrical and Electronic assemblies, Boards, Cards, and Associated Hardware. Signed on 2006-01-25. Completion date: 2011-01-25.
$1,970,956 with Navy for ADPE System Configuration. Signed on 2006-05-04. Completion date: 2007-03-01.
$947,974 with Navy for Miscellaneous Communication Equipment. Signed on 2004-05-26. Completion date: 2004-10-26.
$905,144 with Navy for ADPE System Configuration. Signed on 2005-08-24. Completion date: 2009-02-19.
BERKSHIRE MANUFACTURED PRODUCT (116 PARKER STREET; small business) 250 employees, $0 revenue: $3,151,243 in 156 contractsfrom 2000 to 2006
Contracts for Gas Turbines and Jet Engines, Aircraft; Prime Moving, and Components, Miscellaneous Aircraft Accessories and Components, Fastening Device, Bushings, Rings, Shims, and Spacers, and moreby Defense Logistics Agency, Army Signed by year:2000: $517,812; 2001: $510,732; 2002: $299,286; 2003: $134,087; 2004: $297,699; 2005: $1,000,480; 2006: $391,147.
Biggest contracts:
$110,375 with Defense Logistics Agency for Gas Turbines and Jet Engines, Aircraft; Prime Moving, and Components. Signed on 2006-05-09. Completion date: 2006-08-15.
$107,200, same as above.Signed on 2006-05-01. Completion date: 2006-08-07.
$104,795, same as above.Signed on 2002-09-12. Completion date: 2003-04-10.
$100,024, same as above.Signed on 2003-10-03. Completion date: 2004-01-26.
ROCHESTER ELECTRONICS LLC (16 MALCOLM HOYT DR; small business) : $3,124,574 in 121 contractsfrom 2000 to 2006
Contracts for Microcircuits, Electronic, Semiconductor Devices and Associated Hardware, Miscellaneous Electrical and Electronic Components, Engine Electrical System Components, Aircraft Prime Moving, and moreby Defense Logistics Agency, Air Force, Navy, Bureau of Prisoners/Federal Prison System, and others Signed by year:2000: $354,746; 2001: $349,590; 2002: $483,067; 2003: $128,253; 2004: $686,893; 2005: $727,730; 2006: $394,295.
Biggest contracts:
$211,930 with Defense Logistics Agency for Microcircuits, Electronic. Signed on 2002-08-21. Completion date: 2003-03-14.
$166,250 with Air Force for Semiconductor Devices and Associated Hardware. Signed on 2000-02-22. Completion date: 2000-10-15.
$133,287 with Defense Logistics Agency for Microcircuits, Electronic. Signed on 2002-09-13. Completion date: 2003-04-14.
$93,500, same as above.Signed on 2001-01-08. Completion date: 2001-01-24.
MTI-MILLIREN TECHNOLOGIES INC (TWO NEW PASTURE ROAD; small business) : $1,720,153 in 10 contractsfrom 2001 to 2006
Contracts for Weapons -- Applied Research and Exploratory Development (R&D), Engineering -- Operational Systems Development (R&D), Electrical and Electronic Properties Measuring and Testing Instruments, Defense Electronics and Communication Equipment -- Applied Research and Exploratory Development (R&D), and moreby Navy, Army Signed by year:2000: $0; 2001: $69,894; 2002: $0; 2003: $749,975; 2004: $548,836; 2005: $306,448; 2006: $45,000.
Biggest contracts:
$391,374 with Navy for Weapons -- Applied Research and Exploratory Development (R&D). Signed on 2004-11-09. Completion date: 2005-04-03.
$375,000 with Navy for Engineering -- Operational Systems Development (R&D). Signed on 2003-04-02. Completion date: 2005-04-03.
$374,975, same as above.Signed on 2003-08-04. Completion date: 2005-04-03.
$306,448 with Army for Electrical and Electronic Properties Measuring and Testing Instruments. Signed on 2005-05-17. Completion date: 2005-10-23.
INNOVATIVE TECHNOLOGY INC (2 NEW PASTURE RD STE 5) : $206,669 in 9 contractsfrom 2001 to 2005
Contracts for Medical and Surgical Instruments, Equipment, and Supplies, Laboratory Equipment and Supplies, Pressure, Temperature, and Humidity Measuring and Controlling Instruments, Chemical Analysis Instruments, and moreby Air Force, National Institute of Standards and Technology, Navy, Army, and others Signed by year:2000: $0; 2001: $23,450; 2002: $0; 2003: $0; 2004: $0; 2005: $183,219; 2006: $0.
Biggest contracts:
$41,100 with Air Force for Medical and Surgical Instruments, Equipment, and Supplies. Signed on 2005-11-22. Completion date: 2006-03-17.
$28,500, same as above.Signed on 2005-11-22. Completion date: 2006-03-17.
$28,000, same as above.Signed on 2005-11-22. Completion date: 2006-03-17.
$25,880 with National Institute of Standards and Technology for Laboratory Equipment and Supplies. Signed on 2005-09-19. Completion date: 2005-10-28.
ASHBY CROSS COMPANY INC (28 PARKER ST; small business) : $184,330 in 4 contractsfrom 2002 to 2005
$66,840 with Navy for Power and Hand Pumps. Signed on 2004-03-03. Completion date: 2004-05-06.
$61,240, same as above.Signed on 2004-05-04. Completion date: 2004-07-23.
$53,650, same as above.Signed on 2002-06-21. Completion date: 2002-08-16.
$2,600 with Navy for Hand Tools, Nonedged, Nonpowered. Signed on 2005-06-22. Completion date: 2005-07-29.
I & C ENGINEERING COMPANY, INC (253 LOW STREET; small business) : $177,347 in 9 contractsfrom 2002 to 2005
Contracts for Maintenance, Repair and Rebuilding of Equipment -- Plumbing, Heating, and Waste Disposal Equipment, Maintenance, Repair and Rebuilding of Equipment -- Electric Wire, and Power and Distribution Equipment by Navy Signed by year:2000: $0; 2001: $0; 2002: $39,180; 2003: $39,180; 2004: $48,699; 2005: $50,288; 2006: $0.
Biggest contracts:
$43,200 with Navy for Maintenance, Repair and Rebuilding of Equipment -- Plumbing, Heating, and Waste Disposal Equipment. Taking place in RI. Signed on 2005-01-18. Completion date: 2006-01-13.
$41,136, same as above.Signed on 2004-01-23. Completion date: 2005-01-18.
$39,180, same as above.Signed on 2003-01-17. Completion date: 2004-01-17.
$39,180, same as above.Signed on 2002-01-17. Completion date: 2007-01-16.
ZENTRIX TECHNOLOGIES INC (22 GRAF RD)
$124,305 with Army for Miscellaneous Electrical and Electronic Components. Signed on 2003-06-27. Completion date: 2003-10-31.
PEDERSEN RESEARCH INC (212 HIGH ST; small business)
$109,096 with Army for Services -- Applied Research and Exploratory Development (R&D). Signed on 1999-12-22. Completion date: 2001-03-03.
STARENSIER INC (10 MULLIKEN WAY)
$95,880 with Army for Textile Fabrics. Signed on 2002-04-04. Completion date: 2002-05-17.
Top industries in this zip code by the number of employees in 2005:
Health Care and Social Assistance: General Medical and Surgical Hospitals (500-999 employees: 1 establishment)
2002 - 2018 National Fire Incident Reporting System (NFIRS) incidents
According to the data from the years 2002 - 2018 the average number of fires per year is 19. The highest number of reported fires - 35 took place in 2015, and the least - 8 in 2018. The data has a decreasing trend.
When looking into fire subcategories, the most incidents belonged to: Structure Fires (65.3%), and Mobile Property/Vehicle Fires (19.9%).
Fire incident types reported to NFIRS in Zip Code 01950


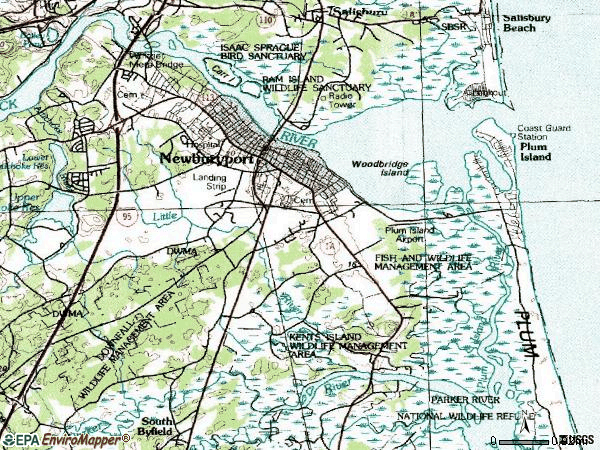
 Nearest zip codes: 01951, 01952, 01922, 01985, 01913, 03874.


 According to the data from the years 2002 - 2018 the average number of fires per year is 19. The highest number of reported fires - 35 took place in 2015, and the least - 8 in 2018. The data has a decreasing trend.
 When looking into fire subcategories, the most incidents belonged to: Structure Fires (65.3%), and Mobile Property/Vehicle Fires (19.9%).