Estimated zip code population in 2022: 4,519 Zip code population in 2010: 4,235 Zip code population in 2000: 4,149
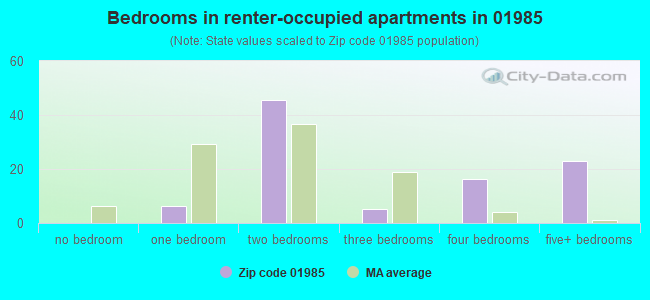
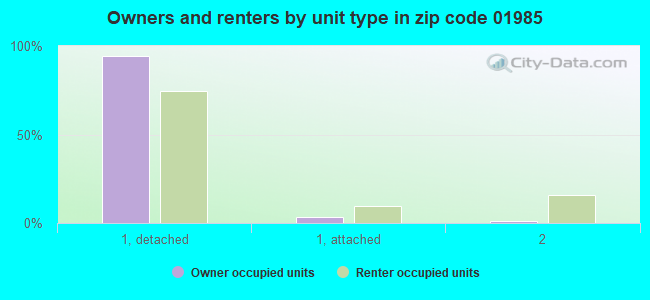
Houses and condos: 1,829 Renter-occupied apartments: 97
% of renters here:
6%
State:
38%
March 2022 cost of living index in zip code 01985: 118.1 (more than average, U.S. average is 100)
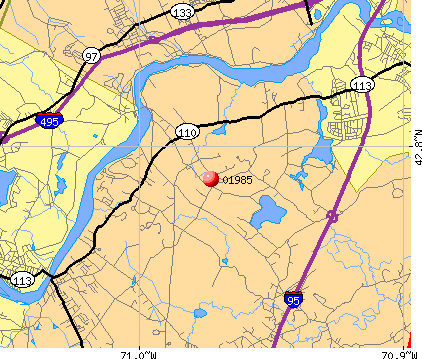
Land area: 13.5 sq. mi. Water area: 1.3 sq. mi.
Population density: 336 people per square mile
(very low).
OSM Map
Google Map
MSN Map
OSM Map
General Map
Google Map
MSN Map
OSM Map
Google Map
MSN Map
OSM Map
Google Map
MSN Map
Please wait while loading the map...
Real estate property taxes paid for housing units in 2022:
This zip code:
1.1% ($8,586)
Massachusetts:
1.0% ($5,536)
Median real estate property taxes paid for housing units with mortgages in 2022: $8,701 (1.1%) Median real estate property taxes paid for housing units with no mortgage in 2022: $8,419 (1.1%)
Business Search- 14 Million verified businesses
Males: 2,231
(49.4%)
Females: 2,288
(50.6%)
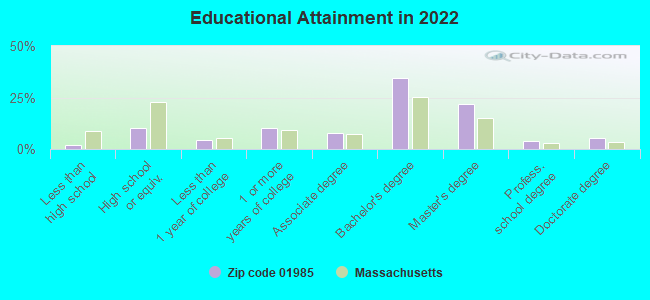
For population 25 years and over in 01985:
High school or higher: 98.2%
Bachelor's degree or higher: 65.4%
Graduate or professional degree: 31.0%
Unemployed: 2.9%
Mean travel time to work (commute): 32.1 minutes
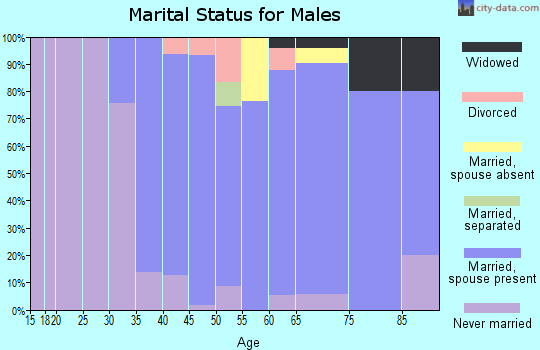
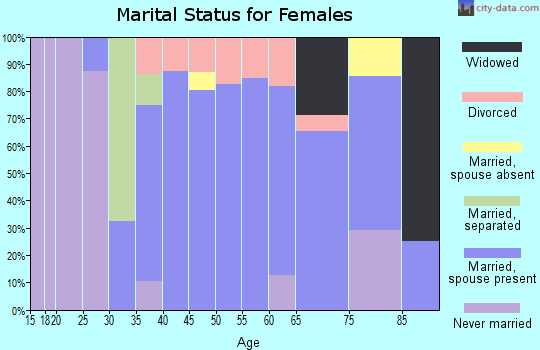
For population 15 years and over in 01985:
Never married: 26.8%
Now married: 59.9%
Separated: 0.5%
Widowed: 4.0%
Divorced: 8.9%
Zip code 01985 compared to state average:
Median household income above state average.
Median house value above state average.
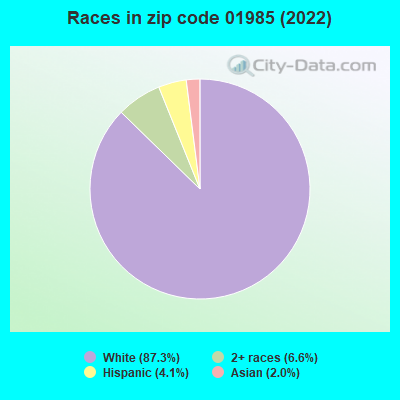
Black race population percentage significantly below state average.
Hispanic race population percentage significantly below state average.
Median age significantly above state average.
Foreign-born population percentage significantly below state average.
Renting percentage significantly below state average.
Length of stay since moving in significantly above state average.
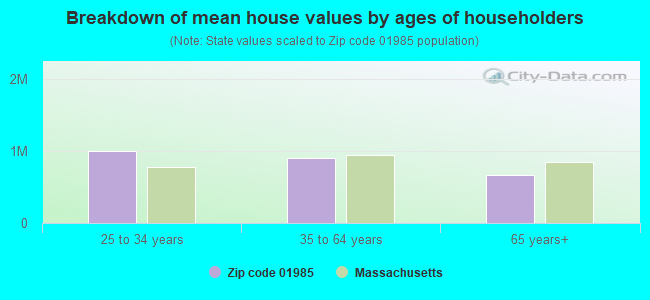
Estimated median house/condo value in 2022: $802,547
01985:
$802,547
Massachusetts:
$534,700
Median resident age:
This zip code:
51.1 years
Massachusetts median age:
40.3 years
Average household size:
This zip code:
2.7 people
Massachusetts:
2.4 people
Averages for the 2020 tax year for zip code 01985, filed in 2021:
Average Adjusted Gross Income (AGI) in 2020: $155,778 (Individual Income Tax Returns)
Here:
$155,778
State:
$105,130
Salary/wage: $123,411 (reported on 77.6% of returns)
Here:
$123,411
State:
$82,951
(% of AGI for various income ranges: 1196.7% for AGIs below $25k, 4142.4% for AGIs $25k-50k, 6437.1% for AGIs $50k-75k, 9783.0% for AGIs $75k-100k, 20248.3% for AGIs $100k-200k, 107145.4% for AGIs over 200k)
Taxable interest for individuals: $2,364 (reported on 57.0% of returns)
This zip code:
$2,364
Massachusetts:
$2,361
(% of AGI for various income ranges: 45.2% for AGIs below $25k, 93.5% for AGIs $25k-50k, 100.0% for AGIs $50k-75k, 286.0% for AGIs $75k-100k, 335.2% for AGIs $100k-200k, 1163.8% for AGIs over 200k)
Ordinary dividends: $8,809 (reported on 41.4% of returns)
Here:
$8,809
State:
$10,365
(% of AGI for various income ranges: 72.2% for AGIs below $25k, 195.3% for AGIs $25k-50k, 235.7% for AGIs $50k-75k, 275.0% for AGIs $75k-100k, 768.3% for AGIs $100k-200k, 4056.2% for AGIs over 200k)
Net capital gain/loss in AGI: +$56,011 (reported on 38.4% of returns)
Here:
+$56,011
State:
+$48,178
(% of AGI for various income ranges: 34.4% for AGIs below $25k, 156.5% for AGIs $25k-50k, 286.4% for AGIs $50k-75k, 496.0% for AGIs $75k-100k, 1188.6% for AGIs $100k-200k, 35590.0% for AGIs over 200k)
Profit/loss from business: +$32,286 (reported on 21.5% of returns)
Here:
+$32,286
State:
+$20,792
(% of AGI for various income ranges: 90.0% for AGIs below $25k, 270.0% for AGIs $25k-50k, 687.1% for AGIs $50k-75k, 653.0% for AGIs $75k-100k, 1745.9% for AGIs $100k-200k, 6989.2% for AGIs over 200k)
Taxable individual retirement arrangement distribution: $28,662 (reported on 15.6% of returns)
01985:
$28,662
Massachusetts:
$22,790
(% of AGI for various income ranges: 114.1% for AGIs below $25k, 264.1% for AGIs $25k-50k, 372.9% for AGIs $50k-75k, 1088.0% for AGIs $75k-100k, 1677.2% for AGIs $100k-200k, 2595.4% for AGIs over 200k)
Self-employed (Keogh) retirement plans: $20,600 (reported on 2.5% of returns)
01985:
$20,600
Massachusetts:
$26,868
(% of AGI for various income ranges: 177.6% for AGIs $100k-200k, 554.6% for AGIs over 200k)
Total itemized deductions: $33,185 (reported on 23.2% of returns)
Here:
$33,185
State:
$36,722
(% of AGI for various income ranges: 205.6% for AGIs below $25k, 422.4% for AGIs $25k-50k, 784.3% for AGIs $50k-75k, 1154.0% for AGIs $75k-100k, 1852.8% for AGIs $100k-200k, 7195.4% for AGIs over 200k)
Charity contributions: $4,974 (reported on 18.1% of returns)
Here:
$4,974
State:
$12,529
(% of AGI for various income ranges: 9.6% for AGIs below $25k, 23.6% for AGIs $50k-75k, 85.0% for AGIs $75k-100k, 134.8% for AGIs $100k-200k, 1233.8% for AGIs over 200k)
Taxes paid: $9,516 (reported on 23.2% of returns)
01985:
$9,516
State:
$8,782
(% of AGI for various income ranges: 63.3% for AGIs below $25k, 131.2% for AGIs $25k-50k, 254.3% for AGIs $50k-75k, 419.0% for AGIs $75k-100k, 613.8% for AGIs $100k-200k, 1757.7% for AGIs over 200k)
Earned income credit: $1,457 (reported on 3.0% of returns)
Here:
$1,457
State:
$1,909
(% of AGI for various income ranges: 24.4% for AGIs below $25k, 21.2% for AGIs $25k-50k)
Percentage of individuals using paid preparers for their 2020 taxes: 90.7%
Here:
91%
State:
92%
(% for various income ranges: 86.8% for AGIs below $25k, 88.9% for AGIs $25k-50k, 91.7% for AGIs $50k-75k, 90.5% for AGIs $75k-100k, 91.9% for AGIs $100k-200k, 94.0% for AGIs over 200k)
Averages for the 2012 tax year for zip code 01985, filed in 2013:
Average Adjusted Gross Income (AGI) in 2012: $125,948 (Individual Income Tax Returns)
Here:
$125,948
State:
$81,425
Salary/wage: $103,253 (reported on 81.8% of returns)
Here:
$103,253
State:
$64,752
(% of AGI for various income ranges: 69.9% for AGIs below $25k, 60.7% for AGIs $25k-50k, 64.4% for AGIs $50k-75k, 62.7% for AGIs $75k-100k, 75.6% for AGIs $100k-200k, 63.6% for AGIs over 200k)
Taxable interest for individuals: $2,266 (reported on 60.3% of returns)
This zip code:
$2,266
Massachusetts:
$2,136
(% of AGI for various income ranges: 3.1% for AGIs below $25k, 2.2% for AGIs $25k-50k, 1.9% for AGIs $50k-75k, 0.7% for AGIs $75k-100k, 1.1% for AGIs $100k-200k, 0.9% for AGIs over 200k)
Ordinary dividends: $6,291 (reported on 43.1% of returns)
Here:
$6,291
State:
$9,473
(% of AGI for various income ranges: 4.5% for AGIs below $25k, 2.6% for AGIs $25k-50k, 3.0% for AGIs $50k-75k, 2.6% for AGIs $75k-100k, 1.9% for AGIs $100k-200k, 2.0% for AGIs over 200k)
Net capital gain/loss in AGI: +$16,603 (reported on 36.4% of returns)
Here:
+$16,603
State:
+$31,437
(% of AGI for various income ranges: 1.0% for AGIs $25k-50k, 2.3% for AGIs $75k-100k, 1.8% for AGIs $100k-200k, 7.7% for AGIs over 200k)
Profit/loss from business: +$29,945 (reported on 22.5% of returns)
Here:
+$29,945
State:
+$20,662
(% of AGI for various income ranges: 10.9% for AGIs below $25k, 11.9% for AGIs $25k-50k, 11.0% for AGIs $50k-75k, 7.2% for AGIs $75k-100k, 4.9% for AGIs $100k-200k, 4.1% for AGIs over 200k)
Taxable individual retirement arrangement distribution: $23,976 (reported on 13.9% of returns)
01985:
$23,976
Massachusetts:
$18,892
(% of AGI for various income ranges: 4.5% for AGIs below $25k, 3.9% for AGIs $25k-50k, 3.7% for AGIs $50k-75k, 5.8% for AGIs $75k-100k, 3.5% for AGIs $100k-200k, 1.6% for AGIs over 200k)
Self-employment retirement plans: $19,271 (reported on 3.3% of returns)
01985:
$19,271
Massachusetts:
$20,669
Total itemized deductions: $31,587 (17% of AGI, reported on 63.2% of returns)
Here:
$31,587
State:
$28,907
Here:
17.3% of AGI
State:
18.2% of AGI
(% of AGI for various income ranges: 27.4% for AGIs below $25k, 21.7% for AGIs $25k-50k, 22.9% for AGIs $50k-75k, 22.1% for AGIs $75k-100k, 18.7% for AGIs $100k-200k, 12.0% for AGIs over 200k)
Charity contributions: $2,578 (reported on 55.0% of returns)
Here:
$2,578
State:
$4,208
(% of AGI for various income ranges: 0.9% for AGIs below $25k, 1.2% for AGIs $25k-50k, 1.8% for AGIs $50k-75k, 1.5% for AGIs $75k-100k, 1.3% for AGIs $100k-200k, 0.9% for AGIs over 200k)
Taxes paid: $16,835 (reported on 63.2% of returns)
01985:
$16,835
State:
$13,303
(% of AGI for various income ranges: 10.6% for AGIs below $25k, 8.1% for AGIs $25k-50k, 9.7% for AGIs $50k-75k, 9.9% for AGIs $75k-100k, 9.5% for AGIs $100k-200k, 7.5% for AGIs over 200k)
Earned income credit: $1,422 (reported on 4.3% of returns)
Here:
$1,422
State:
$1,971
(% of AGI for various income ranges: 2.3% for AGIs below $25k)
Percentage of individuals using paid preparers for their 2012 taxes: 62.7%
Here:
63%
State:
56%
(% for various income ranges: 50.9% for AGIs below $25k, 63.0% for AGIs $25k-50k, 65.2% for AGIs $50k-75k, 66.7% for AGIs $75k-100k, 62.3% for AGIs $100k-200k, 78.8% for AGIs over 200k)
Averages for the 2004 tax year for zip code 01985, filed in 2005:
Average Adjusted Gross Income (AGI) in 2004: $96,139 (Individual Income Tax Returns)
Here:
$96,139
State:
$62,877
Salary/wage: $79,899 (reported on 82.7% of returns)
Here:
$79,899
State:
$52,969
(% of AGI for various income ranges: 113.6% for AGIs below $10k, 56.7% for AGIs $10k-25k, 71.7% for AGIs $25k-50k, 70.2% for AGIs $50k-75k, 76.6% for AGIs $75k-100k, 67.3% for AGIs over 100k)
Taxable interest for individuals: $1,788 (reported on 74.0% of returns)
This zip code:
$1,788
Massachusetts:
$1,945
(% of AGI for various income ranges: 9.6% for AGIs below $10k, 3.9% for AGIs $10k-25k, 3.0% for AGIs $25k-50k, 1.4% for AGIs $50k-75k, 2.0% for AGIs $75k-100k, 1.0% for AGIs over 100k)
Taxable dividends: $3,704 (reported on 48.8% of returns)
Here:
$3,704
State:
$5,323
(% of AGI for various income ranges: 10.3% for AGIs below $10k, 3.7% for AGIs $10k-25k, 3.2% for AGIs $25k-50k, 2.1% for AGIs $50k-75k, 2.6% for AGIs $75k-100k, 1.5% for AGIs over 100k)
Net capital gain/loss: +$8,408 (reported on 41.2% of returns)
Here:
+$8,408
State:
+$20,377
(% of AGI for various income ranges: -5.2% for AGIs below $10k, -1.4% for AGIs $10k-25k, -0.4% for AGIs $25k-50k, 0.6% for AGIs $50k-75k, 1.4% for AGIs $75k-100k, 4.7% for AGIs over 100k)
Profit/loss from business: +$24,828 (reported on 23.5% of returns)
Here:
+$24,828
State:
+$17,837
(% of AGI for various income ranges: -4.5% for AGIs below $10k, 15.2% for AGIs $10k-25k, 8.9% for AGIs $25k-50k, 7.8% for AGIs $50k-75k, 6.7% for AGIs $75k-100k, 5.4% for AGIs over 100k)
Profit/loss from farming: +$545 (reported on 0.6% of returns)
Here:
+$545
State:
-$2,642
IRA payment deduction: $3,629 (reported on 4.5% of returns)
01985:
$3,629
Massachusetts:
$3,100
Self-employed pension: $16,051 (reported on 3.9% of returns)
Here:
$16,051
Massachusetts:
$14,516
Total itemized deductions: $26,920 (19% of AGI, reported on 61.5% of returns)
Here:
$26,920
State:
$22,573
Here:
18.8% of AGI
State:
19.5% of AGI
(% of AGI for various income ranges: 48.3% for AGIs below $10k, 28.4% for AGIs $10k-25k, 21.9% for AGIs $25k-50k, 23.9% for AGIs $50k-75k, 22.6% for AGIs $75k-100k, 15.0% for AGIs over 100k)
Charity contributions deductions: $2,695 (2% of AGI, reported on 57.5% of returns)
Here:
$2,695
State:
$3,295
Here:
1.8% of AGI
State:
2.7% of AGI
(% of AGI for various income ranges: 0.9% for AGIs below $10k, 1.9% for AGIs $10k-25k, 1.9% for AGIs $25k-50k, 1.9% for AGIs $50k-75k, 1.7% for AGIs $75k-100k, 1.6% for AGIs over 100k)
Total tax: $19,273 (reported on 83.9% of returns)
01985:
$19,273
State:
$11,494
(% of AGI for various income ranges: 3.9% for AGIs below $10k, 6.2% for AGIs $10k-25k, 8.3% for AGIs $25k-50k, 9.1% for AGIs $50k-75k, 10.2% for AGIs $75k-100k, 19.4% for AGIs over 100k)
Earned income credit: $1,452 (reported on 4.2% of returns)
Here:
$1,452
State:
$1,518
Percentage of individuals using paid preparers for their 2004 taxes: 62.4%
Here:
62%
State:
58%
(% for various income ranges: 54.9% for AGIs below $10k, 58.1% for AGIs $10k-25k, 62.5% for AGIs $25k-50k, 63.3% for AGIs $50k-75k, 64.5% for AGIs $75k-100k, 67.3% for AGIs over 100k)
Likely homosexual households (counted as self-reported same-sex unmarried-partner households)
Lesbian couples: 0.5% of all households
Gay men: 0.0% of all households
Household received Food Stamps/SNAP in the past 12 months: 28 Household did not receive Food Stamps/SNAP in the past 12 months: 1,587
Women who had a birth in the past 12 months: 7 (8 now married, 0 unmarried) Women who did not have a birth in the past 12 months: 750 (274 now married, 476 unmarried)
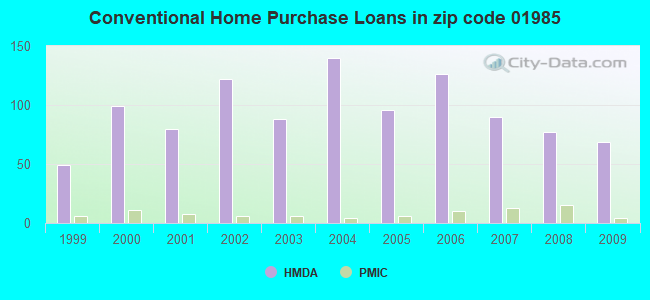
Housing units in zip code 01985 with a mortgage: 1,042 (205 second mortgage, 191 both second mortgage and home equity loan) Houses without a mortgage: 43
Median monthly owner costs for units with a mortgage: $3,044 Median monthly owner costs for units without a mortgage: $1,234
Residents with income below the poverty level in 2022:
This zip code:
3.7%
Whole state:
10.4%
Residents with income below 50% of the poverty level in 2022:
This zip code:
1.5%
Whole state:
5.1%
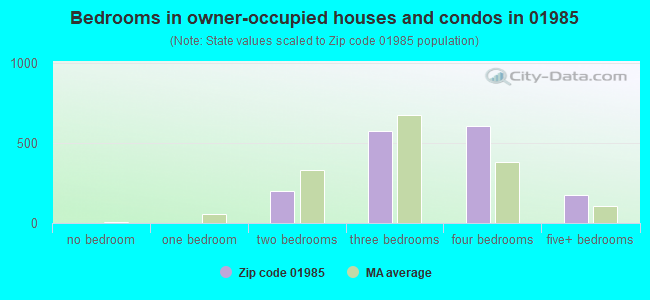
Median number of rooms in houses and condos:
Here:
8.0
State:
6.5
Median number of rooms in apartments:
Here:
6.3
State:
4.0
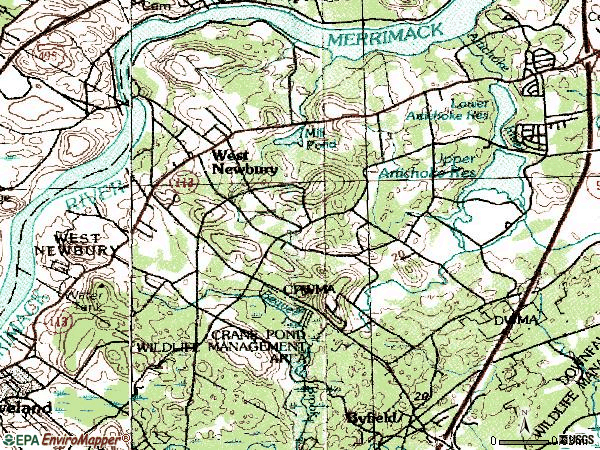
Notable locations in this zip code not listed on our city pages
Notable locations in zip code 01985: Long Hill Orchard (A), Artichoke Dairy (B), West Newbury Fire Department Garden Street Station (C), West Newbury Fire Department Headquarters (D). Display/hide their locations on the map
582 married couples with children.
165 single-parent households (11 men, 154 women).
94.7% of residents of 01985 zip code speak English at home.
2.3% of residents speak Spanish at home (74% very well, 18% well, 8% not well).
1.7% of residents speak other Indo-European language at home (87% very well, 13% well).
1.0% of residents speak Asian or Pacific Island language at home (45% very well, 55% well).
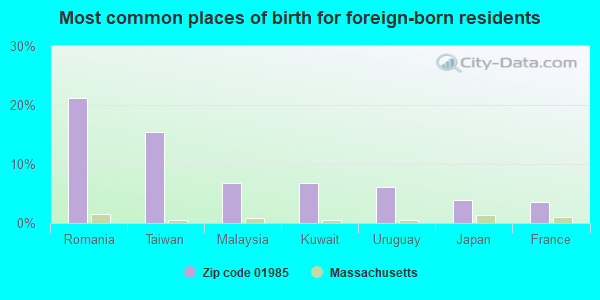
Foreign born population: 278 (6.2%) (70.2% of them are naturalized citizens)
This zip code:
6.2%
Whole state:
18.0%
21%Romania
15%Taiwan
7%Malaysia
7%Kuwait
6%Uruguay
4%Japan
4%France
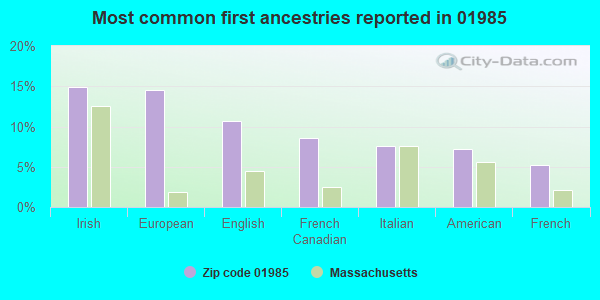
15%Irish
14%European
11%English
9%French Canadian
8%Italian
7%American
5%French
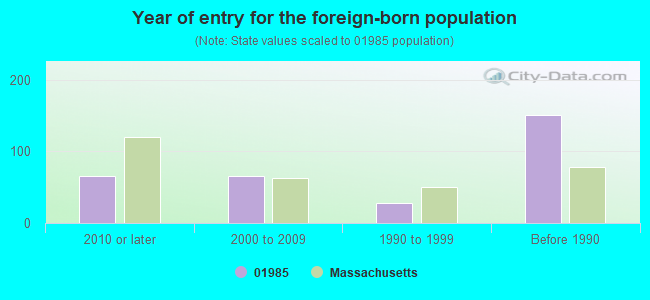
Year of entry for the foreign-born population
662010 or later
662000 to 2009
281990 to 1999
151Before 1990
Facilities with environmental interests located in this zip code:
DR. JOHN C. PAGE SCHOOL (694 MAIN ST in WEST NEWBURY, MA)
AIR MINOR (AIRS/AFS) (National Center for Education Statistics) - STATE ID-745015 CRITERIA AND HAZARDOUS AIR POLLUTANT INVENTORY (Inventory of air pollution sources) Business SIC classification: ELEMENTARY AND SECONDARY SCHOOLS Organizations: PENTUCKET (SCHOOL DISTRICT)
Alternative names: PENTUCKET REG SCH DI, PENTUCKET REGIONAL SCHOOL DISTRICT
Housing units lacking complete plumbing facilities: 1.4% Housing units lacking complete kitchen facilities: 1.4%
58.5%Fuel oil, kerosene, etc.
19.9%Bottled, tank, or LP gas
14.3%Utility gas
2.8%Electricity
2.6%Wood
2.0%Other fuel
Population in 1990: 3,421. Population change in the 1990s: +728 (+21.3%).
Place of birth for U.S.-born residents:
This state: 2,945
Northeast: 911
Midwest: 93
South: 90
West: 138
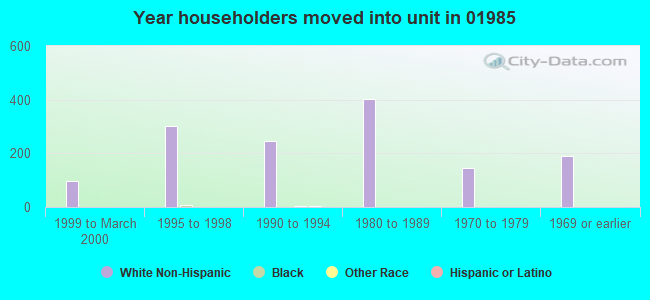
72% of the 01985 zip code residents lived in the same house 5 years ago. Out of people who lived in different houses, 60% lived in this county. Out of people who lived in different counties, 50% lived in Massachusetts.
94% of the 01985 zip code residents lived in the same house 1 year ago. Out of people who lived in different houses, 62% moved from this county. Out of people who lived in different houses, 38% moved from different state.
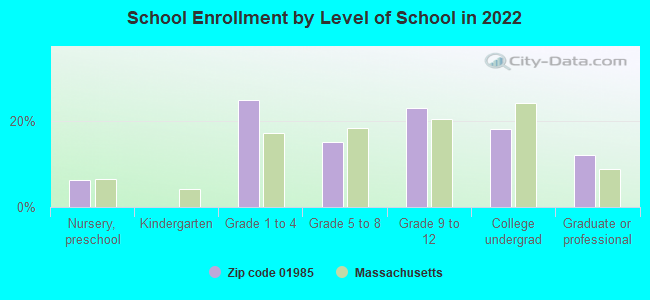
Private vs. public school enrollment:
Students in private schools in grades 1 to 8 (elementary and middle school): 54
Here:
12.7%
Massachusetts:
10.3%
Students in private schools in grades 9 to 12 (high school): 52
Here:
21.3%
Massachusetts:
12.3%
Students in private undergraduate colleges: 102
Here:
52.1%
Massachusetts:
51.2%
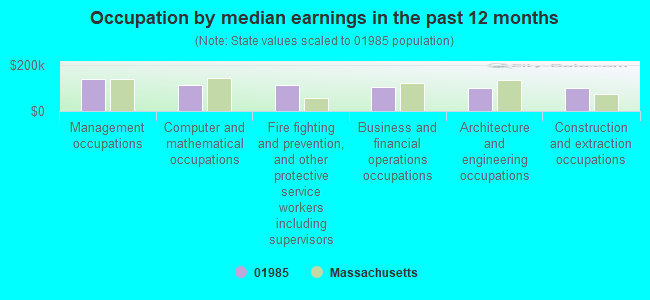
Occupation by median earnings in the past 12 months ($)
139,761Management occupations
113,824Computer and mathematical occupations
113,733Fire fighting and prevention, and other protective service workers including supervisors
103,167Business and financial operations occupations
102,112Architecture and engineering occupations
100,740Construction and extraction occupations
Top industries in this zip code by the number of employees in 2005:
Health Care and Social Assistance: Services for the Elderly and Persons with Disabilities (50-99 employees: 1 establishment)
Accommodation and Food Services: Limited-Service Restaurants (20-49: 1, 5-9: 1)
Health Care and Social Assistance: Child Day Care Services (20-49: 1, 1-4: 1)
Other Services (except Public Administration): Religious Organizations (10-19: 2, 1-4: 1)
Construction: New Single-Family Housing Construction (except Operative Builders) (5-9: 1, 1-4: 5)
Detailed PMIC statistics for the following Tracts:2631.00
2003 - 2018 National Fire Incident Reporting System (NFIRS) incidents
According to the data from the years 2003 - 2018 the average number of fires per year is 9. The highest number of reported fires - 21 took place in 2016, and the least - 1 in 2009. The data has an increasing trend.
When looking into fire subcategories, the most incidents belonged to: Structure Fires (59.9%), and Outside Fires (27.2%).
Fire incident types reported to NFIRS in Zip Code 01985


+$545
-$2,642
 Nearest zip codes: 01913, 01860, 01922, 01834, 01833, 01950.
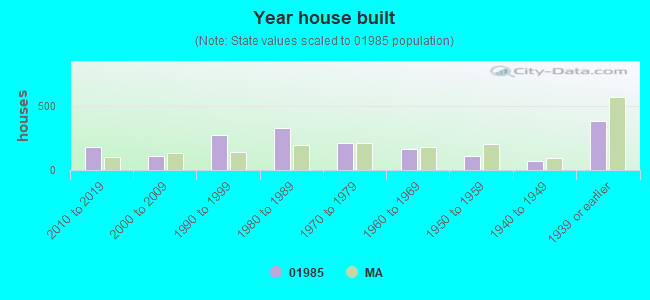


 According to the data from the years 2003 - 2018 the average number of fires per year is 9. The highest number of reported fires - 21 took place in 2016, and the least - 1 in 2009. The data has an increasing trend.
 When looking into fire subcategories, the most incidents belonged to: Structure Fires (59.9%), and Outside Fires (27.2%).