Estimated zip code population in 2022: 6,739 Zip code population in 2010: 6,459 Zip code population in 2000: 6,038
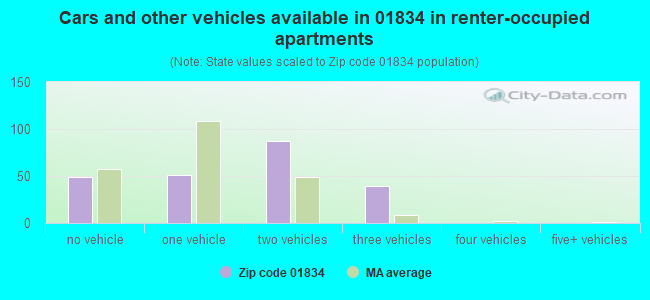
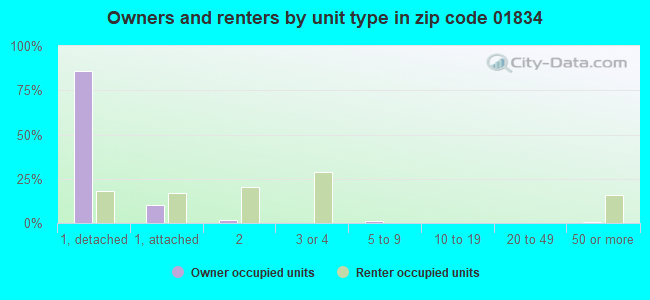
Houses and condos: 2,682 Renter-occupied apartments: 226
% of renters here:
9%
State:
38%
March 2022 cost of living index in zip code 01834: 131.7 (high, U.S. average is 100)
Land area: 8.9 sq. mi. Water area: 0.5 sq. mi.
Population density: 759 people per square mile
(low).
OSM Map
Google Map
MSN Map
OSM Map
General Map
Google Map
MSN Map
OSM Map
Google Map
MSN Map
OSM Map
Google Map
MSN Map
Please wait while loading the map...
Real estate property taxes paid for housing units in 2022:
This zip code:
1.2% ($6,339)
Massachusetts:
1.0% ($5,536)
Median real estate property taxes paid for housing units with mortgages in 2022: $6,313 (1.2%) Median real estate property taxes paid for housing units with no mortgage in 2022: $6,453 (1.3%)
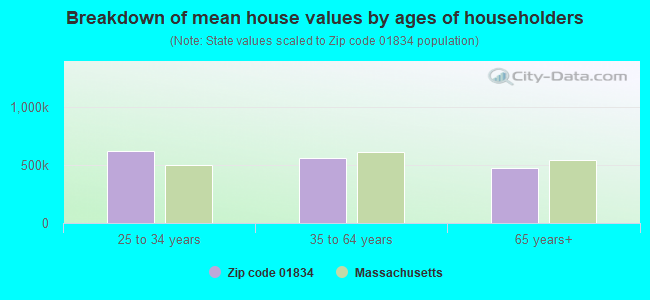
Estimated median house/condo value in 2022: $534,479
01834:
$534,479
Massachusetts:
$534,700
According to our research of Massachusetts and other state lists, there was 1 registered sex offender living in 01834 zip code as of April 28, 2024. The ratio of all residents to sex offenders in zip code 01834 is 6,776 to 1. The ratio of registered sex offenders to all residents in this zip code is much lower than the state average.
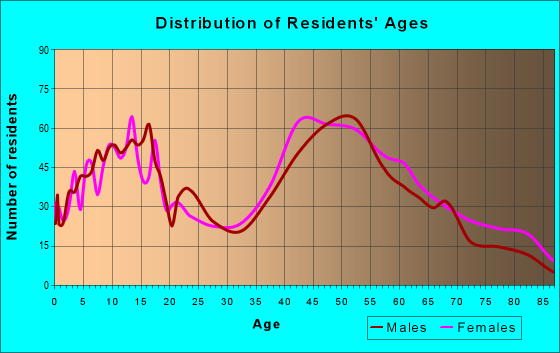
Median resident age:
This zip code:
42.7 years
Massachusetts median age:
40.3 years
Average household size:
This zip code:
2.5 people
Massachusetts:
2.4 people
Averages for the 2020 tax year for zip code 01834, filed in 2021:
Average Adjusted Gross Income (AGI) in 2020: $94,195 (Individual Income Tax Returns)
Here:
$94,195
State:
$105,130
Salary/wage: $82,136 (reported on 80.5% of returns)
Here:
$82,136
State:
$82,951
(% of AGI for various income ranges: 1118.0% for AGIs below $25k, 3383.9% for AGIs $25k-50k, 6103.8% for AGIs $50k-75k, 9536.5% for AGIs $75k-100k, 19400.6% for AGIs $100k-200k, 64429.2% for AGIs over 200k)
Taxable interest for individuals: $947 (reported on 45.4% of returns)
This zip code:
$947
Massachusetts:
$2,361
(% of AGI for various income ranges: 26.9% for AGIs below $25k, 38.0% for AGIs $25k-50k, 38.5% for AGIs $50k-75k, 71.3% for AGIs $75k-100k, 131.4% for AGIs $100k-200k, 244.2% for AGIs over 200k)
Ordinary dividends: $4,159 (reported on 27.3% of returns)
Here:
$4,159
State:
$10,365
(% of AGI for various income ranges: 35.9% for AGIs below $25k, 57.0% for AGIs $25k-50k, 147.9% for AGIs $50k-75k, 178.7% for AGIs $75k-100k, 285.6% for AGIs $100k-200k, 1089.2% for AGIs over 200k)
Net capital gain/loss in AGI: +$14,722 (reported on 23.1% of returns)
Here:
+$14,722
State:
+$48,178
(% of AGI for various income ranges: 12.7% for AGIs below $25k, 49.3% for AGIs $25k-50k, 109.1% for AGIs $50k-75k, 122.6% for AGIs $75k-100k, 406.4% for AGIs $100k-200k, 7712.5% for AGIs over 200k)
Profit/loss from business: +$21,421 (reported on 14.5% of returns)
Here:
+$21,421
State:
+$20,792
(% of AGI for various income ranges: 134.3% for AGIs below $25k, 212.0% for AGIs $25k-50k, 282.6% for AGIs $50k-75k, 213.9% for AGIs $75k-100k, 611.4% for AGIs $100k-200k, 4198.3% for AGIs over 200k)
Taxable individual retirement arrangement distribution: $20,637 (reported on 12.8% of returns)
01834:
$20,637
Massachusetts:
$22,790
(% of AGI for various income ranges: 106.1% for AGIs below $25k, 209.5% for AGIs $25k-50k, 287.4% for AGIs $50k-75k, 536.1% for AGIs $75k-100k, 803.4% for AGIs $100k-200k, 1520.0% for AGIs over 200k)
Self-employed (Keogh) retirement plans: $22,400 (reported on 0.8% of returns)
01834:
$22,400
Massachusetts:
$26,868
(% of AGI for various income ranges: 134.4% for AGIs $100k-200k)
Total itemized deductions: $26,830 (reported on 15.0% of returns)
Here:
$26,830
State:
$36,722
(% of AGI for various income ranges: 276.8% for AGIs $25k-50k, 525.3% for AGIs $50k-75k, 818.7% for AGIs $75k-100k, 1165.8% for AGIs $100k-200k, 3143.3% for AGIs over 200k)
Charity contributions: $3,707 (reported on 11.4% of returns)
Here:
$3,707
State:
$12,529
(% of AGI for various income ranges: 12.7% for AGIs $25k-50k, 33.2% for AGIs $50k-75k, 55.2% for AGIs $75k-100k, 127.8% for AGIs $100k-200k, 487.5% for AGIs over 200k)
Taxes paid: $8,948 (reported on 15.0% of returns)
01834:
$8,948
State:
$8,782
(% of AGI for various income ranges: 84.1% for AGIs $25k-50k, 167.9% for AGIs $50k-75k, 311.3% for AGIs $75k-100k, 405.6% for AGIs $100k-200k, 955.8% for AGIs over 200k)
Earned income credit: $1,418 (reported on 4.7% of returns)
Here:
$1,418
State:
$1,909
(% of AGI for various income ranges: 28.4% for AGIs below $25k, 23.2% for AGIs $25k-50k)
Percentage of individuals using paid preparers for their 2020 taxes: 92.2%
Here:
92%
State:
92%
(% for various income ranges: 89.3% for AGIs below $25k, 93.5% for AGIs $25k-50k, 94.0% for AGIs $50k-75k, 89.2% for AGIs $75k-100k, 93.5% for AGIs $100k-200k, 94.1% for AGIs over 200k)
Averages for the 2012 tax year for zip code 01834, filed in 2013:
Average Adjusted Gross Income (AGI) in 2012: $77,972 (Individual Income Tax Returns)
Here:
$77,972
State:
$81,425
Salary/wage: $67,246 (reported on 84.0% of returns)
Here:
$67,246
State:
$64,752
(% of AGI for various income ranges: 68.9% for AGIs below $25k, 66.4% for AGIs $25k-50k, 69.1% for AGIs $50k-75k, 74.7% for AGIs $75k-100k, 82.9% for AGIs $100k-200k, 59.2% for AGIs over 200k)
Taxable interest for individuals: $918 (reported on 47.8% of returns)
This zip code:
$918
Massachusetts:
$2,136
(% of AGI for various income ranges: 2.1% for AGIs below $25k, 1.1% for AGIs $25k-50k, 0.6% for AGIs $50k-75k, 0.6% for AGIs $75k-100k, 0.3% for AGIs $100k-200k, 0.5% for AGIs over 200k)
Ordinary dividends: $2,830 (reported on 30.9% of returns)
Here:
$2,830
State:
$9,473
(% of AGI for various income ranges: 2.4% for AGIs below $25k, 1.8% for AGIs $25k-50k, 1.5% for AGIs $50k-75k, 1.0% for AGIs $75k-100k, 0.9% for AGIs $100k-200k, 0.9% for AGIs over 200k)
Net capital gain/loss in AGI: +$2,979 (reported on 21.9% of returns)
Here:
+$2,979
State:
+$31,437
(% of AGI for various income ranges: 0.3% for AGIs $50k-75k, 0.2% for AGIs $75k-100k, 0.8% for AGIs $100k-200k, 2.0% for AGIs over 200k)
Profit/loss from business: +$23,925 (reported on 14.8% of returns)
Here:
+$23,925
State:
+$20,662
(% of AGI for various income ranges: 5.5% for AGIs below $25k, 5.1% for AGIs $25k-50k, 5.8% for AGIs $50k-75k, 2.5% for AGIs $75k-100k, 2.7% for AGIs $100k-200k, 7.5% for AGIs over 200k)
Taxable individual retirement arrangement distribution: $14,900 (reported on 14.5% of returns)
01834:
$14,900
Massachusetts:
$18,892
(% of AGI for various income ranges: 4.5% for AGIs below $25k, 4.7% for AGIs $25k-50k, 3.5% for AGIs $50k-75k, 3.5% for AGIs $75k-100k, 2.3% for AGIs $100k-200k, 1.9% for AGIs over 200k)
Self-employment retirement plans: $18,700 (reported on 0.9% of returns)
01834:
$18,700
Massachusetts:
$20,669
(% of AGI for various income ranges: 0.6% for AGIs $100k-200k)
Total itemized deductions: $23,829 (20% of AGI, reported on 50.6% of returns)
Here:
$23,829
State:
$28,907
Here:
19.6% of AGI
State:
18.2% of AGI
(% of AGI for various income ranges: 17.1% for AGIs below $25k, 13.1% for AGIs $25k-50k, 17.8% for AGIs $50k-75k, 16.7% for AGIs $75k-100k, 17.0% for AGIs $100k-200k, 11.9% for AGIs over 200k)
Charity contributions: $1,859 (reported on 41.7% of returns)
Here:
$1,859
State:
$4,208
(% of AGI for various income ranges: 0.9% for AGIs below $25k, 0.8% for AGIs $25k-50k, 1.3% for AGIs $50k-75k, 1.0% for AGIs $75k-100k, 1.0% for AGIs $100k-200k, 0.8% for AGIs over 200k)
Taxes paid: $10,807 (reported on 50.3% of returns)
01834:
$10,807
State:
$13,303
(% of AGI for various income ranges: 4.8% for AGIs below $25k, 4.4% for AGIs $25k-50k, 6.7% for AGIs $50k-75k, 7.2% for AGIs $75k-100k, 8.1% for AGIs $100k-200k, 6.5% for AGIs over 200k)
Earned income credit: $1,505 (reported on 6.5% of returns)
Here:
$1,505
State:
$1,971
(% of AGI for various income ranges: 2.2% for AGIs below $25k, 0.4% for AGIs $25k-50k)
Percentage of individuals using paid preparers for their 2012 taxes: 54.3%
Here:
54%
State:
56%
(% for various income ranges: 49.0% for AGIs below $25k, 52.7% for AGIs $25k-50k, 54.3% for AGIs $50k-75k, 60.5% for AGIs $75k-100k, 56.3% for AGIs $100k-200k, 66.7% for AGIs over 200k)
Averages for the 2004 tax year for zip code 01834, filed in 2005:
Average Adjusted Gross Income (AGI) in 2004: $61,507 (Individual Income Tax Returns)
Here:
$61,507
State:
$62,877
Salary/wage: $54,875 (reported on 83.0% of returns)
Here:
$54,875
State:
$52,969
(% of AGI for various income ranges: 89.0% for AGIs below $10k, 60.4% for AGIs $10k-25k, 69.0% for AGIs $25k-50k, 78.7% for AGIs $50k-75k, 84.8% for AGIs $75k-100k, 70.0% for AGIs over 100k)
Taxable interest for individuals: $1,177 (reported on 64.3% of returns)
This zip code:
$1,177
Massachusetts:
$1,945
(% of AGI for various income ranges: 7.5% for AGIs below $10k, 2.8% for AGIs $10k-25k, 2.2% for AGIs $25k-50k, 1.2% for AGIs $50k-75k, 0.6% for AGIs $75k-100k, 0.9% for AGIs over 100k)
Taxable dividends: $2,147 (reported on 34.8% of returns)
Here:
$2,147
State:
$5,323
(% of AGI for various income ranges: 2.7% for AGIs below $10k, 2.1% for AGIs $10k-25k, 1.5% for AGIs $25k-50k, 1.2% for AGIs $50k-75k, 0.7% for AGIs $75k-100k, 1.3% for AGIs over 100k)
Net capital gain/loss: +$5,645 (reported on 26.4% of returns)
Here:
+$5,645
State:
+$20,377
(% of AGI for various income ranges: -0.9% for AGIs below $10k, 1.0% for AGIs $10k-25k, -0.6% for AGIs $25k-50k, 0.7% for AGIs $50k-75k, 1.2% for AGIs $75k-100k, 4.5% for AGIs over 100k)
Profit/loss from business: +$16,574 (reported on 16.9% of returns)
Here:
+$16,574
State:
+$17,837
(% of AGI for various income ranges: 4.5% for AGIs below $10k, 5.9% for AGIs $10k-25k, 7.0% for AGIs $25k-50k, 4.8% for AGIs $50k-75k, 3.8% for AGIs $75k-100k, 4.1% for AGIs over 100k)
IRA payment deduction: $3,217 (reported on 3.5% of returns)
01834:
$3,217
Massachusetts:
$3,100
(% of AGI for various income ranges: 0.5% for AGIs $10k-25k, 0.4% for AGIs $25k-50k, 0.3% for AGIs $50k-75k, 0.2% for AGIs $75k-100k, 0.1% for AGIs over 100k)
Self-employed pension: $8,740 (reported on 1.6% of returns)
Here:
$8,740
Massachusetts:
$14,516
Total itemized deductions: $20,394 (21% of AGI, reported on 51.8% of returns)
Here:
$20,394
State:
$22,573
Here:
21.4% of AGI
State:
19.5% of AGI
(% of AGI for various income ranges: 19.0% for AGIs below $10k, 14.8% for AGIs $10k-25k, 15.8% for AGIs $25k-50k, 20.1% for AGIs $50k-75k, 19.7% for AGIs $75k-100k, 15.6% for AGIs over 100k)
Charity contributions deductions: $1,774 (2% of AGI, reported on 47.7% of returns)
Here:
$1,774
State:
$3,295
Here:
1.8% of AGI
State:
2.7% of AGI
(% of AGI for various income ranges: 0.6% for AGIs below $10k, 0.8% for AGIs $10k-25k, 1.2% for AGIs $25k-50k, 1.7% for AGIs $50k-75k, 1.4% for AGIs $75k-100k, 1.3% for AGIs over 100k)
Total tax: $8,936 (reported on 82.8% of returns)
01834:
$8,936
State:
$11,494
(% of AGI for various income ranges: 2.9% for AGIs below $10k, 4.8% for AGIs $10k-25k, 8.1% for AGIs $25k-50k, 8.6% for AGIs $50k-75k, 9.5% for AGIs $75k-100k, 16.0% for AGIs over 100k)
Earned income credit: $1,383 (reported on 4.2% of returns)
Here:
$1,383
State:
$1,518
Percentage of individuals using paid preparers for their 2004 taxes: 54.7%
Here:
55%
State:
58%
(% for various income ranges: 35.3% for AGIs below $10k, 55.1% for AGIs $10k-25k, 58.0% for AGIs $25k-50k, 59.6% for AGIs $50k-75k, 62.0% for AGIs $75k-100k, 60.7% for AGIs over 100k)
Household received Food Stamps/SNAP in the past 12 months: 129 Household did not receive Food Stamps/SNAP in the past 12 months: 2,485
Women who had a birth in the past 12 months: 56 (59 now married, 0 unmarried) Women who did not have a birth in the past 12 months: 1,242 (714 now married, 512 unmarried)
Housing units in zip code 01834 with a mortgage: 1,855 (236 second mortgage, 240 both second mortgage and home equity loan) Houses without a mortgage: 34
Median monthly owner costs for units with a mortgage: $2,567 Median monthly owner costs for units without a mortgage: $965
Residents with income below the poverty level in 2022:
This zip code:
3.2%
Whole state:
10.4%
Residents with income below 50% of the poverty level in 2022:
This zip code:
2.2%
Whole state:
5.1%
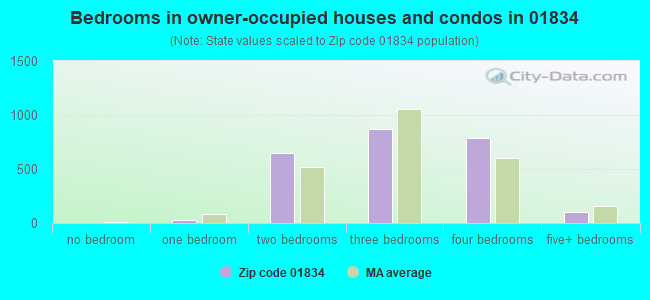
Median number of rooms in houses and condos:
Here:
7.1
State:
6.5
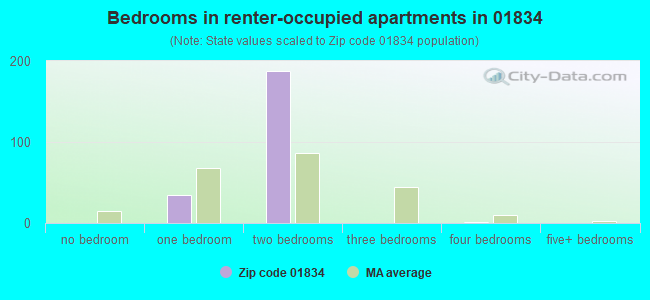
Median number of rooms in apartments:
Here:
3.8
State:
4.0
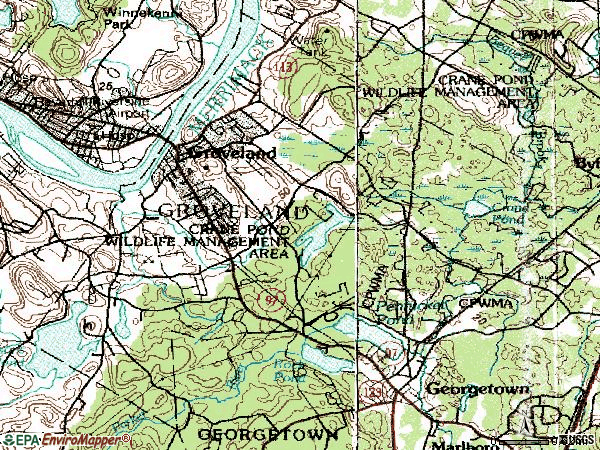
Notable locations in this zip code not listed on our city pages
Notable locations in zip code 01834: Pines Speedway (A), Groveland Fire Department Station 2 (B), Groveland Fire Department Station 1 Headquarters (C). Display/hide their locations on the map
Size of family households: 894 2-persons, 412 3-persons, 299 4-persons, 297 5-persons, 34 7-or-more-persons
Size of nonfamily households: 563 1-person, 161 2-persons
1,347 married couples with children.
86 single-parent households (37 men, 49 women).
96.4% of residents of 01834 zip code speak English at home.
0.9% of residents speak Spanish at home (100% very well).
2.0% of residents speak other Indo-European language at home (60% very well, 9% well, 31% not well).
0.1% of residents speak Asian or Pacific Island language at home (100% very well).
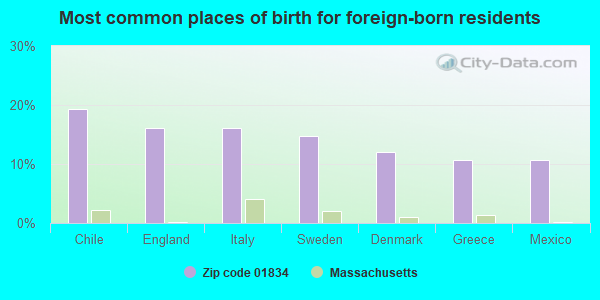
Foreign born population: 223 (3.3%) (51.9% of them are naturalized citizens)
This zip code:
3.3%
Whole state:
18.0%
19%Chile
16%England
16%Italy
15%Sweden
12%Denmark
11%Greece
11%Mexico
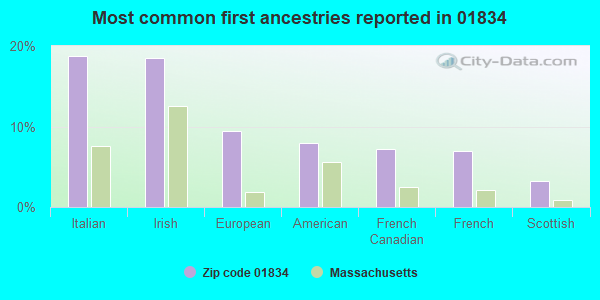
19%Italian
19%Irish
9%European
8%American
7%French Canadian
7%French
3%Scottish
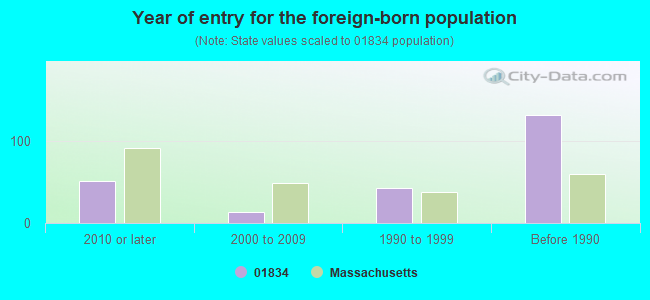
Year of entry for the foreign-born population
512010 or later
132000 to 2009
431990 to 1999
131Before 1990
Facilities with environmental interests located in this zip code:
AW CHESTERTON CO (860 SALEM ST. in GROVELAND, MA)
AIR SYNTHETIC MINOR (AIRS/AFS) SUPERFUND (Superfund database) CRITERIA AND HAZARDOUS AIR POLLUTANT INVENTORY (Inventory of air pollution sources) National Pollutant Discharge Elimination System NON-MAJOR (Tracking pollutant discharge elimination systems) - permit National Pollutant Discharge Elimination System NON-MAJOR (Tracking pollutant discharge elimination systems) - permit HAZARDOUS WASTE BIENNIAL REPORTER (Resource Conservation and Recovery Act (tracking hazardous waste)) Large Quantity Generators, more that 1000 kg of hazardous waste/month (Resource Conservation and Recovery Act (tracking hazardous waste)) - notification TSD (Resource Conservation and Recovery Act (tracking hazardous waste)) TRI REPORTER (Tracking of toxic chemicals releasing facilities) Business SIC classification: INDUSTRIAL ORGANIC CHEMICALS; GASKETS, PACKING, AND SEALING DEVICES; PUMPS AND PUMPING EQUIPMENT; AIR AND GAS COMPRESSORS Business NAICS classification: POLISH AND OTHER SANITATION GOOD MANUFACTURING.; GLASS PRODUCT MANUFACTURING MADE OF PURCHASED GLASS.; GASKET, PACKING, AND SEALING DEVICE MANUFACTURING. Organizations: BRIAN O'DONNELL (CONTACT/OPERATOR)
, AW CHESTERTON CO. (CONTACT/OWNER)
Alternative names: A W CHESTERTON COMPANY, CHESTERTON A W CO
AGGREGATE INDUSTRIES NORTHEAST REGION (YEMMA ROAD in GROVELAND, MA)
AIR SYNTHETIC MINOR (AIRS/AFS) SUPERFUND (Superfund database) CRITERIA AND HAZARDOUS AIR POLLUTANT INVENTORY (Inventory of air pollution sources) (Resource Conservation and Recovery Act (tracking hazardous waste)) Business SIC classification: ASPHALT PAVING MIXTURES AND BLOCKS Organizations: TRIMOUNT BITUMINOUS PRODUCTS CO (CONTACT/OWNER)
Alternative names: BARDON TRIMOUNT INCORPORATED, TRIMOUNT BITUMINOUS PRODUCTS
ELMER S BAGNALL (SCHOOL STREET in GROVELAND, MA)
(National Center for Education Statistics) - STATE ID-745005 Organizations: PENTUCKET (SCHOOL DISTRICT)
APPLIED GRAPHICS INC (310 MAIN ST in GROVELAND, MA)
(Resource Conservation and Recovery Act (tracking hazardous waste)) Business NAICS classification: COMMERCIAL LITHOGRAPHIC PRINTING. Organizations: BERNARD BURNIM (CONTACT/OWNER)
BROS AUTO BODY (306 CENTER ST in GROVELAND, MA)
(Resource Conservation and Recovery Act (tracking hazardous waste)) Organizations: RUSSELL DOUPHINETTE (CONTACT/OWNER)
BLACKMER SYSTEMS ONE (860 SALEM STREET in GROVELAND, MA)
Small Quantity Generators, between 100 kg and 1000 kg of hazardous waste/month (Resource Conservation and Recovery Act (tracking hazardous waste)) - notification
KENDALL CONSTRUCTION CORP. (921 SALEM ST in GROVELAND, MA)
National Pollutant Discharge Elimination System NON-MAJOR (Tracking pollutant discharge elimination systems) - permit
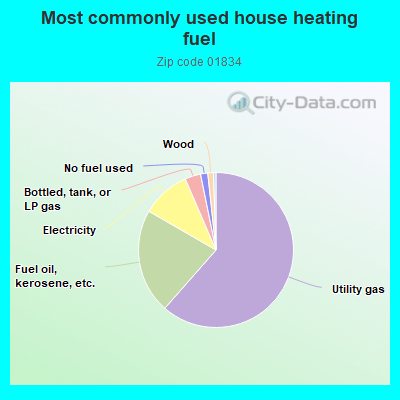
61.6%Utility gas
21.9%Fuel oil, kerosene, etc.
10.2%Electricity
3.3%Bottled, tank, or LP gas
1.5%No fuel used
1.2%Wood
Population in 1990: 5,214. Population change in the 1990s: +824 (+15.8%).
Place of birth for U.S.-born residents:
This state: 5,359
Northeast: 654
Midwest: 41
South: 236
West: 160
66% of the 01834 zip code residents lived in the same house 5 years ago. Out of people who lived in different houses, 70% lived in this county. Out of people who lived in different counties, 50% lived in Massachusetts.
95% of the 01834 zip code residents lived in the same house 1 year ago. Out of people who lived in different houses, 35% moved from this county. Out of people who lived in different houses, 27% moved from different county within same state. Out of people who lived in different houses, 42% moved from different state.
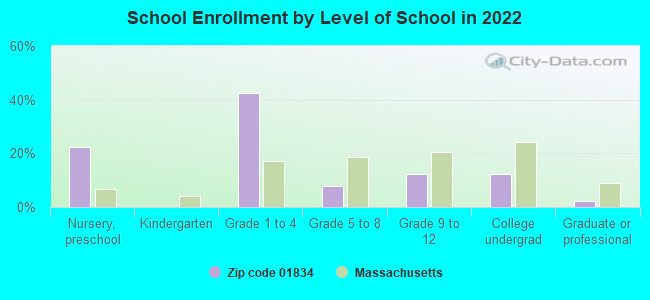
Private vs. public school enrollment:
Students in private schools in grades 1 to 8 (elementary and middle school):
Here:
0.0%
Massachusetts:
10.3%
Students in private schools in grades 9 to 12 (high school): 44
Here:
26.7%
Massachusetts:
12.3%
Students in private undergraduate colleges: 56
Here:
34.5%
Massachusetts:
51.2%
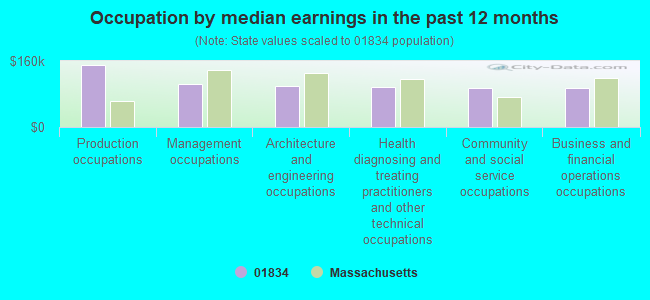
Occupation by median earnings in the past 12 months ($)
149,661Production occupations
103,979Management occupations
99,529Architecture and engineering occupations
97,209Health diagnosing and treating practitioners and other technical occupations
94,183Community and social service occupations
93,954Business and financial operations occupations
Companies with federal contracts located in this zip code (GROVELAND, MA):
UNION MACHINE COMPANY OF LYNN, (6 FEDERAL WAY; small business) 1000 employees, $0 revenue. Veteran Owned Business: $25,210,240 in 318 contractsfrom 1999 to 2006
Contracts for Gas Turbines and Jet Engines, Aircraft; Prime Moving, and Components, Miscellaneous Power Transmission Equipment, Packing and Gasket Materials, Hardware, Commercial, and moreby Navy, Air Force, Defense Logistics Agency, Army, and others Signed by year:2000: $4,311,769; 2001: $4,573,930; 2002: $2,875,676; 2003: $2,629,560; 2004: $2,175,213; 2005: $4,465,357; 2006: $3,190,627.
Biggest contracts:
$1,299,240 with Navy for Gas Turbines and Jet Engines, Aircraft; Prime Moving, and Components. Signed on 2003-09-29. Completion date: 2004-09-28.
$966,138 with Air Force for Gas Turbines and Jet Engines, Aircraft; Prime Moving, and Components. Signed on 2006-06-21. Completion date: 2008-02-28.
$696,800 with Navy for Gas Turbines and Jet Engines, Aircraft; Prime Moving, and Components. Signed on 2001-03-22. Completion date: 2002-06-10.
$679,500 with Air Force for Gas Turbines and Jet Engines, Aircraft; Prime Moving, and Components. Signed on 2005-03-08. Completion date: 2007-03-31.
MILITARY SERVICE SUPPORT LLC (238 MAIN STREET; small business) : $1,076,700 in 5 contractsfrom 2005 to 2006
Contracts for Other Management Support Services, Video Recording and Reproducing Equipment by Army Signed by year:2000: $0; 2001: $0; 2002: $0; 2003: $0; 2004: $0; 2005: $570,000; 2006: $506,700.
Biggest contracts:
$450,000 with Army for Other Management Support Services. Taking place in GA. Signed on 2005-08-29. Completion date: 2005-07-05.
$372,500 with Army for Video Recording and Reproducing Equipment. Taking place in GA. Signed on 2006-01-24. Completion date: 2006-01-23.
$134,200 with Army for Other Management Support Services. Taking place in GA. Signed on 2006-02-24. Completion date: 2005-07-05.
$120,000, same as above.Signed on 2005-08-26. Completion date: 2005-08-26.
A W CHESTERTON COMPANY (860 SALEM ST)
$156,546 with Defense Logistics Agency for Power and Hand Pumps. Signed on 2004-04-20. Completion date: 2004-05-25.
NEW ENGLAND ENVIRONMENTAL TECH (310 MAIN ST; small business) : $22,346 in 9 contractsfrom 2003 to 2006
Contracts for Toxic Substances Support Services, Leaking Underground Storage Tank Support Services, Inspection Services (including commercial testing and lab services, except medical/dental) -- Miscellaneous, Other Environmental Services, Studies, and Analytical Support by Army Signed by year:2000: $0; 2001: $0; 2002: $0; 2003: $15,400; 2004: $8,446; 2005: $10,600; 2006: -$12,100.
Biggest contracts:
$10,600 with Army for Toxic Substances Support Services. Signed on 2005-10-26. Completion date: 2006-11-30.
$9,900 with Army for Leaking Underground Storage Tank Support Services. Signed on 2003-07-28. Completion date: 2004-07-31.
$6,496, same as above.Signed on 2004-03-10. Completion date: 2004-07-31.
$5,500 with Army for Inspection Services (including commercial testing and lab services, except medical/dental) -- Miscellaneous. Signed on 2003-09-19. Completion date: 2003-10-12.
Top industries in this zip code by the number of employees in 2005:
Construction: New Single-Family Housing Construction (except Operative Builders) (20-49 employees: 1 establishment, 5-9 employees: 1 establishment, 1-4 employees: 2 establishments)
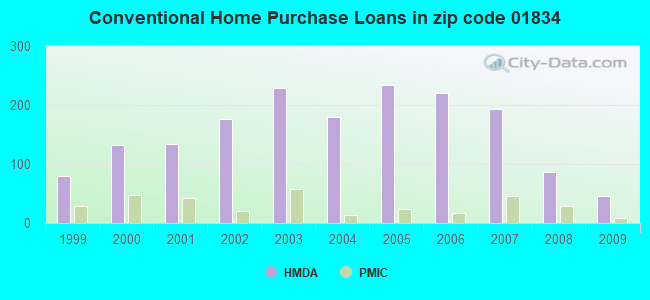
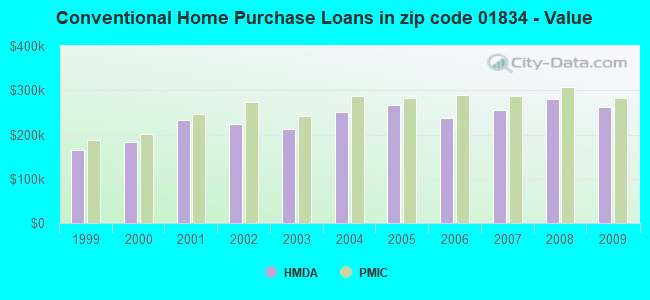
Detailed PMIC statistics for the following Tracts:2641.00
2002 - 2018 National Fire Incident Reporting System (NFIRS) incidents
According to the data from the years 2002 - 2018 the average number of fires per year is 9. The highest number of reported fire incidents - 33 took place in 2016, and the least - 1 in 2003. The data has a rising trend.
When looking into fire subcategories, the most incidents belonged to: Structure Fires (46.2%), and Outside Fires (33.5%).
Fire incident types reported to NFIRS in Zip Code 01834


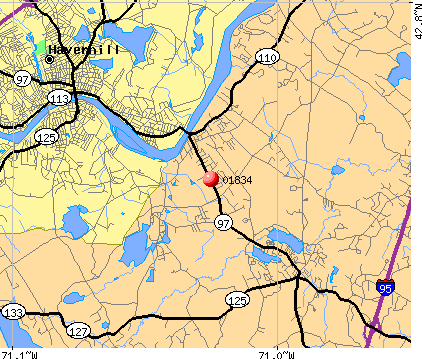 Nearest zip codes: 01833, 01830, 01985, 01921, 01835, 01860.


 According to the data from the years 2002 - 2018 the average number of fires per year is 9. The highest number of reported fire incidents - 33 took place in 2016, and the least - 1 in 2003. The data has a rising trend.
 When looking into fire subcategories, the most incidents belonged to: Structure Fires (46.2%), and Outside Fires (33.5%).