Estimated zip code population in 2022: 26,876 Zip code population in 2010: 25,137 Zip code population in 2000: 24,330
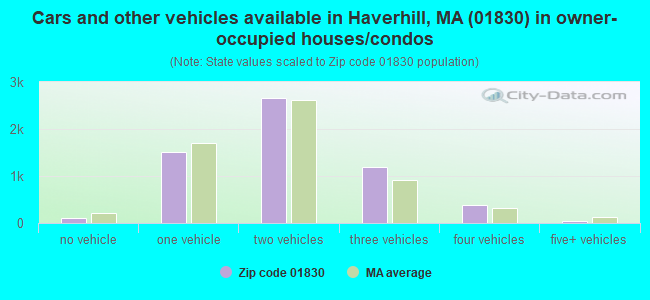
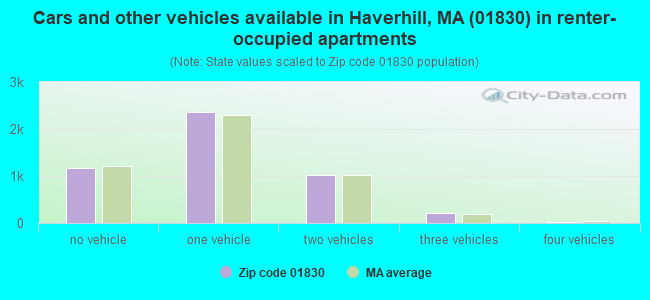
Houses and condos: 11,186 Renter-occupied apartments: 4,774
% of renters here:
45%
State:
38%
March 2022 cost of living index in zip code 01830: 134.1 (high, U.S. average is 100)
Land area: 13.8 sq. mi. Water area: 1.3 sq. mi.
Population density: 1,948 people per square mile
(low).
OSM Map
Google Map
MSN Map
OSM Map
General Map
Google Map
MSN Map
OSM Map
Google Map
MSN Map
OSM Map
Google Map
MSN Map
Please wait while loading the map...
Real estate property taxes paid for housing units in 2022:
This zip code:
1.0% ($4,630)
Massachusetts:
1.0% ($5,536)
Median real estate property taxes paid for housing units with mortgages in 2022: $4,596 (1.0%) Median real estate property taxes paid for housing units with no mortgage in 2022: $4,734 (1.2%)
Averages for the 2020 tax year for zip code 01830, filed in 2021:
Average Adjusted Gross Income (AGI) in 2020: $63,088 (Individual Income Tax Returns)
Here:
$63,088
State:
$105,130
Salary/wage: $55,762 (reported on 85.0% of returns)
Here:
$55,762
State:
$82,951
(% of AGI for various income ranges: 1152.5% for AGIs below $25k, 3593.0% for AGIs $25k-50k, 6769.0% for AGIs $50k-75k, 9762.1% for AGIs $75k-100k, 19440.0% for AGIs $100k-200k, 66419.3% for AGIs over 200k)
Taxable interest for individuals: $949 (reported on 28.5% of returns)
This zip code:
$949
Massachusetts:
$2,361
(% of AGI for various income ranges: 12.3% for AGIs below $25k, 13.6% for AGIs $25k-50k, 23.3% for AGIs $50k-75k, 62.1% for AGIs $75k-100k, 93.0% for AGIs $100k-200k, 674.0% for AGIs over 200k)
Ordinary dividends: $4,847 (reported on 13.9% of returns)
Here:
$4,847
State:
$10,365
(% of AGI for various income ranges: 14.7% for AGIs below $25k, 19.4% for AGIs $25k-50k, 42.1% for AGIs $50k-75k, 75.7% for AGIs $75k-100k, 219.6% for AGIs $100k-200k, 3041.3% for AGIs over 200k)
Net capital gain/loss in AGI: +$10,083 (reported on 12.1% of returns)
Here:
+$10,083
State:
+$48,178
(% of AGI for various income ranges: 1.8% for AGIs below $25k, 9.2% for AGIs $25k-50k, 58.0% for AGIs $50k-75k, 99.1% for AGIs $75k-100k, 372.0% for AGIs $100k-200k, 7116.7% for AGIs over 200k)
Profit/loss from business: +$16,329 (reported on 13.4% of returns)
Here:
+$16,329
State:
+$20,792
(% of AGI for various income ranges: 105.8% for AGIs below $25k, 121.5% for AGIs $25k-50k, 202.2% for AGIs $50k-75k, 378.9% for AGIs $75k-100k, 652.5% for AGIs $100k-200k, 6541.3% for AGIs over 200k)
Taxable individual retirement arrangement distribution: $16,927 (reported on 7.0% of returns)
01830:
$16,927
Massachusetts:
$22,790
(% of AGI for various income ranges: 41.7% for AGIs below $25k, 75.5% for AGIs $25k-50k, 143.3% for AGIs $50k-75k, 275.8% for AGIs $75k-100k, 468.0% for AGIs $100k-200k, 2004.0% for AGIs over 200k)
Self-employed (Keogh) retirement plans: $22,775 (reported on 0.3% of returns)
01830:
$22,775
Massachusetts:
$26,868
(% of AGI for various income ranges: 81.3% for AGIs $100k-200k)
Total itemized deductions: $24,812 (reported on 9.3% of returns)
Here:
$24,812
State:
$36,722
(% of AGI for various income ranges: 71.2% for AGIs below $25k, 110.8% for AGIs $25k-50k, 331.9% for AGIs $50k-75k, 542.9% for AGIs $75k-100k, 940.2% for AGIs $100k-200k, 3957.3% for AGIs over 200k)
Charity contributions: $3,862 (reported on 6.3% of returns)
Here:
$3,862
State:
$12,529
(% of AGI for various income ranges: 2.3% for AGIs below $25k, 7.8% for AGIs $25k-50k, 15.9% for AGIs $50k-75k, 48.0% for AGIs $75k-100k, 121.4% for AGIs $100k-200k, 663.3% for AGIs over 200k)
Taxes paid: $7,814 (reported on 9.3% of returns)
01830:
$7,814
State:
$8,782
(% of AGI for various income ranges: 12.8% for AGIs below $25k, 26.1% for AGIs $25k-50k, 110.2% for AGIs $50k-75k, 200.1% for AGIs $75k-100k, 344.4% for AGIs $100k-200k, 998.7% for AGIs over 200k)
Earned income credit: $1,944 (reported on 14.3% of returns)
Here:
$1,944
State:
$1,909
(% of AGI for various income ranges: 74.9% for AGIs below $25k, 59.8% for AGIs $25k-50k)
Percentage of individuals using paid preparers for their 2020 taxes: 93.4%
Here:
93%
State:
92%
(% for various income ranges: 91.8% for AGIs below $25k, 94.6% for AGIs $25k-50k, 93.9% for AGIs $50k-75k, 93.3% for AGIs $75k-100k, 93.5% for AGIs $100k-200k, 93.5% for AGIs over 200k)
Averages for the 2012 tax year for zip code 01830, filed in 2013:
Average Adjusted Gross Income (AGI) in 2012: $52,490 (Individual Income Tax Returns)
Here:
$52,490
State:
$81,425
Salary/wage: $47,587 (reported on 86.5% of returns)
Here:
$47,587
State:
$64,752
(% of AGI for various income ranges: 75.2% for AGIs below $25k, 81.0% for AGIs $25k-50k, 81.3% for AGIs $50k-75k, 81.1% for AGIs $75k-100k, 83.2% for AGIs $100k-200k, 58.5% for AGIs over 200k)
Taxable interest for individuals: $1,074 (reported on 32.7% of returns)
This zip code:
$1,074
Massachusetts:
$2,136
(% of AGI for various income ranges: 1.0% for AGIs below $25k, 0.5% for AGIs $25k-50k, 0.4% for AGIs $50k-75k, 0.6% for AGIs $75k-100k, 0.5% for AGIs $100k-200k, 1.6% for AGIs over 200k)
Ordinary dividends: $3,410 (reported on 16.6% of returns)
Here:
$3,410
State:
$9,473
(% of AGI for various income ranges: 1.3% for AGIs below $25k, 0.6% for AGIs $25k-50k, 0.5% for AGIs $50k-75k, 0.8% for AGIs $75k-100k, 0.8% for AGIs $100k-200k, 3.4% for AGIs over 200k)
Net capital gain/loss in AGI: +$5,171 (reported on 10.2% of returns)
Here:
+$5,171
State:
+$31,437
(% of AGI for various income ranges: 0.2% for AGIs $25k-50k, 0.2% for AGIs $75k-100k, 0.7% for AGIs $100k-200k, 6.3% for AGIs over 200k)
Profit/loss from business: +$12,301 (reported on 12.1% of returns)
Here:
+$12,301
State:
+$20,662
(% of AGI for various income ranges: 5.7% for AGIs below $25k, 2.8% for AGIs $25k-50k, 2.8% for AGIs $50k-75k, 2.5% for AGIs $75k-100k, 2.6% for AGIs $100k-200k, 1.7% for AGIs over 200k)
Taxable individual retirement arrangement distribution: $13,357 (reported on 8.5% of returns)
01830:
$13,357
Massachusetts:
$18,892
(% of AGI for various income ranges: 2.3% for AGIs below $25k, 1.9% for AGIs $25k-50k, 2.2% for AGIs $50k-75k, 1.8% for AGIs $75k-100k, 2.7% for AGIs $100k-200k, 1.4% for AGIs over 200k)
Self-employment retirement plans: $13,440 (reported on 0.4% of returns)
01830:
$13,440
Massachusetts:
$20,669
Total itemized deductions: $20,512 (21% of AGI, reported on 33.9% of returns)
Here:
$20,512
State:
$28,907
Here:
21.1% of AGI
State:
18.2% of AGI
(% of AGI for various income ranges: 8.0% for AGIs below $25k, 8.8% for AGIs $25k-50k, 14.1% for AGIs $50k-75k, 15.2% for AGIs $75k-100k, 16.2% for AGIs $100k-200k, 12.6% for AGIs over 200k)
Charity contributions: $1,876 (reported on 26.0% of returns)
Here:
$1,876
State:
$4,208
(% of AGI for various income ranges: 0.4% for AGIs below $25k, 0.5% for AGIs $25k-50k, 0.8% for AGIs $50k-75k, 0.9% for AGIs $75k-100k, 1.1% for AGIs $100k-200k, 1.6% for AGIs over 200k)
Taxes paid: $8,509 (reported on 33.8% of returns)
01830:
$8,509
State:
$13,303
(% of AGI for various income ranges: 2.2% for AGIs below $25k, 2.7% for AGIs $25k-50k, 5.2% for AGIs $50k-75k, 6.0% for AGIs $75k-100k, 7.4% for AGIs $100k-200k, 6.9% for AGIs over 200k)
Earned income credit: $2,089 (reported on 16.3% of returns)
Here:
$2,089
State:
$1,971
(% of AGI for various income ranges: 5.6% for AGIs below $25k, 0.8% for AGIs $25k-50k)
Percentage of individuals using paid preparers for their 2012 taxes: 52.8%
Here:
53%
State:
56%
(% for various income ranges: 49.5% for AGIs below $25k, 51.4% for AGIs $25k-50k, 55.4% for AGIs $50k-75k, 54.9% for AGIs $75k-100k, 59.6% for AGIs $100k-200k, 71.4% for AGIs over 200k)
Averages for the 2004 tax year for zip code 01830, filed in 2005:
Average Adjusted Gross Income (AGI) in 2004: $44,969 (Individual Income Tax Returns)
Here:
$44,969
State:
$62,877
Salary/wage: $41,668 (reported on 86.2% of returns)
Here:
$41,668
State:
$52,969
(% of AGI for various income ranges: 90.9% for AGIs below $10k, 74.2% for AGIs $10k-25k, 83.1% for AGIs $25k-50k, 83.2% for AGIs $50k-75k, 86.6% for AGIs $75k-100k, 73.0% for AGIs over 100k)
Taxable interest for individuals: $1,144 (reported on 50.0% of returns)
This zip code:
$1,144
Massachusetts:
$1,945
(% of AGI for various income ranges: 4.5% for AGIs below $10k, 2.0% for AGIs $10k-25k, 1.3% for AGIs $25k-50k, 1.1% for AGIs $50k-75k, 0.9% for AGIs $75k-100k, 1.2% for AGIs over 100k)
Taxable dividends: $2,123 (reported on 21.9% of returns)
Here:
$2,123
State:
$5,323
(% of AGI for various income ranges: 2.1% for AGIs below $10k, 1.2% for AGIs $10k-25k, 0.7% for AGIs $25k-50k, 0.6% for AGIs $50k-75k, 0.5% for AGIs $75k-100k, 1.7% for AGIs over 100k)
Net capital gain/loss: +$7,002 (reported on 18.1% of returns)
Here:
+$7,002
State:
+$20,377
(% of AGI for various income ranges: -1.8% for AGIs below $10k, 0.3% for AGIs $10k-25k, 0.2% for AGIs $25k-50k, 0.3% for AGIs $50k-75k, 1.3% for AGIs $75k-100k, 8.0% for AGIs over 100k)
Profit/loss from business: +$12,133 (reported on 13.3% of returns)
Here:
+$12,133
State:
+$17,837
(% of AGI for various income ranges: 6.9% for AGIs below $10k, 5.5% for AGIs $10k-25k, 3.9% for AGIs $25k-50k, 3.3% for AGIs $50k-75k, 2.4% for AGIs $75k-100k, 3.5% for AGIs over 100k)
IRA payment deduction: $2,811 (reported on 2.8% of returns)
01830:
$2,811
Massachusetts:
$3,100
(% of AGI for various income ranges: 0.4% for AGIs below $10k, 0.2% for AGIs $10k-25k, 0.3% for AGIs $25k-50k, 0.2% for AGIs $50k-75k, 0.1% for AGIs $75k-100k, 0.1% for AGIs over 100k)
Self-employed pension: $10,973 (reported on 0.7% of returns)
Here:
$10,973
Massachusetts:
$14,516
Total itemized deductions: $17,822 (23% of AGI, reported on 38.9% of returns)
Here:
$17,822
State:
$22,573
Here:
23.2% of AGI
State:
19.5% of AGI
(% of AGI for various income ranges: 13.2% for AGIs below $10k, 12.4% for AGIs $10k-25k, 12.8% for AGIs $25k-50k, 17.9% for AGIs $50k-75k, 17.9% for AGIs $75k-100k, 15.3% for AGIs over 100k)
Charity contributions deductions: $1,684 (2% of AGI, reported on 33.9% of returns)
Here:
$1,684
State:
$3,295
Here:
2.1% of AGI
State:
2.7% of AGI
(% of AGI for various income ranges: 0.5% for AGIs below $10k, 0.7% for AGIs $10k-25k, 0.9% for AGIs $25k-50k, 1.3% for AGIs $50k-75k, 1.4% for AGIs $75k-100k, 1.6% for AGIs over 100k)
Total tax: $6,243 (reported on 78.2% of returns)
01830:
$6,243
State:
$11,494
(% of AGI for various income ranges: 2.6% for AGIs below $10k, 4.5% for AGIs $10k-25k, 7.8% for AGIs $25k-50k, 9.2% for AGIs $50k-75k, 10.4% for AGIs $75k-100k, 16.4% for AGIs over 100k)
Earned income credit: $1,496 (reported on 12.9% of returns)
Here:
$1,496
State:
$1,518
Percentage of individuals using paid preparers for their 2004 taxes: 57.5%
Here:
58%
State:
58%
(% for various income ranges: 49.5% for AGIs below $10k, 58.5% for AGIs $10k-25k, 56.0% for AGIs $25k-50k, 62.7% for AGIs $50k-75k, 60.5% for AGIs $75k-100k, 65.3% for AGIs over 100k)
Likely homosexual households (counted as self-reported same-sex unmarried-partner households)
Lesbian couples: 0.2% of all households
Gay men: 0.3% of all households
Household received Food Stamps/SNAP in the past 12 months: 3,033 Household did not receive Food Stamps/SNAP in the past 12 months: 7,914
Women who had a birth in the past 12 months: 341 (188 now married, 140 unmarried) Women who did not have a birth in the past 12 months: 5,899 (2,187 now married, 3,710 unmarried)
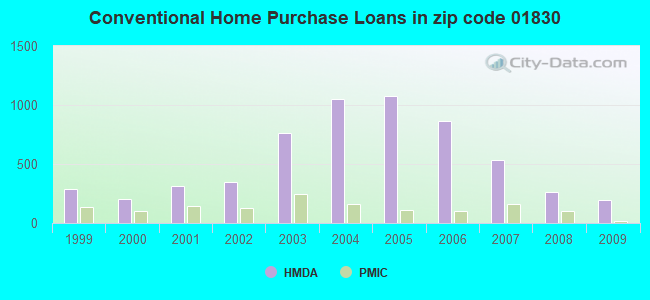
Housing units in zip code 01830 with a mortgage: 4,345 (696 second mortgage, 26 home equity loan, 556 both second mortgage and home equity loan) Houses without a mortgage: 143
Median monthly owner costs for units with a mortgage: $2,303 Median monthly owner costs for units without a mortgage: $909
Residents with income below the poverty level in 2022:
This zip code:
15.2%
Whole state:
10.4%
Residents with income below 50% of the poverty level in 2022:
This zip code:
6.5%
Whole state:
5.1%
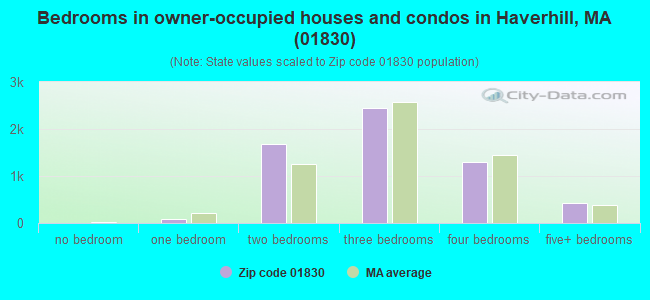
Median number of rooms in houses and condos:
Here:
6.3
State:
6.5
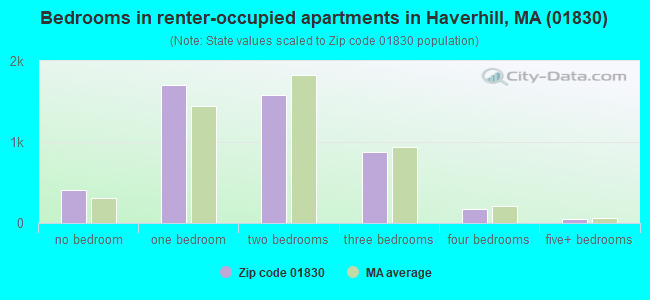
Median number of rooms in apartments:
Here:
3.8
State:
4.0
Notable locations in this zip code not listed on our city pages
Notable locations in zip code 01830: Haverhill Country Club (A), Central Plaza (B), Haverhill City Hall (C), The Whittier Pavilion (D), Haverhill Fire Department Station 9 (E), Haverhill Fire Department Fire Chief (F), Haverhill Fire Department Station 3 Headquarters (G), Haverhill Public Library (H), Haverhill Municipal Hospital Medical Library (I), Haverhill Fire Department Station 2 (J), Golden Hill School Library Library (K), Bentley Library (L). Display/hide their locations on the map
Churches in zip code 01830 include: East Parrish Church (A), Children of Israel Church (B), Holy Apostle Peter and Paul Church (C), Haverhill Community Church (D), Grace Church (E), First Congregational Church (F), First Baptist Church (G), Corner Stone Christian Church (H), Church of Jesus Christ United Church (I). Display/hide their locations on the map
Lakes and reservoirs: Frye Pond (A), Lake Pentucket (B), Kenoza Lake (C), Millvale Reservoir (D), Lake Saltonstall (E). Display/hide their locations on the map
2,801 married couples with children.
2,435 single-parent households (297 men, 2,138 women).
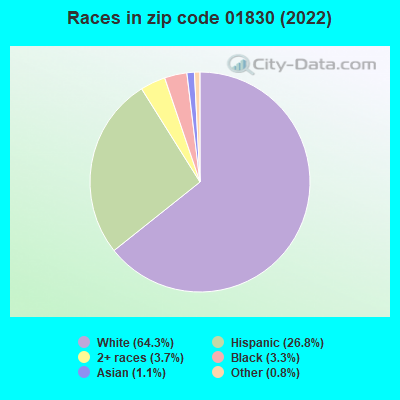
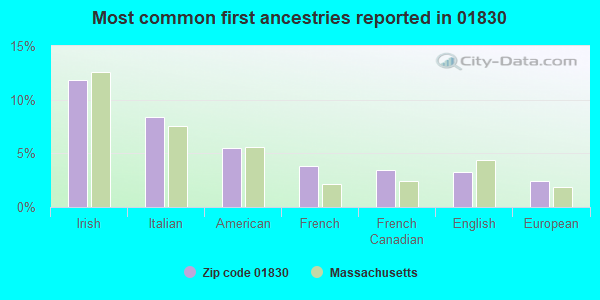
74.1% of residents of 01830 zip code speak English at home.
19.9% of residents speak Spanish at home (67% very well, 11% well, 15% not well, 8% not at all).
4.6% of residents speak other Indo-European language at home (75% very well, 13% well, 8% not well, 5% not at all).
0.5% of residents speak Asian or Pacific Island language at home (97% very well, 3% well).
0.6% of residents speak other language at home (72% very well, 28% well).
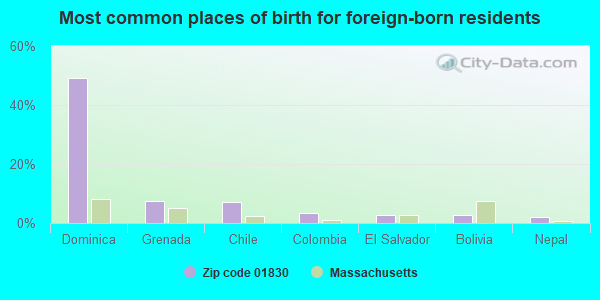
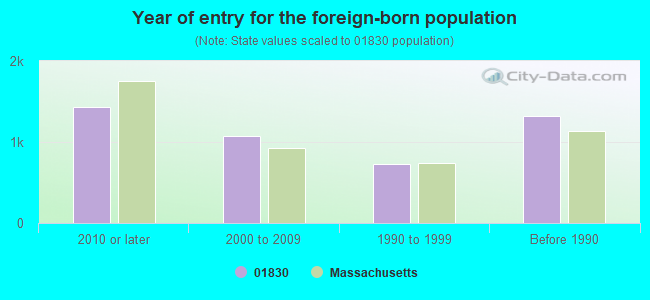
Foreign born population: 3,648 (13.6%) (58.1% of them are naturalized citizens)
Major facilities with environmental interests located in this zip code:
NORTHERN ESSEX COMMUNITY COLLEGE (100 ELLIOT WAY in HAVERHILL, MA)
ENFORCEMENT/COMPLIANCE ACTIVITY (Integrated Compliance Information System) - ICIS-01-2003-9204, FORMAL ENFORCEMENT ACTION (Integrated Compliance Information System) - ICIS-01-2003-9204, FORMAL ENFORCEMENT ACTION
NORTH CENTRAL INC (60 NEWARK STREET in HAVERHILL, MA)
(Integrated Compliance Information System) - ICIS-01-2003-0077, FORMAL ENFORCEMENT ACTION HAZARDOUS WASTE BIENNIAL REPORTER (Resource Conservation and Recovery Act (tracking hazardous waste)) (Resource Conservation and Recovery Act (tracking hazardous waste)) Organizations: RICHARD COOPER JOHN BRUBACHER (CONTACT/OWNER)
Alternative names: NORTH CENTRA INCORPORATED
BARDETTI VOLKSWAGON (915 SOUTH MAIN STREET in HAVERHILL, MA)
(Integrated Compliance Information System) - ICIS-HQ-1978-0001, FORMAL ENFORCEMENT ACTION (Resource Conservation and Recovery Act (tracking hazardous waste)) Business SIC classification: MOTOR VEHICLE DEALERS (NEW AND USED)
ENTERPRISE CIRCUITS CO (104 ESSEX STREET in HAVERHILL, MA)
(Resource Conservation and Recovery Act (tracking hazardous waste)) Business NAICS classification: OTHER ELECTRONIC COMPONENT MANUFACTURING. Organizations: PHILIP M NUTE (CONTACT/OWNER)
, NAVIN PATEL (CONTACT/OWNER)
Alternative names: GALAXY CIRCUITS INC
DYETEX INC (14 STEVENS ST in HAVERHILL, MA)
AIR SYNTHETIC MINOR (AIRS/AFS) CRITERIA AND HAZARDOUS AIR POLLUTANT INVENTORY (Inventory of air pollution sources) (Resource Conservation and Recovery Act (tracking hazardous waste)) TRI REPORTER (Tracking of toxic chemicals releasing facilities) Business SIC classification: CORDAGE AND TWINE Business NAICS classification: TEXTILE AND FABRIC FINISHING (EXCEPT BROADWOVEN FABRIC) MILLS.
JOHN G WHITTIER (256 CONCORD STREET in HAVERHILL, MA)
(National Center for Education Statistics) - STATE ID-128085 Organizations: HAVERHILL (SCHOOL DISTRICT)
BURNHAM ELEMENTARY (45 FOUNTAIN STREET in HAVERHILL, MA)
(National Center for Education Statistics) - STATE ID-128010 Organizations: HAVERHILL (SCHOOL DISTRICT)
DR PAUL NETTLE (150 BOARDMAN STREET in HAVERHILL, MA)
(National Center for Education Statistics) - STATE ID-128050 Organizations: HAVERHILL (SCHOOL DISTRICT)
CIRCUIT TEST INCORPORATED (179-181 FERRY ROAD in HAVERHILL, MA)
AIR MINOR (AIRS/AFS) (Resource Conservation and Recovery Act (tracking hazardous waste)) Business NAICS classification: ALL OTHER BUSINESS SUPPORT SERVICES. Organizations: AL BRASWELL SR (CONTACT/OWNER)
BRENTWOOD FURNITURE1 (115 HALE ST in HAVERHILL, MA)
AIR MINOR (AIRS/AFS) (Resource Conservation and Recovery Act (tracking hazardous waste)) Business SIC classification: WOOD HOUSEHOLD FURNITURE, UPHOLSTERED Business NAICS classification: UPHOLSTERED HOUSEHOLD FURNITURE MANUFACTURING. Organizations: CHARLES A LAGASSE (CONTACT/OWNER)
Alternative names: BRENTWOOD FUNITURE INC
ORNSTEIN REALITY (RAILROAD AVENUE in HAVERHILL, MA)
AIR MINOR (AIRS/AFS) (Resource Conservation and Recovery Act (tracking hazardous waste)) Business SIC classification: REAL ESTATE AGENTS AND MANAGERS Organizations: EDWARD F ORNSTEEN (CONTACT/OWNER)
Alternative names: ORNSTEEN WILLIAM HEEL CO
OMEGA ENGINEERING CORP (11 ROGERS RD in HAVERHILL, MA)
(Resource Conservation and Recovery Act (tracking hazardous waste)) Business NAICS classification: SPECIAL DIE AND TOOL, DIE SET, JIG, AND FIXTURE MANUFACTURING.
YORK HANDLING & TREATING SERVI (1445 HILLSDALE AVE in HAVERHILL, MA)
(Resource Conservation and Recovery Act (tracking hazardous waste)) Organizations: PONDELLI JOHN J (CONTACT/OWNER)
Alternative names: YORK HANDLING & TREATING SERVICES
Housing units lacking complete plumbing facilities: 0.1% Housing units lacking complete kitchen facilities: 2.5%
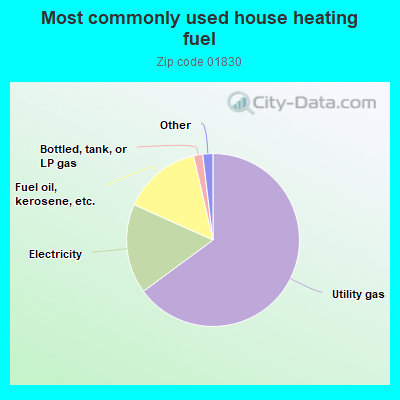
64.9%Utility gas
16.8%Electricity
14.7%Fuel oil, kerosene, etc.
1.7%Bottled, tank, or LP gas
0.7%Wood
0.6%Other fuel
Population in 1990: 22,445. Population change in the 1990s: +1,885 (+8.4%).
Place of birth for U.S.-born residents:
This state: 17,143
Northeast: 3,108
Midwest: 349
South: 1,159
West: 465
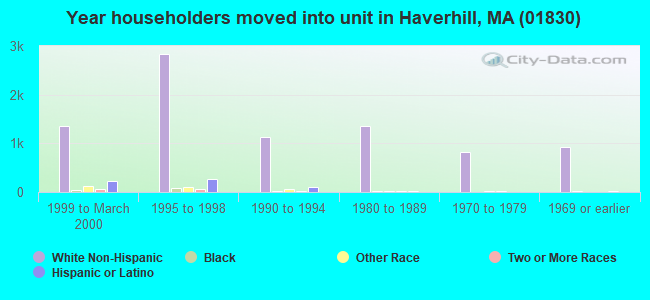
53% of the 01830 zip code residents lived in the same house 5 years ago. Out of people who lived in different houses, 73% lived in this county. Out of people who lived in different counties, 50% lived in Massachusetts.
89% of the 01830 zip code residents lived in the same house 1 year ago. Out of people who lived in different houses, 62% moved from this county. Out of people who lived in different houses, 15% moved from different county within same state. Out of people who lived in different houses, 16% moved from different state. Out of people who lived in different houses, 4% moved from abroad.
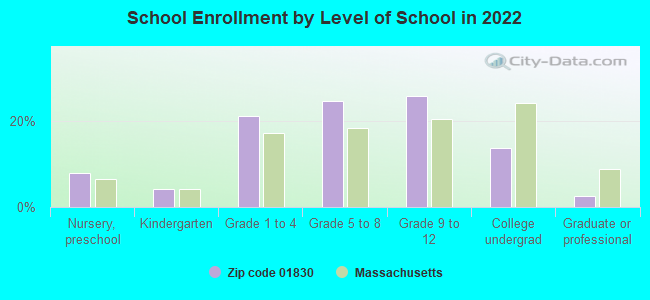
Private vs. public school enrollment:
Students in private schools in grades 1 to 8 (elementary and middle school): 152
Here:
5.6%
Massachusetts:
10.3%
Students in private schools in grades 9 to 12 (high school): 189
Here:
12.3%
Massachusetts:
12.3%
Students in private undergraduate colleges: 188
Here:
23.4%
Massachusetts:
51.2%
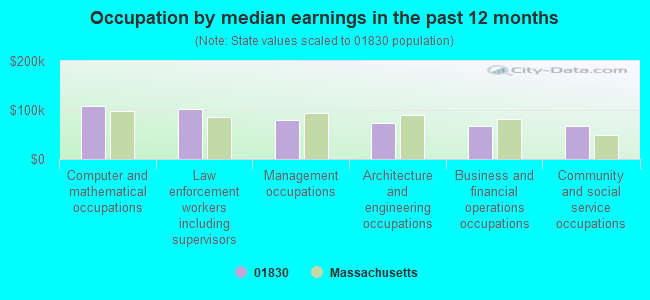
Occupation by median earnings in the past 12 months ($)
108,373Computer and mathematical occupations
102,407Law enforcement workers including supervisors
79,573Management occupations
74,300Architecture and engineering occupations
68,364Business and financial operations occupations
66,726Community and social service occupations
Companies with federal contracts located in this zip code:
ELATEC TECHNOLOGY CORP (260 PRIMROSE STREET in HAVERHILL, MA) : $159,300 in 3 contractsfrom 2002 to 2004
$107,000 with Army for Industrial Furnaces, Kilns, Lehrs, and Ovens. Signed on 2002-09-28. Completion date: 2003-01-17.
$32,000, same as above.Signed on 2004-04-14. Completion date: 2004-07-15.
$20,300, same as above.Signed on 2003-11-05. Completion date: 2004-07-15.
HEARTLAND COMMERCIAL LAUNDRY (25 MULBERRY ST in HAVERHILL, MA; small business)
$6,804 with Air Force for Laundry and DryCleaning Services. Signed on 2004-10-01. Completion date: 2005-09-30.
J W GRIFFIN ELECTRICAL, INC (26 COFFIN AVE in HAVERHILL, MA; small business)
$1,765 with Army for Maintenance, Repair or Alteration of Real Property -- Family Housing Facilities. Signed on 2004-12-14. Completion date: 2005-01-10.
Top industries in this zip code by the number of employees in 2005:
Health Care and Social Assistance: Nursing Care Facilities (100-249 employees: 4 establishments, 50-99 employees: 2 establishments, 1-4 employees: 1 establishment)
Health Care and Social Assistance: General Medical and Surgical Hospitals (500-999: 1)
2002 - 2018 National Fire Incident Reporting System (NFIRS) incidents
According to the data from the years 2002 - 2018 the average number of fires per year is 104. The highest number of reported fire incidents - 281 took place in 2016, and the least - 0 in 2005. The data has a rising trend.
When looking into fire subcategories, the most incidents belonged to: Structure Fires (45.5%), and Outside Fires (37.5%).
Fire incident types reported to NFIRS in Zip Code 01830


 Nearest zip codes: 01834, 01860, 01835, 03865, 03858, 01832.
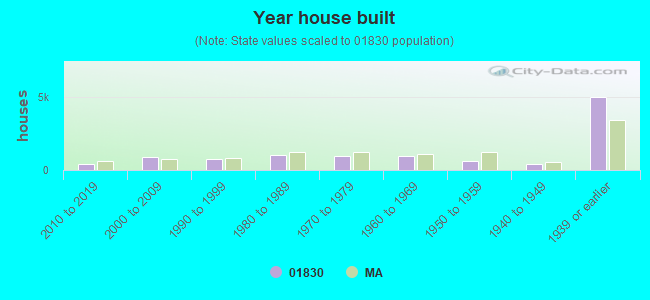


 According to the data from the years 2002 - 2018 the average number of fires per year is 104. The highest number of reported fire incidents - 281 took place in 2016, and the least - 0 in 2005. The data has a rising trend.
 When looking into fire subcategories, the most incidents belonged to: Structure Fires (45.5%), and Outside Fires (37.5%).