Estimated zip code population in 2022: 14,676 Zip code population in 2010: 13,682 Zip code population in 2000: 13,416
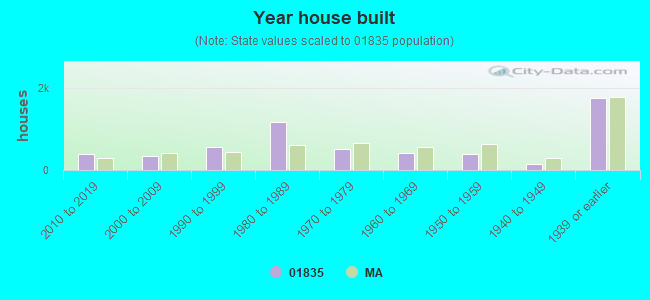
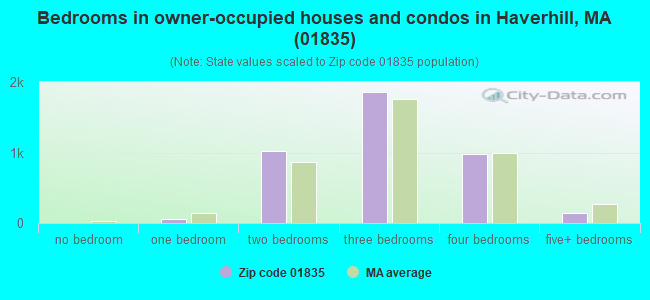
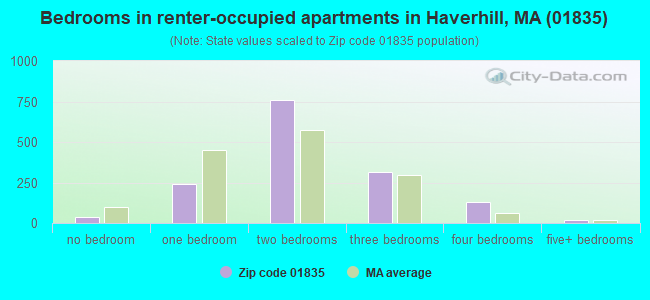
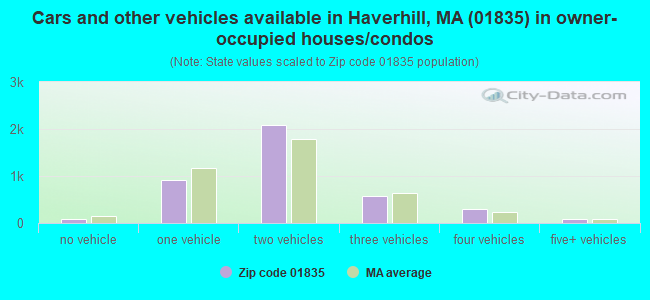
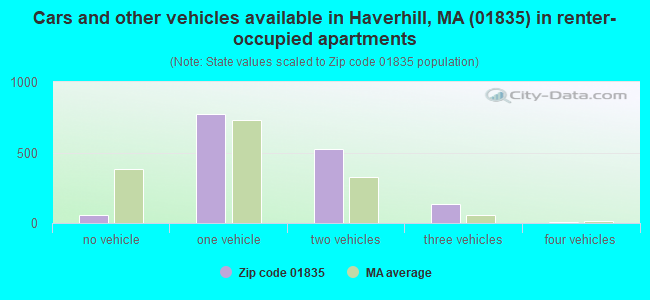
Houses and condos: 5,707 Renter-occupied apartments: 1,499
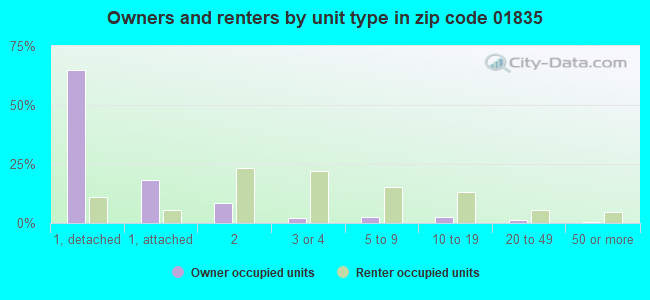
% of renters here:
27%
State:
38%
March 2022 cost of living index in zip code 01835: 131.9 (high, U.S. average is 100)
Land area: 7.8 sq. mi. Water area: 0.9 sq. mi.
Population density: 1,879 people per square mile
(low).
OSM Map
Google Map
MSN Map
OSM Map
General Map
Google Map
MSN Map
OSM Map
Google Map
MSN Map
OSM Map
Google Map
MSN Map
Please wait while loading the map...
Real estate property taxes paid for housing units in 2022:
This zip code:
1.0% ($4,583)
Massachusetts:
1.0% ($5,536)
Median real estate property taxes paid for housing units with mortgages in 2022: $4,447 (0.9%) Median real estate property taxes paid for housing units with no mortgage in 2022: $5,056 (1.2%)
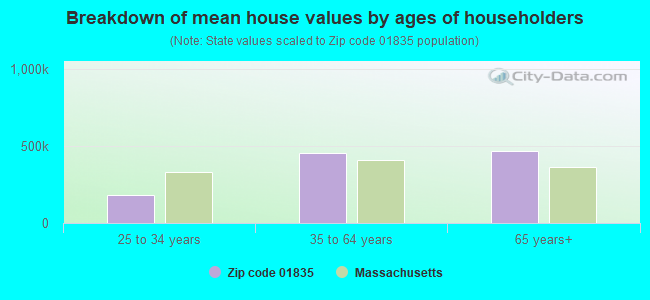
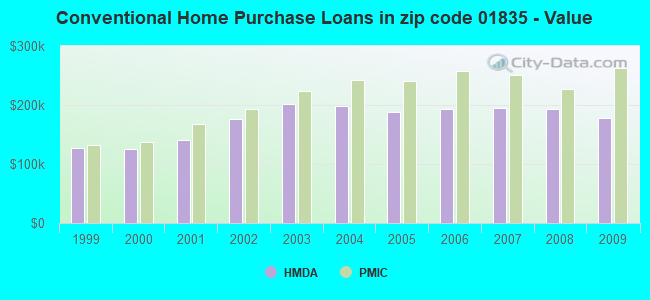
Estimated median house/condo value in 2022: $459,009
01835:
$459,009
Massachusetts:
$534,700
According to our research of Massachusetts and other state lists, there were 6 registered sex offenders living in 01835 zip code as of April 26, 2024. The ratio of all residents to sex offenders in zip code 01835 is 2,224 to 1. The ratio of registered sex offenders to all residents in this zip code is lower than the state average.
Median resident age:
This zip code:
36.1 years
Massachusetts median age:
40.3 years
Average household size:
This zip code:
2.6 people
Massachusetts:
2.4 people
Averages for the 2020 tax year for zip code 01835, filed in 2021:
Average Adjusted Gross Income (AGI) in 2020: $72,752 (Individual Income Tax Returns)
Here:
$72,752
State:
$105,130
Salary/wage: $64,905 (reported on 85.3% of returns)
Here:
$64,905
State:
$82,951
(% of AGI for various income ranges: 1159.3% for AGIs below $25k, 3569.7% for AGIs $25k-50k, 6660.0% for AGIs $50k-75k, 10126.4% for AGIs $75k-100k, 19280.0% for AGIs $100k-200k, 72458.3% for AGIs over 200k)
Taxable interest for individuals: $923 (reported on 35.0% of returns)
This zip code:
$923
Massachusetts:
$2,361
(% of AGI for various income ranges: 17.1% for AGIs below $25k, 19.4% for AGIs $25k-50k, 41.8% for AGIs $50k-75k, 79.8% for AGIs $75k-100k, 87.6% for AGIs $100k-200k, 369.2% for AGIs over 200k)
Ordinary dividends: $3,545 (reported on 17.6% of returns)
Here:
$3,545
State:
$10,365
(% of AGI for various income ranges: 22.8% for AGIs below $25k, 28.3% for AGIs $25k-50k, 45.5% for AGIs $50k-75k, 66.7% for AGIs $75k-100k, 172.7% for AGIs $100k-200k, 1661.7% for AGIs over 200k)
Net capital gain/loss in AGI: +$12,894 (reported on 15.2% of returns)
Here:
+$12,894
State:
+$48,178
(% of AGI for various income ranges: 10.3% for AGIs below $25k, 13.7% for AGIs $25k-50k, 53.8% for AGIs $50k-75k, 102.2% for AGIs $75k-100k, 409.1% for AGIs $100k-200k, 9123.3% for AGIs over 200k)
Profit/loss from business: +$16,164 (reported on 13.1% of returns)
Here:
+$16,164
State:
+$20,792
(% of AGI for various income ranges: 94.4% for AGIs below $25k, 109.7% for AGIs $25k-50k, 226.5% for AGIs $50k-75k, 286.4% for AGIs $75k-100k, 670.8% for AGIs $100k-200k, 3839.2% for AGIs over 200k)
Taxable individual retirement arrangement distribution: $17,260 (reported on 8.2% of returns)
01835:
$17,260
Massachusetts:
$22,790
(% of AGI for various income ranges: 60.3% for AGIs below $25k, 99.1% for AGIs $25k-50k, 195.3% for AGIs $50k-75k, 243.8% for AGIs $75k-100k, 490.1% for AGIs $100k-200k, 1350.8% for AGIs over 200k)
Self-employed (Keogh) retirement plans: $22,625 (reported on 0.5% of returns)
01835:
$22,625
Massachusetts:
$26,868
(% of AGI for various income ranges: 54.2% for AGIs $75k-100k, 465.0% for AGIs over 200k)
Total itemized deductions: $23,842 (reported on 11.4% of returns)
Here:
$23,842
State:
$36,722
(% of AGI for various income ranges: 81.3% for AGIs below $25k, 178.4% for AGIs $25k-50k, 386.3% for AGIs $50k-75k, 635.8% for AGIs $75k-100k, 825.9% for AGIs $100k-200k, 2931.7% for AGIs over 200k)
Charity contributions: $3,455 (reported on 8.1% of returns)
Here:
$3,455
State:
$12,529
(% of AGI for various income ranges: 2.7% for AGIs below $25k, 7.4% for AGIs $25k-50k, 30.1% for AGIs $50k-75k, 45.0% for AGIs $75k-100k, 94.3% for AGIs $100k-200k, 617.5% for AGIs over 200k)
Taxes paid: $8,295 (reported on 11.3% of returns)
01835:
$8,295
State:
$8,782
(% of AGI for various income ranges: 15.1% for AGIs below $25k, 42.8% for AGIs $25k-50k, 138.0% for AGIs $50k-75k, 252.7% for AGIs $75k-100k, 317.0% for AGIs $100k-200k, 920.0% for AGIs over 200k)
Earned income credit: $1,871 (reported on 9.3% of returns)
Here:
$1,871
State:
$1,909
(% of AGI for various income ranges: 60.1% for AGIs below $25k, 42.8% for AGIs $25k-50k)
Percentage of individuals using paid preparers for their 2020 taxes: 92.5%
Here:
93%
State:
92%
(% for various income ranges: 90.9% for AGIs below $25k, 93.5% for AGIs $25k-50k, 94.1% for AGIs $50k-75k, 91.7% for AGIs $75k-100k, 92.7% for AGIs $100k-200k, 92.1% for AGIs over 200k)
Averages for the 2012 tax year for zip code 01835, filed in 2013:
Average Adjusted Gross Income (AGI) in 2012: $61,070 (Individual Income Tax Returns)
Here:
$61,070
State:
$81,425
Salary/wage: $56,189 (reported on 87.8% of returns)
Here:
$56,189
State:
$64,752
(% of AGI for various income ranges: 71.9% for AGIs below $25k, 80.0% for AGIs $25k-50k, 80.7% for AGIs $50k-75k, 83.2% for AGIs $75k-100k, 86.0% for AGIs $100k-200k, 71.2% for AGIs over 200k)
Taxable interest for individuals: $837 (reported on 38.0% of returns)
This zip code:
$837
Massachusetts:
$2,136
(% of AGI for various income ranges: 1.3% for AGIs below $25k, 0.6% for AGIs $25k-50k, 0.6% for AGIs $50k-75k, 0.3% for AGIs $75k-100k, 0.4% for AGIs $100k-200k, 0.6% for AGIs over 200k)
Ordinary dividends: $2,429 (reported on 19.5% of returns)
Here:
$2,429
State:
$9,473
(% of AGI for various income ranges: 1.2% for AGIs below $25k, 0.5% for AGIs $25k-50k, 1.0% for AGIs $50k-75k, 0.5% for AGIs $75k-100k, 0.7% for AGIs $100k-200k, 1.2% for AGIs over 200k)
Net capital gain/loss in AGI: +$4,810 (reported on 12.3% of returns)
Here:
+$4,810
State:
+$31,437
(% of AGI for various income ranges: 0.2% for AGIs $50k-75k, 0.9% for AGIs $100k-200k, 4.3% for AGIs over 200k)
Profit/loss from business: +$15,665 (reported on 13.5% of returns)
Here:
+$15,665
State:
+$20,662
(% of AGI for various income ranges: 7.6% for AGIs below $25k, 3.3% for AGIs $25k-50k, 3.5% for AGIs $50k-75k, 2.7% for AGIs $75k-100k, 2.5% for AGIs $100k-200k, 4.7% for AGIs over 200k)
Taxable individual retirement arrangement distribution: $12,692 (reported on 8.7% of returns)
01835:
$12,692
Massachusetts:
$18,892
(% of AGI for various income ranges: 2.4% for AGIs below $25k, 2.0% for AGIs $25k-50k, 2.0% for AGIs $50k-75k, 2.3% for AGIs $75k-100k, 2.1% for AGIs $100k-200k)
Self-employment retirement plans: $15,175 (reported on 0.6% of returns)
01835:
$15,175
Massachusetts:
$20,669
Total itemized deductions: $20,323 (20% of AGI, reported on 40.5% of returns)
Here:
$20,323
State:
$28,907
Here:
19.8% of AGI
State:
18.2% of AGI
(% of AGI for various income ranges: 9.4% for AGIs below $25k, 9.4% for AGIs $25k-50k, 13.8% for AGIs $50k-75k, 15.5% for AGIs $75k-100k, 15.8% for AGIs $100k-200k, 11.5% for AGIs over 200k)
Charity contributions: $1,717 (reported on 32.7% of returns)
Here:
$1,717
State:
$4,208
(% of AGI for various income ranges: 0.4% for AGIs below $25k, 0.7% for AGIs $25k-50k, 0.8% for AGIs $50k-75k, 1.1% for AGIs $75k-100k, 1.0% for AGIs $100k-200k, 1.0% for AGIs over 200k)
Taxes paid: $8,882 (reported on 40.4% of returns)
01835:
$8,882
State:
$13,303
(% of AGI for various income ranges: 2.5% for AGIs below $25k, 3.0% for AGIs $25k-50k, 5.3% for AGIs $50k-75k, 6.5% for AGIs $75k-100k, 7.3% for AGIs $100k-200k, 6.9% for AGIs over 200k)
Earned income credit: $1,916 (reported on 11.6% of returns)
Here:
$1,916
State:
$1,971
(% of AGI for various income ranges: 4.4% for AGIs below $25k, 0.6% for AGIs $25k-50k)
Percentage of individuals using paid preparers for their 2012 taxes: 53.4%
Here:
53%
State:
56%
(% for various income ranges: 48.2% for AGIs below $25k, 52.7% for AGIs $25k-50k, 55.4% for AGIs $50k-75k, 51.8% for AGIs $75k-100k, 61.3% for AGIs $100k-200k, 73.7% for AGIs over 200k)
Averages for the 2004 tax year for zip code 01835, filed in 2005:
Average Adjusted Gross Income (AGI) in 2004: $51,628 (Individual Income Tax Returns)
Here:
$51,628
State:
$62,877
Salary/wage: $48,514 (reported on 87.4% of returns)
Here:
$48,514
State:
$52,969
(% of AGI for various income ranges: 104.0% for AGIs below $10k, 73.8% for AGIs $10k-25k, 82.8% for AGIs $25k-50k, 86.5% for AGIs $50k-75k, 88.3% for AGIs $75k-100k, 76.5% for AGIs over 100k)
Taxable interest for individuals: $1,347 (reported on 55.5% of returns)
This zip code:
$1,347
Massachusetts:
$1,945
(% of AGI for various income ranges: 2.9% for AGIs below $10k, 2.5% for AGIs $10k-25k, 1.2% for AGIs $25k-50k, 0.9% for AGIs $50k-75k, 0.6% for AGIs $75k-100k, 2.1% for AGIs over 100k)
Taxable dividends: $1,607 (reported on 24.7% of returns)
Here:
$1,607
State:
$5,323
(% of AGI for various income ranges: 2.0% for AGIs below $10k, 1.3% for AGIs $10k-25k, 0.7% for AGIs $25k-50k, 0.6% for AGIs $50k-75k, 0.4% for AGIs $75k-100k, 1.0% for AGIs over 100k)
Net capital gain/loss: +$3,752 (reported on 19.7% of returns)
Here:
+$3,752
State:
+$20,377
(% of AGI for various income ranges: -2.1% for AGIs below $10k, 0.3% for AGIs $10k-25k, 0.2% for AGIs $25k-50k, 0.5% for AGIs $50k-75k, 1.1% for AGIs $75k-100k, 3.1% for AGIs over 100k)
Profit/loss from business: +$16,875 (reported on 13.3% of returns)
Here:
+$16,875
State:
+$17,837
(% of AGI for various income ranges: 4.5% for AGIs below $10k, 4.3% for AGIs $10k-25k, 3.7% for AGIs $25k-50k, 3.1% for AGIs $50k-75k, 2.6% for AGIs $75k-100k, 6.4% for AGIs over 100k)
IRA payment deduction: $2,951 (reported on 2.7% of returns)
01835:
$2,951
Massachusetts:
$3,100
(% of AGI for various income ranges: 0.3% for AGIs $10k-25k, 0.2% for AGIs $25k-50k, 0.1% for AGIs $50k-75k, 0.2% for AGIs $75k-100k, 0.1% for AGIs over 100k)
Self-employed pension: $11,556 (reported on 0.8% of returns)
Here:
$11,556
Massachusetts:
$14,516
Total itemized deductions: $18,688 (23% of AGI, reported on 44.7% of returns)
Here:
$18,688
State:
$22,573
Here:
22.8% of AGI
State:
19.5% of AGI
(% of AGI for various income ranges: 16.0% for AGIs below $10k, 11.6% for AGIs $10k-25k, 15.5% for AGIs $25k-50k, 17.2% for AGIs $50k-75k, 18.6% for AGIs $75k-100k, 15.5% for AGIs over 100k)
Charity contributions deductions: $1,892 (2% of AGI, reported on 40.0% of returns)
Here:
$1,892
State:
$3,295
Here:
2.2% of AGI
State:
2.7% of AGI
(% of AGI for various income ranges: 0.5% for AGIs below $10k, 0.6% for AGIs $10k-25k, 1.0% for AGIs $25k-50k, 1.3% for AGIs $50k-75k, 1.4% for AGIs $75k-100k, 2.0% for AGIs over 100k)
Total tax: $7,255 (reported on 82.8% of returns)
01835:
$7,255
State:
$11,494
(% of AGI for various income ranges: 2.8% for AGIs below $10k, 4.7% for AGIs $10k-25k, 8.1% for AGIs $25k-50k, 9.4% for AGIs $50k-75k, 10.1% for AGIs $75k-100k, 17.1% for AGIs over 100k)
Earned income credit: $1,419 (reported on 7.9% of returns)
Here:
$1,419
State:
$1,518
Percentage of individuals using paid preparers for their 2004 taxes: 54.6%
Here:
55%
State:
58%
(% for various income ranges: 42.5% for AGIs below $10k, 53.8% for AGIs $10k-25k, 54.6% for AGIs $25k-50k, 57.5% for AGIs $50k-75k, 56.6% for AGIs $75k-100k, 66.7% for AGIs over 100k)
Likely homosexual households (counted as self-reported same-sex unmarried-partner households)
Lesbian couples: 0.1% of all households
Gay men: 0.1% of all households
Household received Food Stamps/SNAP in the past 12 months: 539 Household did not receive Food Stamps/SNAP in the past 12 months: 4,957
Women who had a birth in the past 12 months: 231 (138 now married, 86 unmarried) Women who did not have a birth in the past 12 months: 3,387 (1,325 now married, 2,057 unmarried)
Housing units in zip code 01835 with a mortgage: 3,015 (176 second mortgage, 169 both second mortgage and home equity loan) Houses without a mortgage: 81
Median monthly owner costs for units with a mortgage: $2,200 Median monthly owner costs for units without a mortgage: $953
Residents with income below the poverty level in 2022:
This zip code:
3.8%
Whole state:
10.4%
Residents with income below 50% of the poverty level in 2022:
This zip code:
1.0%
Whole state:
5.1%
Median number of rooms in houses and condos:
Here:
6.6
State:
6.5
Median number of rooms in apartments:
Here:
4.3
State:
4.0
Notable locations in this zip code not listed on our city pages
Notable locations in zip code 01835: Bradford Ski Area (A), Bradford Country Club (B), Haverhill Fire Department Station 4 (C). Display/hide their locations on the map
In group quarters: 123 (-1 institutionalized population)
Size of family households: 1,343 2-persons, 998 3-persons, 862 4-persons, 330 5-persons, 80 6-persons, 95 7-or-more-persons
Size of nonfamily households: 1,246 1-person, 573 2-persons, 20 4-persons
1,811 married couples with children.
904 single-parent households (405 men, 499 women).
84.1% of residents of 01835 zip code speak English at home.
9.7% of residents speak Spanish at home (71% very well, 14% well, 14% not well, 2% not at all).
4.3% of residents speak other Indo-European language at home (69% very well, 31% well).
0.6% of residents speak Asian or Pacific Island language at home (66% very well, 34% well).
0.5% of residents speak other language at home (88% very well, 12% well).
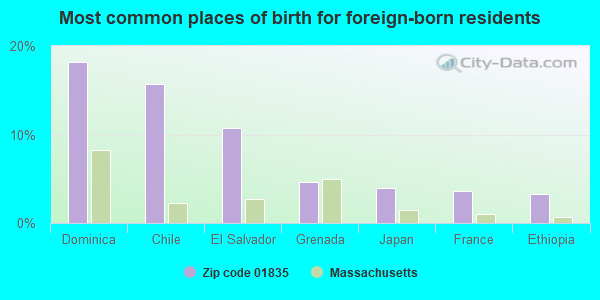
Foreign born population: 1,247 (8.5%) (67.7% of them are naturalized citizens)
Major facilities with environmental interests located in this zip code:
MERRIMACK VALLEY REGIONAL TRANSIT AUTHORITY (85 RAILROAD AVE in HAVERHILL, MA)
AIR MINOR (AIRS/AFS) (Integrated Compliance Information System) - ICIS-01-1996-0102, FORMAL ENFORCEMENT ACTION National Pollutant Discharge Elimination System NON-MAJOR (Tracking pollutant discharge elimination systems) - permit (Resource Conservation and Recovery Act (tracking hazardous waste)) Business SIC classification: NONCLASSIFIABLE ESTABLISHMENTS Alternative names: MERRIMACK VAL REG TRANS AUTH, MERRIMACK VALLEY AREA TRANS CO
AMTRAK (RAILROAD in BRADFORD, MA)
ENFORCEMENT/COMPLIANCE ACTIVITY (Integrated Compliance Information System) - ICIS-01-1999-0103, FORMAL ENFORCEMENT ACTION (Integrated Compliance Information System) - ICIS-01-1999-0103, FORMAL ENFORCEMENT ACTION
CIRCUIT BOARD EXPRESS (2 AVCO RD. in HAVERHILL, MA)
AIR MINOR (AIRS/AFS) COMPLIANCE ACTIVITY (Tracking inspections of insecticide, fungicide, and rodenticide, and toxic substances) CRITERIA AND HAZARDOUS AIR POLLUTANT INVENTORY (Inventory of air pollution sources) HAZARDOUS WASTE BIENNIAL REPORTER (Resource Conservation and Recovery Act (tracking hazardous waste)) Small Quantity Generators, between 100 kg and 1000 kg of hazardous waste/month (Resource Conservation and Recovery Act (tracking hazardous waste)) TRI REPORTER (Tracking of toxic chemicals releasing facilities) Business SIC classification: PRINTED CIRCUIT BOARDS; ELECTRONIC COMPONENTS Business NAICS classification: BARE PRINTED CIRCUIT BOARD MANUFACTURING. Organizations: CIRCUIT BOARD EXPRESS INC (CONTACT/OWNER)
JOHNSON MATTHEY CATALOG CO INC (30 BOND STREET in HAVERHILL, MA)
AIR MINOR (AIRS/AFS) HAZARDOUS WASTE BIENNIAL REPORTER (Resource Conservation and Recovery Act (tracking hazardous waste)) Large Quantity Generators, more that 1000 kg of hazardous waste/month (Resource Conservation and Recovery Act (tracking hazardous waste)) - notification Business SIC classification: NONCLASSIFIABLE ESTABLISHMENTS Organizations: JOHNSON MATTHEY NA (CONTACT/OPERATOR)
Alternative names: MATTHEY JOHNSON COMPANY
BRADFORD ELEMENTARY (118 MONTVALE STREET in BRADFORD, MA)
(National Center for Education Statistics) - STATE ID-128008 Organizations: HAVERHILL (SCHOOL DISTRICT)
CALEB DUSTIN HUNKING (98 WINCHESTER STREET in HAVERHILL, MA)
(National Center for Education Statistics) - STATE ID-128035 Organizations: HAVERHILL (SCHOOL DISTRICT)
COGSWELL (351 SOUTH MAIN ST. in HAVERHILL, MA)
(National Center for Education Statistics) - STATE ID-128015 Organizations: HAVERHILL (SCHOOL DISTRICT)
KNIPE (97 OXFORD AVENUE in HAVERHILL, MA)
(National Center for Education Statistics) - STATE ID-128040 Organizations: HAVERHILL (SCHOOL DISTRICT)
PARKER HANNIFIN CORPORATION (260 NECK RD in HAVERHILL, MA)
(Resource Conservation and Recovery Act (tracking hazardous waste)) Organizations: WHATMAN INC (CONTACT/OWNER)
Alternative names: WHATMAN INC
BILL DELUCCA CHEVROLET PONTIAC INC (76 SOUTH MAIN ST in HAVERHILL, MA)
(Resource Conservation and Recovery Act (tracking hazardous waste)) Business NAICS classification: ALL OTHER AUTOMOTIVE REPAIR AND MAINTENANCE. Organizations: WILLIAM P DELUCA III (CONTACT/OWNER)
Alternative names: DELUCA BILL CHEVROLET PONTIAC INC
BRADFORD TRANSMISSIONS INCORPORATED (154 SOUTH MAIN STREET in BRADFORD, MA)
(Resource Conservation and Recovery Act (tracking hazardous waste)) Organizations: LOUIS A OLIVER (CONTACT/OWNER)
BROOKS PHARMACY (3 FERRY ST in HAVERHILL, MA)
(Resource Conservation and Recovery Act (tracking hazardous waste)) Organizations: MAXI DRUG INC (CONTACT/OWNER)
Alternative names: OSCO 5409
NEW ENGLAND COATING SERVICE INC (26 WARD HILL AVE in HAVERHILL, MA)
(Resource Conservation and Recovery Act (tracking hazardous waste)) Business NAICS classification: OTHER ELECTRONIC COMPONENT MANUFACTURING.
Housing units lacking complete plumbing facilities: 0.4% Housing units lacking complete kitchen facilities: 1.1%
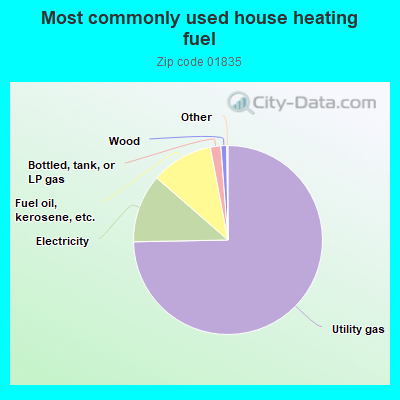
74.7%Utility gas
11.7%Electricity
10.6%Fuel oil, kerosene, etc.
1.8%Bottled, tank, or LP gas
1.0%Wood
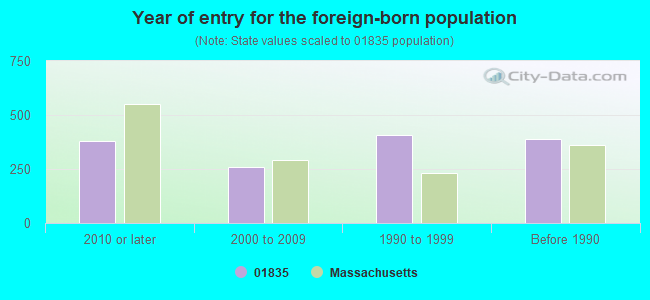
Population in 1990: 12,078. Population change in the 1990s: +1,338 (+11.1%).
Place of birth for U.S.-born residents:
This state: 10,624
Northeast: 1,579
Midwest: 156
South: 600
West: 180
56% of the 01835 zip code residents lived in the same house 5 years ago. Out of people who lived in different houses, 67% lived in this county. Out of people who lived in different counties, 50% lived in Massachusetts.
89% of the 01835 zip code residents lived in the same house 1 year ago. Out of people who lived in different houses, 63% moved from this county. Out of people who lived in different houses, 31% moved from different county within same state. Out of people who lived in different houses, 1% moved from abroad.
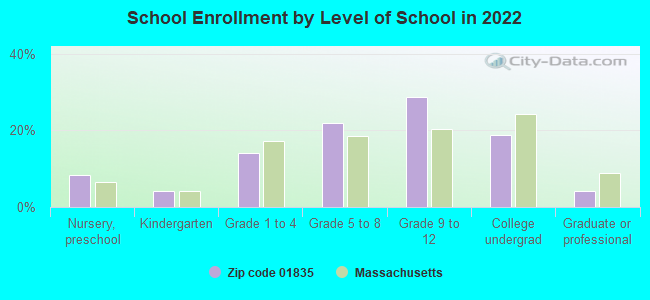
Private vs. public school enrollment:
Students in private schools in grades 1 to 8 (elementary and middle school): 273
Here:
23.2%
Massachusetts:
10.3%
Students in private schools in grades 9 to 12 (high school): 164
Here:
17.1%
Massachusetts:
12.3%
Students in private undergraduate colleges: 334
Here:
53.4%
Massachusetts:
51.2%
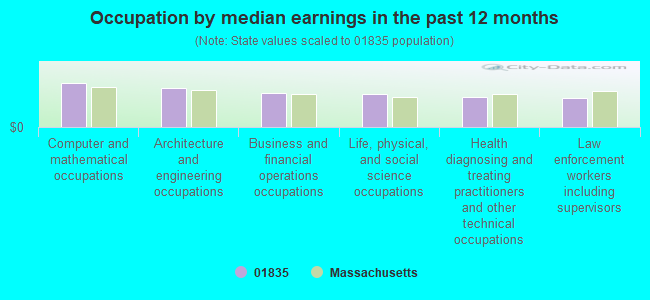
Occupation by median earnings in the past 12 months ($)
125,865Computer and mathematical occupations
112,323Architecture and engineering occupations
97,341Business and financial operations occupations
93,762Life, physical, and social science occupations
86,561Health diagnosing and treating practitioners and other technical occupations
84,383Law enforcement workers including supervisors
Companies with biggest federal contracts located in this zip code:
EASTERN CANVAS PRODUCTS INC (50 ROGERS ROAD in WARD HILL, MA; small business) : $13,958,072 in 45 contractsfrom 2000 to 2004
Contracts for Safety and Rescue Equipment, Marine Lifesaving and Diving Equipment by Army, Defense Logistics Agency, Navy Signed by year:2000: $1,311,653; 2001: $2,998,908; 2002: $4,081,001; 2003: $3,954,880; 2004: $1,611,630; 2005: $0; 2006: $0.
Biggest contracts:
$1,434,180 with Army for Safety and Rescue Equipment. Signed on 2002-09-30. Completion date: 2004-12-31.
$1,208,653, same as above.Signed on 2002-09-06. Completion date: 2004-12-31.
$1,082,400, same as above.Signed on 2004-02-04. Completion date: 2004-12-31.
$1,082,400, same as above.Signed on 2003-10-14. Completion date: 2004-12-31.
PEPSI-COLA BOTTLERS FOR THE ME (261 NECK RD in HAVERHILL, MA) : $393,647 in 8 contractsfrom 2004 to 2006
Contracts for Food Items For Resale by Defense Commissary Agency Signed by year:2000: $0; 2001: $0; 2002: $0; 2003: $0; 2004: $109,729; 2005: $180,234; 2006: $103,684.
Biggest contracts:
$103,684 with Defense Commissary Agency for Food Items For Resale. Signed on 2006-01-01. Completion date: 2006-03-31.
$91,108, same as above.Signed on 2005-04-01. Completion date: 2005-08-31.
$77,689, same as above.Signed on 2004-10-01. Completion date: 2005-02-28.
$32,040, same as above.Signed on 2004-07-01. Completion date: 2004-07-31.
QUINTANA ASSOCIATES, INC (41 ROGERS RD in HAVERHILL, MA; small business)
$100,000 with Defense Logistics Agency for Oils and Greases: Cutting, Lubricating, and Hydraulic. Signed on 2005-05-12. Completion date: 2010-05-11.
R W HATFIELD CO INC (10 AVCO ROAD in HAVERHILL, MA) : $63,991 in 7 contractsfrom 2002 to 2006
Contracts for Miscellaneous Furniture and Fixtures, Hazardous Substance Removal, Cleanup, and Disposal Services and Operational Support, Office Furniture, Aircraft Maintenance and Repair Shop Specialized Equipment by Navy, Defense Logistics Agency, Air Force Signed by year:2000: $0; 2001: $0; 2002: $32,143; 2003: $0; 2004: $0; 2005: $22,805; 2006: $9,043.
Biggest contracts:
$32,143 with Navy for Miscellaneous Furniture and Fixtures. Signed on 2002-04-01. Completion date: 2002-05-06.
$7,458 with Defense Logistics Agency for Hazardous Substance Removal, Cleanup, and Disposal Services and Operational Support. Signed on 2005-11-23. Completion date: 2005-12-21.
$6,839 with Navy for Miscellaneous Furniture and Fixtures. Signed on 2005-12-23. Completion date: 2006-01-13.
$6,036 with Navy for Office Furniture. Signed on 2006-01-05. Completion date: 2006-02-18.
TANK LINE SERVICES INC (10 AVCO ROAD in HAVERHILL, MA; small business) : $38,300 in 2 contractsin 2003
$27,500 with Army for Maintenance, Repair and Rebuilding of Equipment -- Vehicular Equipment Components. Signed on 2003-01-22. Completion date: 2003-02-01.
$10,800, same as above.Signed on 2003-01-16. Completion date: 2003-01-21.
STERICYCLE, INC (139 FERRY RD in HAVERHILL, MA) : $15,000 in 2 contractsfrom 2004 to 2005
$10,200 with Navy for Trash/Garbage Collection Services - Including Portable Sanitation Services. Taking place in ME. Signed on 2005-05-31. Completion date: 2005-09-30.
$4,800 with Air Force for Trash/Garbage Collection Services - Including Portable Sanitation Services. Signed on 2004-10-15. Completion date: 2005-10-14.
ADOM ENGINEERING INC (131 AVCO RD in HAVERHILL, MA; small business) 1000 employees, $0 revenue.
$14,476 with Defense Logistics Agency for Gas Turbines and Jet Engines, Aircraft; Prime Moving, and Components. Signed on 2006-06-12. Completion date: 2007-03-22.
ATKINSON CARPET INSTALLATION C (11 ROGERS ROAD in HAVERHILL, MA; small business) : $13,486 in 7 contractsin 2004
Contracts for Floor Coverings, Carpet Laying and Cleaning by U.S. Army Corps of Engineers - civil program financing only, Army Signed by year:2000: $0; 2001: $0; 2002: $0; 2003: $0; 2004: $13,486; 2005: $0; 2006: $0.
Biggest contracts:
$3,165 with U.S. Army Corps of Engineers - civil program financing only for Floor Coverings. Signed on 2004-01-16. Completion date: 2004-01-30.
$3,165 with Army for Floor Coverings. Signed on 2004-01-16. Completion date: 2004-01-30.
$2,476 with Army for Floor Coverings. Taking place in NH. Signed on 2004-08-26. Completion date: 2004-09-30.
$1,507 with Army for Floor Coverings. Signed on 2004-03-12. Completion date: 2004-03-26.
DYNAWAVE INCORPORATED (135 WARD HILL AVE in HAVERHILL, MA; small business) : $10,434 in 2 contractsin 2005
$5,217 with Defense Logistics Agency for Connectors, Electrical. Signed on 2005-02-09. Completion date: 2005-04-22.
$5,217, same as above.Signed on 2005-02-09. Completion date: 2005-04-22.
MARTINDALE ASSOCIATES INC (65 AVCO ROAD UNIT M in HAVERHILL, MA; small business)
$7,040 with Uniformed Services University of the Health Sciences for Mini and Micro Computer Control Devices. Signed on 2006-04-11. Completion date: 2006-04-30.
Top industries in this zip code by the number of employees in 2005:


 Nearest zip codes: 01832, 01830, 01845, 01834, 01840, 01841.