Estimated zip code population in 2022: 31,332 Zip code population in 2010: 28,602 Zip code population in 2000: 28,587
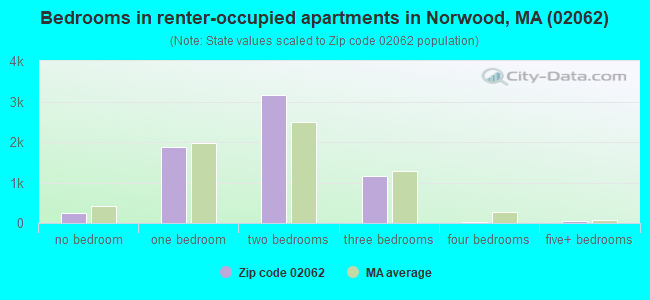
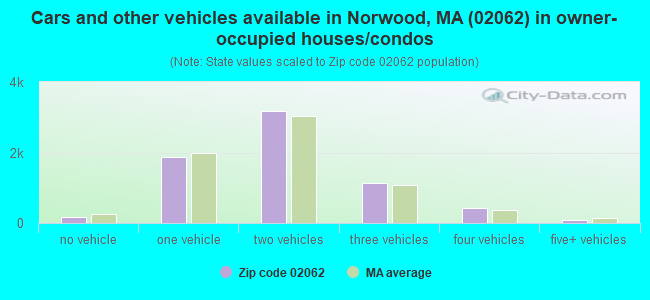
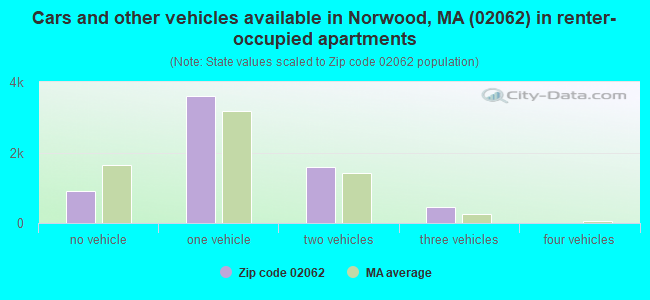
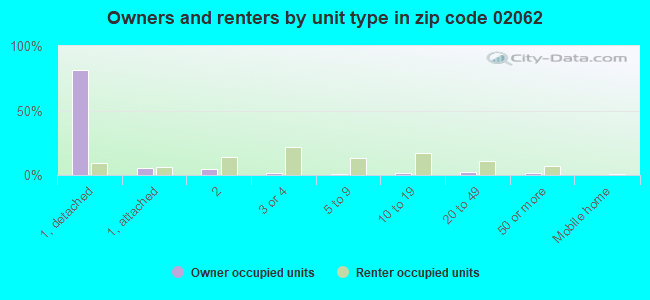
Houses and condos: 13,934 Renter-occupied apartments: 6,533
% of renters here:
49%
State:
38%
March 2022 cost of living index in zip code 02062: 136.3 (high, U.S. average is 100)
Land area: 10.4 sq. mi. Water area: 0.2 sq. mi.
Population density: 3,025 people per square mile
(average).
OSM Map
Google Map
MSN Map
OSM Map
General Map
Google Map
MSN Map
OSM Map
Google Map
MSN Map
OSM Map
Google Map
MSN Map
Please wait while loading the map...
Real estate property taxes paid for housing units in 2022:
This zip code:
0.9% ($5,569)
Massachusetts:
1.0% ($5,536)
Median real estate property taxes paid for housing units with mortgages in 2022: $5,590 (0.8%) Median real estate property taxes paid for housing units with no mortgage in 2022: $5,533 (0.9%)
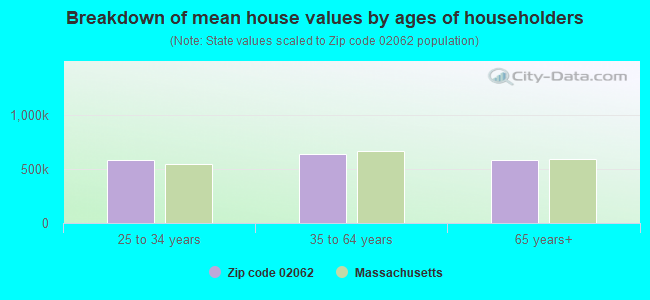
Estimated median house/condo value in 2022: $649,839
02062:
$649,839
Massachusetts:
$534,700
According to our research of Massachusetts and other state lists, there were 4 registered sex offenders living in 02062 zip code as of April 27, 2024. The ratio of all residents to sex offenders in zip code 02062 is 7,359 to 1. The ratio of registered sex offenders to all residents in this zip code is much lower than the state average.
Median resident age:
This zip code:
39.5 years
Massachusetts median age:
40.3 years
Average household size:
This zip code:
2.3 people
Massachusetts:
2.4 people
Averages for the 2020 tax year for zip code 02062, filed in 2021:
Average Adjusted Gross Income (AGI) in 2020: $94,451 (Individual Income Tax Returns)
Here:
$94,451
State:
$105,130
Salary/wage: $78,219 (reported on 82.1% of returns)
Here:
$78,219
State:
$82,951
(% of AGI for various income ranges: 1121.7% for AGIs below $25k, 3629.4% for AGIs $25k-50k, 6604.7% for AGIs $50k-75k, 10119.0% for AGIs $75k-100k, 19882.2% for AGIs $100k-200k, 74260.0% for AGIs over 200k)
Taxable interest for individuals: $1,548 (reported on 41.5% of returns)
This zip code:
$1,548
Massachusetts:
$2,361
(% of AGI for various income ranges: 28.3% for AGIs below $25k, 37.4% for AGIs $25k-50k, 56.4% for AGIs $50k-75k, 85.0% for AGIs $75k-100k, 148.8% for AGIs $100k-200k, 929.3% for AGIs over 200k)
Ordinary dividends: $4,253 (reported on 25.0% of returns)
Here:
$4,253
State:
$10,365
(% of AGI for various income ranges: 30.1% for AGIs below $25k, 47.0% for AGIs $25k-50k, 83.3% for AGIs $50k-75k, 153.9% for AGIs $75k-100k, 258.8% for AGIs $100k-200k, 1671.3% for AGIs over 200k)
Net capital gain/loss in AGI: +$23,129 (reported on 21.6% of returns)
Here:
+$23,129
State:
+$48,178
(% of AGI for various income ranges: 13.2% for AGIs below $25k, 44.2% for AGIs $25k-50k, 84.4% for AGIs $50k-75k, 195.0% for AGIs $75k-100k, 432.5% for AGIs $100k-200k, 15387.8% for AGIs over 200k)
Profit/loss from business: +$13,805 (reported on 13.9% of returns)
Here:
+$13,805
State:
+$20,792
(% of AGI for various income ranges: 115.3% for AGIs below $25k, 162.6% for AGIs $25k-50k, 206.7% for AGIs $50k-75k, 252.6% for AGIs $75k-100k, 404.1% for AGIs $100k-200k, 2385.8% for AGIs over 200k)
Taxable individual retirement arrangement distribution: $18,802 (reported on 10.2% of returns)
02062:
$18,802
Massachusetts:
$22,790
(% of AGI for various income ranges: 69.9% for AGIs below $25k, 122.9% for AGIs $25k-50k, 240.3% for AGIs $50k-75k, 380.7% for AGIs $75k-100k, 619.4% for AGIs $100k-200k, 1439.1% for AGIs over 200k)
Self-employed (Keogh) retirement plans: $18,011 (reported on 0.5% of returns)
02062:
$18,011
Massachusetts:
$26,868
(% of AGI for various income ranges: 14.4% for AGIs $50k-75k, 24.0% for AGIs $100k-200k, 204.0% for AGIs over 200k)
Total itemized deductions: $30,973 (reported on 12.9% of returns)
Here:
$30,973
State:
$36,722
(% of AGI for various income ranges: 114.2% for AGIs below $25k, 177.3% for AGIs $25k-50k, 369.2% for AGIs $50k-75k, 674.0% for AGIs $75k-100k, 1143.9% for AGIs $100k-200k, 5071.8% for AGIs over 200k)
Charity contributions: $5,958 (reported on 10.1% of returns)
Here:
$5,958
State:
$12,529
(% of AGI for various income ranges: 5.6% for AGIs below $25k, 16.0% for AGIs $25k-50k, 44.3% for AGIs $50k-75k, 57.7% for AGIs $75k-100k, 141.1% for AGIs $100k-200k, 1179.6% for AGIs over 200k)
Taxes paid: $8,554 (reported on 12.9% of returns)
02062:
$8,554
State:
$8,782
(% of AGI for various income ranges: 19.0% for AGIs below $25k, 44.0% for AGIs $25k-50k, 108.2% for AGIs $50k-75k, 227.4% for AGIs $75k-100k, 389.3% for AGIs $100k-200k, 1056.2% for AGIs over 200k)
Earned income credit: $1,710 (reported on 7.9% of returns)
Here:
$1,710
State:
$1,909
(% of AGI for various income ranges: 51.3% for AGIs below $25k, 40.0% for AGIs $25k-50k, 0.6% for AGIs $50k-75k)
Percentage of individuals using paid preparers for their 2020 taxes: 91.9%
Here:
92%
State:
92%
(% for various income ranges: 88.5% for AGIs below $25k, 92.7% for AGIs $25k-50k, 92.2% for AGIs $50k-75k, 92.0% for AGIs $75k-100k, 94.0% for AGIs $100k-200k, 94.7% for AGIs over 200k)
Averages for the 2012 tax year for zip code 02062, filed in 2013:
Average Adjusted Gross Income (AGI) in 2012: $73,951 (Individual Income Tax Returns)
Here:
$73,951
State:
$81,425
Salary/wage: $61,739 (reported on 83.6% of returns)
Here:
$61,739
State:
$64,752
(% of AGI for various income ranges: 67.5% for AGIs below $25k, 79.3% for AGIs $25k-50k, 76.5% for AGIs $50k-75k, 79.8% for AGIs $75k-100k, 84.0% for AGIs $100k-200k, 43.0% for AGIs over 200k)
Taxable interest for individuals: $1,102 (reported on 46.0% of returns)
This zip code:
$1,102
Massachusetts:
$2,136
(% of AGI for various income ranges: 1.8% for AGIs below $25k, 0.7% for AGIs $25k-50k, 0.6% for AGIs $50k-75k, 0.7% for AGIs $75k-100k, 0.5% for AGIs $100k-200k, 0.7% for AGIs over 200k)
Ordinary dividends: $3,884 (reported on 24.1% of returns)
Here:
$3,884
State:
$9,473
(% of AGI for various income ranges: 2.0% for AGIs below $25k, 0.8% for AGIs $25k-50k, 1.0% for AGIs $50k-75k, 1.0% for AGIs $75k-100k, 1.0% for AGIs $100k-200k, 1.9% for AGIs over 200k)
Net capital gain/loss in AGI: +$15,813 (reported on 17.1% of returns)
Here:
+$15,813
State:
+$31,437
(% of AGI for various income ranges: 0.1% for AGIs $25k-50k, 0.2% for AGIs $50k-75k, 0.3% for AGIs $75k-100k, 0.7% for AGIs $100k-200k, 12.2% for AGIs over 200k)
Profit/loss from business: +$14,390 (reported on 12.1% of returns)
Here:
+$14,390
State:
+$20,662
(% of AGI for various income ranges: 8.1% for AGIs below $25k, 3.6% for AGIs $25k-50k, 2.1% for AGIs $50k-75k, 2.0% for AGIs $75k-100k, 2.0% for AGIs $100k-200k, 1.5% for AGIs over 200k)
Taxable individual retirement arrangement distribution: $14,048 (reported on 12.3% of returns)
02062:
$14,048
Massachusetts:
$18,892
(% of AGI for various income ranges: 5.0% for AGIs below $25k, 2.9% for AGIs $25k-50k, 3.3% for AGIs $50k-75k, 3.2% for AGIs $75k-100k, 2.1% for AGIs $100k-200k, 1.0% for AGIs over 200k)
Self-employment retirement plans: $11,989 (reported on 0.6% of returns)
02062:
$11,989
Massachusetts:
$20,669
(% of AGI for various income ranges: 0.2% for AGIs $25k-50k, 0.2% for AGIs over 200k)
Total itemized deductions: $23,895 (18% of AGI, reported on 37.3% of returns)
Here:
$23,895
State:
$28,907
Here:
17.5% of AGI
State:
18.2% of AGI
(% of AGI for various income ranges: 13.9% for AGIs below $25k, 8.6% for AGIs $25k-50k, 11.3% for AGIs $50k-75k, 13.4% for AGIs $75k-100k, 15.2% for AGIs $100k-200k, 9.5% for AGIs over 200k)
Charity contributions: $2,360 (reported on 31.8% of returns)
Here:
$2,360
State:
$4,208
(% of AGI for various income ranges: 0.8% for AGIs below $25k, 0.8% for AGIs $25k-50k, 0.9% for AGIs $50k-75k, 1.0% for AGIs $75k-100k, 1.2% for AGIs $100k-200k, 0.9% for AGIs over 200k)
Taxes paid: $10,564 (reported on 37.1% of returns)
02062:
$10,564
State:
$13,303
(% of AGI for various income ranges: 3.2% for AGIs below $25k, 2.5% for AGIs $25k-50k, 4.0% for AGIs $50k-75k, 5.2% for AGIs $75k-100k, 6.8% for AGIs $100k-200k, 5.9% for AGIs over 200k)
Earned income credit: $1,735 (reported on 8.8% of returns)
Here:
$1,735
State:
$1,971
(% of AGI for various income ranges: 3.2% for AGIs below $25k, 0.5% for AGIs $25k-50k)
Percentage of individuals using paid preparers for their 2012 taxes: 55.9%
Here:
56%
State:
56%
(% for various income ranges: 52.6% for AGIs below $25k, 53.5% for AGIs $25k-50k, 57.6% for AGIs $50k-75k, 57.3% for AGIs $75k-100k, 60.4% for AGIs $100k-200k, 66.7% for AGIs over 200k)
Averages for the 2004 tax year for zip code 02062, filed in 2005:
Average Adjusted Gross Income (AGI) in 2004: $54,718 (Individual Income Tax Returns)
Here:
$54,718
State:
$62,877
Salary/wage: $50,998 (reported on 83.4% of returns)
Here:
$50,998
State:
$52,969
(% of AGI for various income ranges: 85.2% for AGIs below $10k, 65.0% for AGIs $10k-25k, 79.6% for AGIs $25k-50k, 79.5% for AGIs $50k-75k, 84.1% for AGIs $75k-100k, 74.9% for AGIs over 100k)
Taxable interest for individuals: $1,410 (reported on 62.0% of returns)
This zip code:
$1,410
Massachusetts:
$1,945
(% of AGI for various income ranges: 7.0% for AGIs below $10k, 3.8% for AGIs $10k-25k, 1.7% for AGIs $25k-50k, 1.6% for AGIs $50k-75k, 1.0% for AGIs $75k-100k, 1.3% for AGIs over 100k)
Taxable dividends: $2,306 (reported on 30.4% of returns)
Here:
$2,306
State:
$5,323
(% of AGI for various income ranges: 3.5% for AGIs below $10k, 1.8% for AGIs $10k-25k, 0.9% for AGIs $25k-50k, 1.1% for AGIs $50k-75k, 0.8% for AGIs $75k-100k, 1.6% for AGIs over 100k)
Net capital gain/loss: +$5,949 (reported on 23.3% of returns)
Here:
+$5,949
State:
+$20,377
(% of AGI for various income ranges: -2.5% for AGIs below $10k, 0.1% for AGIs $10k-25k, 0.1% for AGIs $25k-50k, 0.5% for AGIs $50k-75k, 0.8% for AGIs $75k-100k, 5.7% for AGIs over 100k)
Profit/loss from business: +$14,659 (reported on 11.8% of returns)
Here:
+$14,659
State:
+$17,837
(% of AGI for various income ranges: 8.4% for AGIs below $10k, 6.5% for AGIs $10k-25k, 4.0% for AGIs $25k-50k, 2.8% for AGIs $50k-75k, 2.2% for AGIs $75k-100k, 2.7% for AGIs over 100k)
IRA payment deduction: $3,130 (reported on 3.2% of returns)
02062:
$3,130
Massachusetts:
$3,100
(% of AGI for various income ranges: 0.3% for AGIs below $10k, 0.3% for AGIs $10k-25k, 0.3% for AGIs $25k-50k, 0.2% for AGIs $50k-75k, 0.2% for AGIs $75k-100k, 0.1% for AGIs over 100k)
Self-employed pension: $9,134 (reported on 1.0% of returns)
Here:
$9,134
Massachusetts:
$14,516
(% of AGI for various income ranges: 0.1% for AGIs $25k-50k, 0.1% for AGIs $50k-75k, 0.1% for AGIs $75k-100k, 0.3% for AGIs over 100k)
Total itemized deductions: $20,286 (22% of AGI, reported on 38.9% of returns)
Here:
$20,286
State:
$22,573
Here:
22.0% of AGI
State:
19.5% of AGI
(% of AGI for various income ranges: 16.6% for AGIs below $10k, 13.3% for AGIs $10k-25k, 10.4% for AGIs $25k-50k, 18.9% for AGIs $50k-75k, 15.6% for AGIs $75k-100k, 13.7% for AGIs over 100k)
Charity contributions deductions: $2,313 (2% of AGI, reported on 35.9% of returns)
Here:
$2,313
State:
$3,295
Here:
2.4% of AGI
State:
2.7% of AGI
(% of AGI for various income ranges: 0.7% for AGIs below $10k, 1.1% for AGIs $10k-25k, 1.0% for AGIs $25k-50k, 1.3% for AGIs $50k-75k, 1.6% for AGIs $75k-100k, 1.8% for AGIs over 100k)
Total tax: $8,459 (reported on 82.6% of returns)
02062:
$8,459
State:
$11,494
(% of AGI for various income ranges: 2.6% for AGIs below $10k, 4.9% for AGIs $10k-25k, 8.9% for AGIs $25k-50k, 10.3% for AGIs $50k-75k, 10.6% for AGIs $75k-100k, 17.8% for AGIs over 100k)
Earned income credit: $1,330 (reported on 6.6% of returns)
Here:
$1,330
State:
$1,518
Percentage of individuals using paid preparers for their 2004 taxes: 55.5%
Here:
55%
State:
58%
(% for various income ranges: 45.9% for AGIs below $10k, 56.4% for AGIs $10k-25k, 55.0% for AGIs $25k-50k, 58.3% for AGIs $50k-75k, 57.6% for AGIs $75k-100k, 62.1% for AGIs over 100k)
Likely homosexual households (counted as self-reported same-sex unmarried-partner households)
Lesbian couples: 0.1% of all households
Gay men: 0.0% of all households
Household received Food Stamps/SNAP in the past 12 months: 1,060 Household did not receive Food Stamps/SNAP in the past 12 months: 12,138
Women who had a birth in the past 12 months: 262 (276 now married, 0 unmarried) Women who did not have a birth in the past 12 months: 7,021 (3,120 now married, 3,865 unmarried)
Housing units in zip code 02062 with a mortgage: 4,240 (663 second mortgage, 17 home equity loan, 578 both second mortgage and home equity loan) Houses without a mortgage: 177
Median monthly owner costs for units with a mortgage: $2,518 Median monthly owner costs for units without a mortgage: $895
Residents with income below the poverty level in 2022:
This zip code:
7.8%
Whole state:
10.4%
Residents with income below 50% of the poverty level in 2022:
This zip code:
4.3%
Whole state:
5.1%
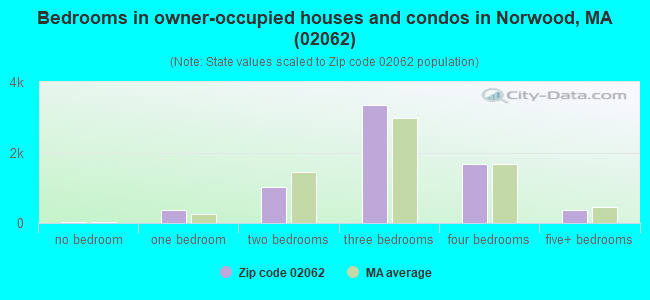
Median number of rooms in houses and condos:
Here:
6.7
State:
6.5
Median number of rooms in apartments:
Here:
4.0
State:
4.0
Notable locations in this zip code not listed on our city pages
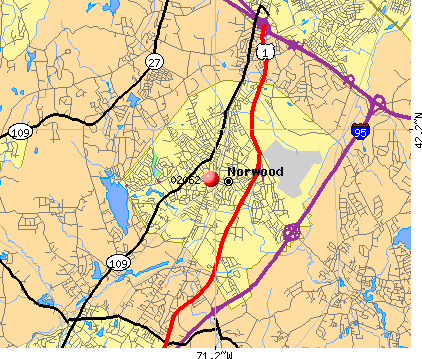
Notable locations in zip code 02062: Norwood Central Station (A), Norwood Depot Station (B), Windsor Gardens Station (C), Norwood Plaza (D), Norwood Industrial Park (E), Park Place Industrial Park (F), Morrill Memorial Library (G), Norwood Townhall (H), Norwood Fire Department Station 1 Headquarters (I), Balch School Library (J), Norwood High School Library (K), Youngdahl Memorial Library (L). Display/hide their locations on the map
Shopping Centers: Nahatan Street Shopping Center (1), Dean Street Shopping Center (2), Norwood Plaza Shopping Center (3). Display/hide their locations on the map
Churches in zip code 02062 include: United Church of Norwood (A), Trinity Community Church (B), Saint George Orthodox Church (C), Grace Episcopal Church (D), First Congregational Church (E), First Baptist Church (F), Emmanuel Lutheran Church (G). Display/hide their locations on the map
Streams, rivers, and creeks: Bubbling Brook (A), Germany Brook (B), Hawes Brook (C), Plantingfield Brook (D), Traphole Brook (E). Display/hide their locations on the map
Parks in zip code 02062 include: Shattuck Park (1), Summer Street Recreation Area (2), Legion Park (3), Eliot Park (4), Endean Playground (5), McAleer Playground (6), Ellis Gardens Playground (7), Wilson Street Playground (8), Pleasant Park (9). Display/hide their locations on the map
In group quarters: 446 (-1 institutionalized population)
Size of family households: 3,452 2-persons, 2,167 3-persons, 1,590 4-persons, 474 5-persons, 245 6-persons, 127 7-or-more-persons
Size of nonfamily households: 4,095 1-person, 1,123 2-persons, 121 3-persons
4,058 married couples with children.
1,670 single-parent households (652 men, 1,018 women).
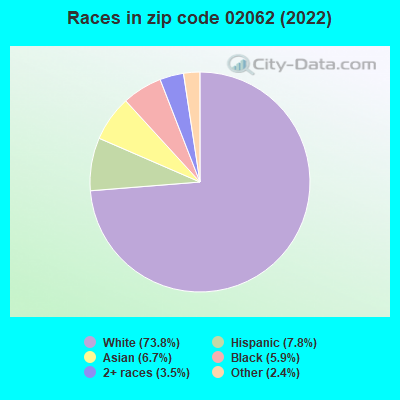
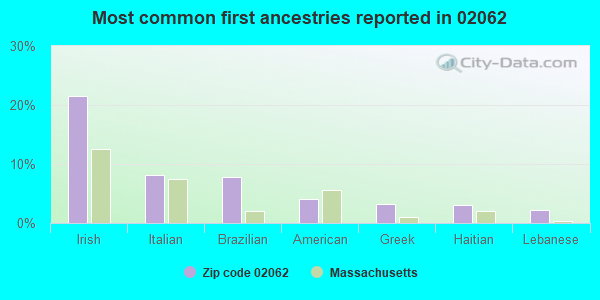
74.3% of residents of 02062 zip code speak English at home.
6.2% of residents speak Spanish at home (64% very well, 26% well, 8% not well, 2% not at all).
14.0% of residents speak other Indo-European language at home (44% very well, 28% well, 15% not well, 12% not at all).
4.1% of residents speak Asian or Pacific Island language at home (62% very well, 33% well, 1% not well, 4% not at all).
1.7% of residents speak other language at home (84% very well, 14% well, 2% not well).
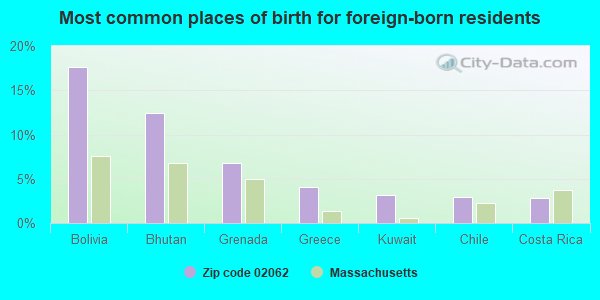
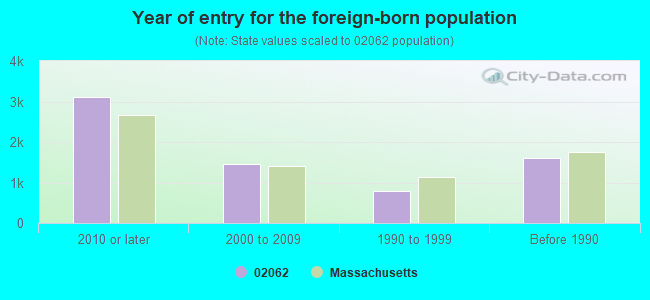
Foreign born population: 6,593 (21.0%) (45.9% of them are naturalized citizens)
Major facilities with environmental interests located in this zip code:
NORWOOD PCB SUPERFUND SITE (921 PROVIDENCE HIGHWAY in NORWOOD, MA)
AIR MINOR (AIRS/AFS) SUPERFUND NPL (Superfund database) (Integrated Compliance Information System) - ICIS-01-1997-0233, FORMAL ENFORCEMENT ACTION, ICIS-01-1990-0009, ICIS-01-1996-0064, ICIS-01-1997-0074, ICIS-01-1994-0021, (Resource Conservation and Recovery Act (tracking hazardous waste)) Business SIC classification: BOLTS, NUTS, SCREWS, RIVETS, AND WASHERS Organizations: US EPA (CONTACT/OWNER)
Alternative names: DEAN ST SITE, GRANT GEAR INC, GRANT GEAR INC., NORWOOD PCBS
BIRD INC ROOFING (1077 PLEASANT STREET in NORWOOD, MA)
AIR MINOR (AIRS/AFS) AIR SYNTHETIC MINOR (AIRS/AFS) COMPLIANCE ACTIVITY (Tracking inspections of insecticide, fungicide, and rodenticide, and toxic substances) CRITERIA AND HAZARDOUS AIR POLLUTANT INVENTORY (Inventory of air pollution sources) National Pollutant Discharge Elimination System NON-MAJOR (Tracking pollutant discharge elimination systems) - permit Conditionally Exempt Small Quantity Generators, less than 100 kg/month of hazardous waste (Resource Conservation and Recovery Act (tracking hazardous waste)) - notification TRI REPORTER (Tracking of toxic chemicals releasing facilities) Business SIC classification: ASPHALT FELTS AND COATINGS; MINERALS AND EARTHS, GROUND OR OTHERWISE TREATED Organizations: CERTAINTEED GRANULE PLANT (CONTACT/OPERATOR)
Alternative names: BIRD INC., GRANULE DIV., BIRD, INC. - ROOFING PLANT, BIRD ROOFING PLANT, CERTAINTEED CORP, CERTAINTEED GRANULE PLANT
ANALAB INCORPORATED (59 DAVIS AVE. in NORWOOD, MA)
(Integrated Compliance Information System) - ICIS-01-2005-4001, ENFORCEMENT/COMPLIANCE ACTIVITY FORMAL ENFORCEMENT ACTION (Integrated Compliance Information System) - ICIS-01-2005-4001, ENFORCEMENT/COMPLIANCE ACTIVITY COMPLIANCE ACTIVITY (Tracking inspections of insecticide, fungicide, and rodenticide, and toxic substances) TRI REPORTER (Tracking of toxic chemicals releasing facilities) Business SIC classification: SOAP AND OTHER DETERGENTS, EXCEPT SPECIALTY CLEANERS; SPECIALTY CLEANING, POLISHING, AND SANITATION PREPARATIONS
ZIMBLE DRUM SITE (61 ENDICOTT STREET in NORWOOD, MA)
AIR MINOR (AIRS/AFS) SUPERFUND (Superfund database) - ICIS-01-2005-0103, ENFORCEMENT/COMPLIANCE ACTIVITY Large Quantity Generators, more that 1000 kg of hazardous waste/month (Resource Conservation and Recovery Act (tracking hazardous waste)) Business SIC classification: PRIMARY METAL PRODUCTS Organizations: ZIMBLE REALTY TRUST-C/O D ANDELMAN ESQ (CONTACT/OWNER)
Alternative names: ZIMBLE CORPORATION
NORTHROP CORP ELECTRONICS SYSTEMS DIVISION (111 MORSE STREET in NORWOOD, MA)
AIR MINOR (AIRS/AFS) (Resource Conservation and Recovery Act (tracking hazardous waste)) TRI REPORTER (Tracking of toxic chemicals releasing facilities) Alternative names: NORTHROP CORPORATION PLT1, NORTHROP CORP PREC PROD DIV
COLGATE HOYT\GEL KAM (575 UNIVERSITY AVE in NORWOOD, MA)
(Resource Conservation and Recovery Act (tracking hazardous waste)) Business NAICS classification: ALL OTHER MISCELLANEOUS FABRICATED METAL PRODUCT MANUFACTURING. Organizations: COLGATE PALMOLIVE COMPANY (CONTACT/OWNER)
, AMERICAN CYANAMID (CONTACT/OWNER)
Alternative names: ACUFEX MICROSURGICAL INC, COLGATE HOYT LAB
BALCH (1168 WASHINGTON STREET in NORWOOD, MA)
(National Center for Education Statistics) - STATE ID-220005 Organizations: NORWOOD (SCHOOL DISTRICT)
NORWOOD JR HIGH SOUTH (1315 WASHINGTON STREET in NORWOOD, MA)
(National Center for Education Statistics) - STATE ID-220305
JOHN P OLDHAM (165 PROSPECT STREET in NORWOOD, MA)
(National Center for Education Statistics) - STATE ID-220020 Organizations: NORWOOD (SCHOOL DISTRICT)
NORTHROP CORP. ESD PRECISION PRODUCTS PLANT (100 MORSE STREET in NORWOOD, MA)
HAZARDOUS WASTE BIENNIAL REPORTER (Resource Conservation and Recovery Act (tracking hazardous waste)) (Resource Conservation and Recovery Act (tracking hazardous waste)) TRI REPORTER (Tracking of toxic chemicals releasing facilities) Business SIC classification: SEARCH, DETECTION, NAVIGATION, GUIDANCE, AERONAUTICAL, AND NAUTICAL SYSTEMS AND INSTRUMENTS Alternative names: NORTHROP GRUMMAN CORP
OLYMPIC ADHESIVES INC (670 CANTON ST. in NORWOOD, MA)
AIR MINOR (AIRS/AFS) (Resource Conservation and Recovery Act (tracking hazardous waste)) TRI REPORTER (Tracking of toxic chemicals releasing facilities) Business SIC classification: ADHESIVES AND SEALANTS
JET SPRAY CORPORATION (825 UNIVERSITY AVE. in NORWOOD, MA)
AIR MINOR (AIRS/AFS) (Resource Conservation and Recovery Act (tracking hazardous waste)) TRI REPORTER (Tracking of toxic chemicals releasing facilities) Business SIC classification: AIR-CONDITIONING AND WARM AIR HEATING EQUIPMENT AND COMMERCIAL AND INDUSTRIAL REFRIGERATION EQUIPMENT; SERVICE INDUSTRY MACHINERY Organizations: JACOBS FAMILY (CONTACT/OWNER)
NORWOOD HIGH SCHOOL (245 NICHOLS STREET in NORWOOD, MA)
(National Center for Education Statistics) - STATE ID-220505
Housing units lacking complete plumbing facilities: 0.4% Housing units lacking complete kitchen facilities: 1.6%
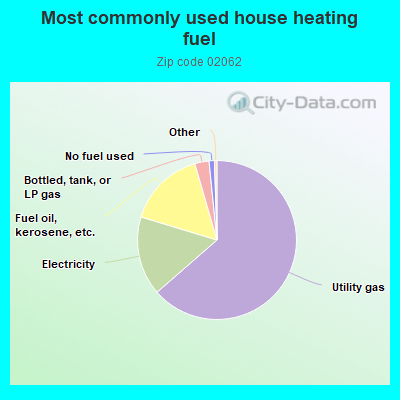
63.6%Utility gas
16.1%Electricity
15.8%Fuel oil, kerosene, etc.
2.9%Bottled, tank, or LP gas
1.1%No fuel used
Population in 1990: 28,700.
Place of birth for U.S.-born residents:
This state: 20,056
Northeast: 2,386
Midwest: 411
South: 818
West: 712
64% of the 02062 zip code residents lived in the same house 5 years ago. Out of people who lived in different houses, 50% lived in this county. Out of people who lived in different counties, 50% lived in Massachusetts.
87% of the 02062 zip code residents lived in the same house 1 year ago. Out of people who lived in different houses, 39% moved from this county. Out of people who lived in different houses, 41% moved from different county within same state. Out of people who lived in different houses, 13% moved from different state. Out of people who lived in different houses, 8% moved from abroad.
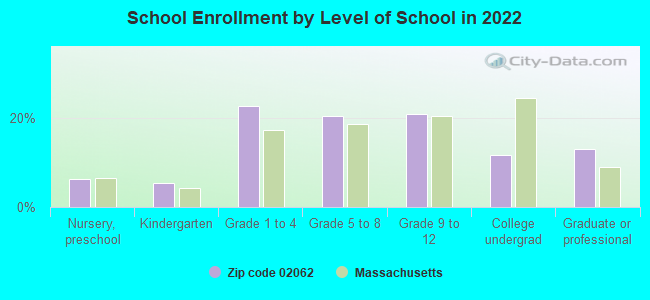
Private vs. public school enrollment:
Students in private schools in grades 1 to 8 (elementary and middle school): 300
Here:
11.1%
Massachusetts:
10.3%
Students in private schools in grades 9 to 12 (high school): 198
Here:
15.1%
Massachusetts:
12.3%
Students in private undergraduate colleges: 186
Here:
25.7%
Massachusetts:
51.2%
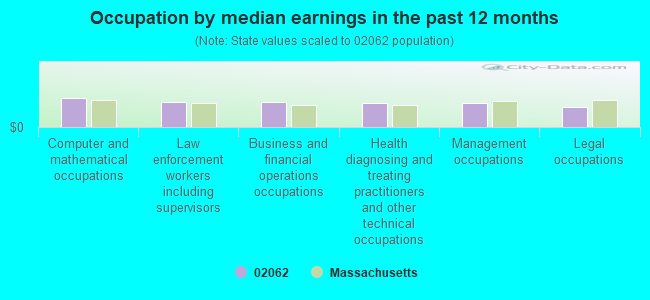
Occupation by median earnings in the past 12 months ($)
106,964Computer and mathematical occupations
90,538Law enforcement workers including supervisors
89,997Business and financial operations occupations
87,683Health diagnosing and treating practitioners and other technical occupations
87,052Management occupations
74,302Legal occupations
Companies with biggest federal contracts located in this zip code (NORWOOD, MA):
FLUOR DANIEL GTI INC (100 RIVER RIDGE DR) : $6,191,538 in 29 contractsfrom 1999 to 2005
Contracts for Operation of Government-Owned Facilities -- Fuel Storage Buildings, Operation of Government-Owned Facilities -- Other Warehouse Buildings, Other Architect and Engineering Services, Other Environmental Services, Studies, and Analytical Support by Defense Logistics Agency, Army Signed by year:2000: $1,597,500; 2001: $2,432,108; 2002: $726,050; 2003: $172,844; 2004: $0; 2005: -$1,814,403; 2006: $0.
Biggest contracts:
$1,800,000 with Defense Logistics Agency for Operation of Government-Owned Facilities -- Fuel Storage Buildings. Taking place in SC. Signed on 2001-12-12. Completion date: 2003-11-14.
$1,144,000 with Defense Logistics Agency for Operation of Government-Owned Facilities -- Other Warehouse Buildings. Taking place in CA. Signed on 1999-12-09. Completion date: 2002-12-31.
$1,030,000 with Defense Logistics Agency for Operation of Government-Owned Facilities -- Fuel Storage Buildings. Taking place in WA. Signed on 1999-10-25. Completion date: 1999-12-31.
$967,711 with Defense Logistics Agency for Operation of Government-Owned Facilities -- Fuel Storage Buildings. Taking place in SC. Signed on 2005-05-26. Completion date: 2005-05-26.
HALL KEEN MANAGEMENT INC (320 NORWOOD PARK SOUTH; small business) : $5,622,662 in 269 contractsfrom 2000 to 2003
Contracts for Other Management Support Services, Maintenance, Repair or Alteration of Real Property -- Troop Housing Facilities by Navy Signed by year:2000: $1,102,668; 2001: $894,088; 2002: $2,432,787; 2003: $1,193,119; 2004: $0; 2005: $0; 2006: $0.
Biggest contracts:
$590,697 with Navy for Other Management Support Services. Taking place in NH. Signed on 2000-10-01. Completion date: 2001-09-29.
$574,682 with Navy for Maintenance, Repair or Alteration of Real Property -- Troop Housing Facilities. Taking place in NH. Signed on 2002-05-15. Completion date: 2002-09-28.
$507,287 with Navy for Maintenance, Repair or Alteration of Real Property -- Troop Housing Facilities. Taking place in PA. Signed on 2003-09-23. Completion date: 2003-09-30.
$492,776, same as above.Signed on 2002-08-29. Completion date: 2003-09-30.
AMERICAN INK & OIL CORPORATION (33 ENDICOTT ST; small business) : $3,144,246 in 53 contractsfrom 2000 to 2006
Contracts for Oils and Greases: Cutting, Lubricating, and Hydraulic, Guns, 75 mm through 125 mm, Engine Electrical System Components, Aircraft Prime Moving, Miscellaneous Chemical Specialties by Defense Logistics Agency, Army Signed by year:2000: $81,798; 2001: $152,569; 2002: $259,895; 2003: $95,882; 2004: $1,760,011; 2005: $430,865; 2006: $363,226.
Biggest contracts:
$793,488 with Defense Logistics Agency for Oils and Greases: Cutting, Lubricating, and Hydraulic. Signed on 2004-06-18. Completion date: 2005-06-17.
$448,064, same as above.Signed on 2004-08-13. Completion date: 2009-08-12.
$186,680, same as above.Signed on 2004-09-17. Completion date: 2005-09-16.
$100,000, same as above.Signed on 2006-01-26. Completion date: 2011-01-25.
ANALOG DEVICES INC (1 TECHNOLOGY WAY) : $1,337,597 in 13 contractsfrom 2000 to 2006
Contracts for Other Defense -- Applied Research and Exploratory Development (R&D), Amplifiers, Miscellaneous Electrical and Electronic Components, Microcircuits, Electronic, and moreby Army, Navy, National Highway Traffic Safety Administration, Defense Logistics Agency, and others Signed by year:2000: $775,434; 2001: $0; 2002: $378,409; 2003: $57,741; 2004: $98,413; 2005: $23,050; 2006: $4,550.
Biggest contracts:
$775,434 with Army for Other Defense -- Applied Research and Exploratory Development (R&D). Signed on 2000-01-11. Completion date: 2001-01-15.
$330,409, same as above.Signed on 2002-03-22. Completion date: 2002-12-31.
$48,153 with Navy for Amplifiers. Signed on 2004-10-05. Completion date: 2005-01-07.
$48,000 with National Highway Traffic Safety Administration for Miscellaneous Electrical and Electronic Components. Taking place in OH. Signed on 2002-02-15. Completion date: 2002-06-15.
JUNCTION INCORPORATED (640 PLEASANT ST; small business) : $1,166,923 in 84 contractsfrom 2002 to 2006
Contracts for Maintenance, Repair or Alteration of Real Property -- Office Buildings, Maintenance, Repair or Alteration of Real Property -- Heating and Cooling Plants, Maintenance, Repair and Rebuilding of Equipment -- Plumbing, Heating, and Waste Disposal Equipment, Maintenance, Repair or Alteration of Real Property -- EPG Facilities - Other, Including Transmission, and moreby Army Signed by year:2000: $0; 2001: $0; 2002: $14,300; 2003: $116,120; 2004: $108,932; 2005: $548,530; 2006: $379,041.
Biggest contracts:
$235,992 with Army for Maintenance, Repair or Alteration of Real Property -- Office Buildings. Signed on 2004-08-04. Completion date: 2005-08-31.
$92,750, same as above.Signed on 2006-06-21. Completion date: 2006-08-22.
$85,000, same as above.Signed on 2006-06-28. Completion date: 2006-07-28.
$58,998, same as above.Signed on 2005-02-16. Completion date: 2005-05-31.
VISHAY BLH (3 EDGEWATER DRIVE) : $307,980 in 8 contractsfrom 2002 to 2005
Contracts for Automatic Pilot Mechanisms and Airborne Gyro Components, Measuring Tools, Craftsmen's, Specialized Ammunition and Ordnance Machinery and Related Equipment, Cable, Cord, and Wire Assemblies: Communications Equipment by Defense Logistics Agency, Air Force, Navy Signed by year:2000: $0; 2001: $0; 2002: $233,250; 2003: $3,880; 2004: $3,350; 2005: $67,500; 2006: $0.
Biggest contracts:
$144,000 with Defense Logistics Agency for Automatic Pilot Mechanisms and Airborne Gyro Components. Signed on 2002-07-12. Completion date: 2002-12-09.
$89,250, same as above.Signed on 2002-02-11. Completion date: 2002-05-20.
$58,230, same as above.Signed on 2005-07-05. Completion date: 2006-02-14.
$9,270 with Air Force for Measuring Tools, Craftsmen's. Taking place in CA. Signed on 2005-03-09. Completion date: 2005-05-06.
SPIRAL BIOTECH INC (2 TECHNOLOGY WAY; small business) : $297,258 in 17 contractsfrom 2001 to 2006
Contracts for Laboratory Equipment and Supplies, Chemical Analysis Instruments, Medical and Surgical Instruments, Equipment, and Supplies, Electrical and Electronic Properties Measuring and Testing Instruments, and moreby Army, Navy, Centers for Disease Control and Prevention, Uniformed Services University of the Health Sciences, and others Signed by year:2000: $0; 2001: $32,036; 2002: $49,267; 2003: $5,700; 2004: $44,880; 2005: $33,295; 2006: $132,080.
Biggest contracts:
$42,592 with Army for Laboratory Equipment and Supplies. Signed on 2006-01-31. Completion date: 2006-02-20.
$33,068, same as above.Signed on 2006-06-09. Completion date: 2006-07-20.
$32,936, same as above.Signed on 2002-08-30. Completion date: 2002-10-11.
$32,036 with Army for Chemical Analysis Instruments. Signed on 2001-08-23. Completion date: 2001-10-15.
MOLECULAR GEODESICS, INC (110 KERRY PLACE; small business)
$253,000 with Navy for Other Defense -- Applied Research and Exploratory Development (R&D). Signed on 2000-01-11. Completion date: 2000-06-09.
KAMAN INDUSTRIAL TECHNOLOGIES (15R COTTAGE ST; small business) : $179,096 in 2 contractsfrom 2001 to 2005
$121,671 with Army for Hand Tools, Nonedged, Nonpowered. Signed on 2005-04-13. Completion date: 2005-06-30.
$57,425 with Army for Torque Converters and Speed Changers. Signed on 2001-03-28. Completion date: 2001-09-14.
ICET, INC (916 PLEASANT ST , UNIT 12; small business) : $160,904 in 5 contractsfrom 2000 to 2004
Contracts for Other Research and Development -- Basic Research (R&D), Services -- Basic Research (R&D) by Army Signed by year:2000: $90,056; 2001: $0; 2002: $0; 2003: $79,654; 2004: -$8,806; 2005: $0; 2006: $0.
Biggest contracts:
$90,056 with Army for Other Research and Development -- Basic Research (R&D). Signed on 2000-08-11. Completion date: 2001-02-10.
$45,154 with Army for Services -- Basic Research (R&D). Signed on 2003-06-24. Completion date: 2004-08-14.
$34,500, same as above.Signed on 2003-09-16. Completion date: 2004-11-30.
$0, same as above.Signed on 2003-06-24. Completion date: 2004-08-14.
Top industries in this zip code by the number of employees in 2005:
Health Care and Social Assistance: General Medical and Surgical Hospitals (over 1000 employees: 1 establishment)
Administrative and Support and Waste Management and Remediation Services: Temporary Help Services (500-999: 1, 100-249: 1, 50-99: 2, 20-49: 1, 1-4: 2)
Professional, Scientific, and Technical Services: Research and Development in the Physical, Engineering, and Life Sciences (250-499: 1, 50-99: 2, 20-49: 2, 5-9: 1)
People in group quarters in 2010:
376 people in nursing facilities/skilled-nursing facilities
7 people in group homes intended for adults
5 people in group homes for juveniles (non-correctional)
4 people in workers' group living quarters and job corps centers
3 people in other noninstitutional facilities
People in group quarters in 2000:
437 people in nursing homes
82 people in other nonhousehold living situations
21 people in homes for the mentally retarded
10 people in homes for abused, dependent, and neglected children
10 people in unknown juvenile institutions
3 people in hospitals or wards for drug/alcohol abuse
Fatal accident statistics in 2014:
Fatal accident count: 4
Vehicles involved in fatal accidents: 10
Fatal accidents caused by drunken drivers: 3
Fatalities: 6
Persons involved in fatal accidents: 23
Pedestrians involved in fatal accidents: 0
Fatal accident statistics in 2013:
Fatal accident count: 2
Vehicles involved in fatal accidents: 3
Fatal accidents caused by drunken drivers: 2
Fatalities: 3
Persons involved in fatal accidents: 4
Pedestrians involved in fatal accidents: 0
Home Mortgage Disclosure Act Aggregated Statistics For Year 2009 (Based on 10 full tracts)
A) FHA, FSA/RHS & VA Home Purchase Loans
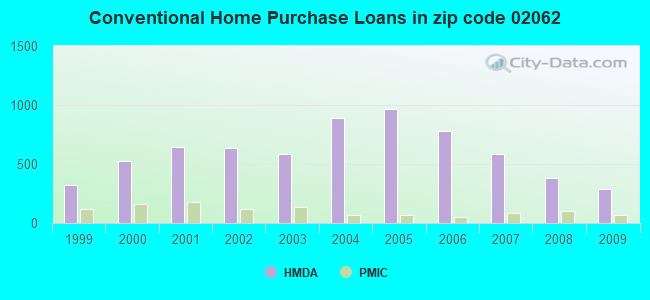
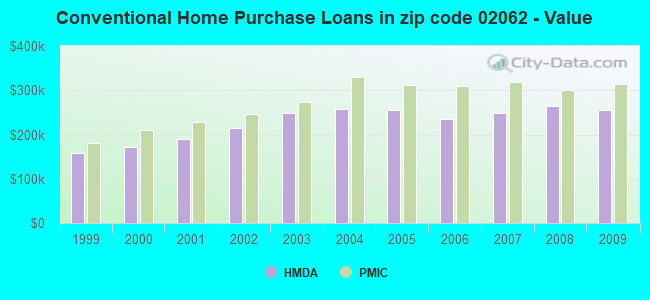
B) Conventional Home Purchase Loans
C) Refinancings
D) Home Improvement Loans
E) Loans on Dwellings For 5+ Families
F) Non-occupant Loans on < 5 Family Dwellings (A B C & D)
Number
Average Value
Number
Average Value
Number
Average Value
Number
Average Value
Number
Average Value
Number
Average Value
LOANS ORIGINATED
104
$304,778
285
$255,653
1,551
$254,702
118
$160,553
4
$534,948
38
$238,433
APPLICATIONS APPROVED, NOT ACCEPTED
4
$264,032
16
$200,734
92
$267,746
14
$60,101
0
$0
6
$142,068
APPLICATIONS DENIED
18
$261,312
34
$189,406
363
$295,219
26
$101,623
0
$0
16
$251,532
APPLICATIONS WITHDRAWN
8
$325,961
52
$230,072
239
$288,907
10
$186,033
0
$0
6
$164,365
FILES CLOSED FOR INCOMPLETENESS
0
$0
14
$211,924
122
$272,970
4
$92,490
0
$0
2
$330,970
Aggregated Statistics For Year 2008 (Based on 10 full tracts)
A) FHA, FSA/RHS & VA Home Purchase Loans
B) Conventional Home Purchase Loans
C) Refinancings
D) Home Improvement Loans
E) Loans on Dwellings For 5+ Families
F) Non-occupant Loans on < 5 Family Dwellings (A B C & D)
Number
Average Value
Number
Average Value
Number
Average Value
Number
Average Value
Number
Average Value
Number
Average Value
LOANS ORIGINATED
66
$303,371
379
$263,356
730
$260,905
92
$122,349
6
$688,603
62
$279,430
APPLICATIONS APPROVED, NOT ACCEPTED
4
$219,842
38
$219,239
58
$247,774
22
$40,146
0
$0
4
$191,980
APPLICATIONS DENIED
22
$282,545
42
$314,287
227
$279,116
38
$80,883
0
$0
10
$328,429
APPLICATIONS WITHDRAWN
4
$359,758
32
$277,790
114
$276,976
14
$114,541
0
$0
10
$282,582
FILES CLOSED FOR INCOMPLETENESS
2
$356,965
18
$230,604
30
$271,427
4
$37,368
0
$0
0
$0
Aggregated Statistics For Year 2007 (Based on 10 full tracts)
A) FHA, FSA/RHS & VA Home Purchase Loans
B) Conventional Home Purchase Loans
C) Refinancings
D) Home Improvement Loans
E) Loans on Dwellings For 5+ Families
F) Non-occupant Loans on < 5 Family Dwellings (A B C & D)
Number
Average Value
Number
Average Value
Number
Average Value
Number
Average Value
Number
Average Value
Number
Average Value
LOANS ORIGINATED
14
$302,199
585
$249,299
804
$228,300
190
$98,476
20
$4,429,268
88
$254,400
APPLICATIONS APPROVED, NOT ACCEPTED
0
$0
38
$264,476
110
$234,273
20
$63,462
0
$0
6
$285,778
APPLICATIONS DENIED
2
$301,065
92
$264,540
427
$272,131
94
$117,797
2
$486,145
52
$305,057
APPLICATIONS WITHDRAWN
2
$328,965
74
$256,521
158
$277,481
14
$56,178
0
$0
8
$296,565
FILES CLOSED FOR INCOMPLETENESS
0
$0
10
$206,956
86
$291,340
4
$343,035
0
$0
4
$237,440
Aggregated Statistics For Year 2006 (Based on 10 full tracts)
A) FHA, FSA/RHS & VA Home Purchase Loans
B) Conventional Home Purchase Loans
C) Refinancings
D) Home Improvement Loans
E) Loans on Dwellings For 5+ Families
F) Non-occupant Loans on < 5 Family Dwellings (A B C & D)
G) Loans On Manufactured Home Dwelling (A B C & D)
Number
Average Value
Number
Average Value
Number
Average Value
Number
Average Value
Number
Average Value
Number
Average Value
Number
Average Value
LOANS ORIGINATED
2
$348,915
780
$233,908
1,036
$218,491
247
$96,202
6
$18,431,120
100
$257,562
0
$0
APPLICATIONS APPROVED, NOT ACCEPTED
0
$0
56
$194,052
134
$196,107
24
$88,185
0
$0
14
$246,551
0
$0
APPLICATIONS DENIED
2
$407,445
150
$232,302
487
$256,482
90
$97,488
2
$423,960
36
$285,530
2
$428,955
APPLICATIONS WITHDRAWN
4
$276,472
84
$249,194
327
$258,061
18
$78,139
0
$0
16
$246,042
0
$0
FILES CLOSED FOR INCOMPLETENESS
0
$0
24
$253,729
56
$301,045
2
$32,860
0
$0
0
$0
0
$0
Aggregated Statistics For Year 2005 (Based on 10 full tracts)
A) FHA, FSA/RHS & VA Home Purchase Loans
B) Conventional Home Purchase Loans
C) Refinancings
D) Home Improvement Loans
E) Loans on Dwellings For 5+ Families
F) Non-occupant Loans on < 5 Family Dwellings (A B C & D)
G) Loans On Manufactured Home Dwelling (A B C & D)
Number
Average Value
Number
Average Value
Number
Average Value
Number
Average Value
Number
Average Value
Number
Average Value
Number
Average Value
LOANS ORIGINATED
0
$0
964
$256,275
1,327
$244,200
265
$118,769
4
$600,600
124
$290,960
2
$34,995
APPLICATIONS APPROVED, NOT ACCEPTED
0
$0
84
$215,997
144
$245,817
30
$95,519
2
$44,830
4
$421,958
0
$0
APPLICATIONS DENIED
6
$295,873
148
$265,429
369
$265,214
62
$103,055
2
$531,350
56
$252,608
0
$0
APPLICATIONS WITHDRAWN
0
$0
150
$237,285
285
$276,895
40
$147,145
0
$0
20
$248,514
2
$409,960
FILES CLOSED FOR INCOMPLETENESS
0
$0
58
$209,023
178
$289,651
0
$0
2
$599,940
4
$443,980
0
$0
Aggregated Statistics For Year 2004 (Based on 10 full tracts)
A) FHA, FSA/RHS & VA Home Purchase Loans
B) Conventional Home Purchase Loans
C) Refinancings
D) Home Improvement Loans
E) Loans on Dwellings For 5+ Families
F) Non-occupant Loans on < 5 Family Dwellings (A B C & D)
G) Loans On Manufactured Home Dwelling (A B C & D)
Number
Average Value
Number
Average Value
Number
Average Value
Number
Average Value
Number
Average Value
Number
Average Value
Number
Average Value
LOANS ORIGINATED
4
$320,345
886
$256,808
1,609
$229,057
162
$151,916
8
$1,485,315
150
$279,188
2
$190,275
APPLICATIONS APPROVED, NOT ACCEPTED
0
$0
82
$275,338
198
$235,009
32
$144,604
0
$0
22
$269,058
2
$114,645
APPLICATIONS DENIED
2
$504,950
116
$260,533
311
$260,240
62
$100,181
2
$398,480
26
$333,108
0
$0
APPLICATIONS WITHDRAWN
0
$0
90
$255,917
269
$225,235
30
$109,136
0
$0
14
$212,886
2
$144,985
FILES CLOSED FOR INCOMPLETENESS
0
$0
26
$209,635
190
$252,019
6
$198,980
0
$0
6
$199,063
0
$0
Aggregated Statistics For Year 2003 (Based on 10 full tracts)
A) FHA, FSA/RHS & VA Home Purchase Loans
B) Conventional Home Purchase Loans
C) Refinancings
D) Home Improvement Loans
E) Loans on Dwellings For 5+ Families
F) Non-occupant Loans on < 5 Family Dwellings (A B C & D)
Number
Average Value
Number
Average Value
Number
Average Value
Number
Average Value
Number
Average Value
Number
Average Value
LOANS ORIGINATED
12
$261,292
583
$247,562
3,951
$186,533
104
$76,687
12
$1,009,824
220
$225,669
APPLICATIONS APPROVED, NOT ACCEPTED
0
$0
76
$246,848
389
$185,192
16
$87,604
0
$0
26
$193,673
APPLICATIONS DENIED
2
$220,980
74
$253,487
551
$198,249
48
$56,913
2
$747,675
48
$143,977
APPLICATIONS WITHDRAWN
0
$0
72
$225,450
481
$198,387
18
$68,460
0
$0
24
$238,261
FILES CLOSED FOR INCOMPLETENESS
2
$167,280
6
$212,990
42
$175,749
8
$110,362
0
$0
0
$0
Aggregated Statistics For Year 2002 (Based on 10 full tracts)
A) FHA, FSA/RHS & VA Home Purchase Loans
B) Conventional Home Purchase Loans
C) Refinancings
D) Home Improvement Loans
E) Loans on Dwellings For 5+ Families
F) Non-occupant Loans on < 5 Family Dwellings (A B C & D)
Number
Average Value
Number
Average Value
Number
Average Value
Number
Average Value
Number
Average Value
Number
Average Value
LOANS ORIGINATED
18
$230,943
639
$214,973
2,744
$180,836
152
$54,190
12
$909,806
136
$208,171
APPLICATIONS APPROVED, NOT ACCEPTED
6
$151,113
58
$227,563
309
$173,881
34
$50,807
0
$0
12
$246,086
APPLICATIONS DENIED
4
$285,910
38
$204,979
307
$189,331
46
$50,778
2
$1,099,890
32
$137,588
APPLICATIONS WITHDRAWN
2
$263,995
76
$228,370
245
$186,109
24
$61,175
2
$179,980
6
$183,240
FILES CLOSED FOR INCOMPLETENESS
0
$0
16
$246,381
130
$197,448
0
$0
0
$0
4
$106,288
Aggregated Statistics For Year 2001 (Based on 10 full tracts)
A) FHA, FSA/RHS & VA Home Purchase Loans
B) Conventional Home Purchase Loans
C) Refinancings
D) Home Improvement Loans
E) Loans on Dwellings For 5+ Families
F) Non-occupant Loans on < 5 Family Dwellings (A B C & D)
Number
Average Value
Number
Average Value
Number
Average Value
Number
Average Value
Number
Average Value
Number
Average Value
LOANS ORIGINATED
38
$194,362
645
$189,104
1,968
$172,077
134
$40,230
10
$346,704
90
$196,775
APPLICATIONS APPROVED, NOT ACCEPTED
0
$0
58
$190,146
219
$157,371
46
$41,233
0
$0
12
$233,747
APPLICATIONS DENIED
0
$0
56
$174,029
305
$152,217
64
$56,142
0
$0
6
$74,967
APPLICATIONS WITHDRAWN
0
$0
56
$177,015
237
$155,529
26
$49,518
0
$0
8
$150,662
FILES CLOSED FOR INCOMPLETENESS
0
$0
4
$150,448
34
$182,331
2
$3,985
0
$0
4
$234,108
Aggregated Statistics For Year 2000 (Based on 10 full tracts)
A) FHA, FSA/RHS & VA Home Purchase Loans
B) Conventional Home Purchase Loans
C) Refinancings
D) Home Improvement Loans
E) Loans on Dwellings For 5+ Families
F) Non-occupant Loans on < 5 Family Dwellings (A B C & D)
Number
Average Value
Number
Average Value
Number
Average Value
Number
Average Value
Number
Average Value
Number
Average Value
LOANS ORIGINATED
20
$202,826
527
$171,627
453
$155,201
154
$33,896
6
$264,270
42
$272,545
APPLICATIONS APPROVED, NOT ACCEPTED
6
$212,485
64
$179,315
60
$116,435
56
$24,914
0
$0
2
$74,990
APPLICATIONS DENIED
4
$238,662
68
$187,180
180
$94,633
48
$25,673
0
$0
6
$76,365
APPLICATIONS WITHDRAWN
0
$0
52
$239,592
88
$95,328
16
$37,749
0
$0
6
$471,790
FILES CLOSED FOR INCOMPLETENESS
0
$0
6
$108,915
22
$85,755
2
$64,995
0
$0
2
$12,945
Aggregated Statistics For Year 1999 (Based on 5 full tracts)
A) FHA, FSA/RHS & VA Home Purchase Loans
B) Conventional Home Purchase Loans
C) Refinancings
D) Home Improvement Loans
E) Loans on Dwellings For 5+ Families
F) Non-occupant Loans on < 5 Family Dwellings (A B C & D)
2002 - 2018 National Fire Incident Reporting System (NFIRS) incidents
According to the data from the years 2002 - 2018 the average number of fires per year is 108. The highest number of reported fires - 163 took place in 2015, and the least - 23 in 2002. The data has an increasing trend.
When looking into fire subcategories, the most incidents belonged to: Outside Fires (48.2%), and Structure Fires (40.2%).
Fire incident types reported to NFIRS in Zip Code 02062


 Nearest zip codes: 02032, 02090, 02026, 02021, 02067, 02081.


 According to the data from the years 2002 - 2018 the average number of fires per year is 108. The highest number of reported fires - 163 took place in 2015, and the least - 23 in 2002. The data has an increasing trend.
 When looking into fire subcategories, the most incidents belonged to: Outside Fires (48.2%), and Structure Fires (40.2%).