Estimated zip code population in 2022: 17,733 Zip code population in 2010: 16,532 Zip code population in 2000: 16,866
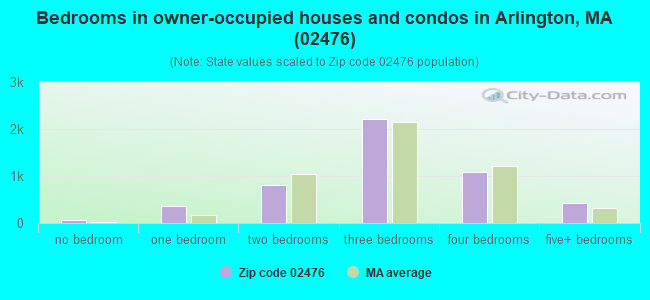
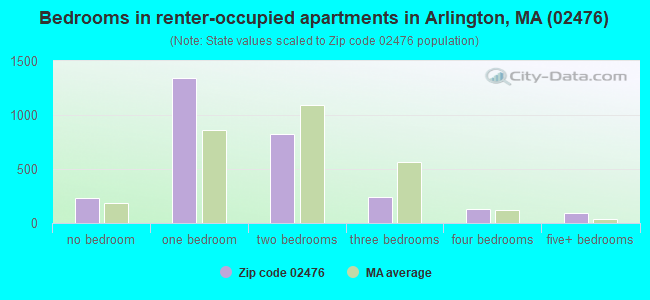
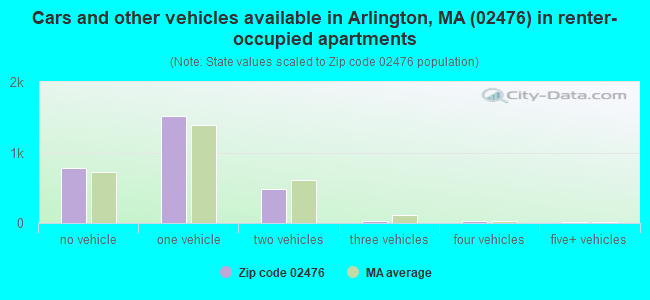
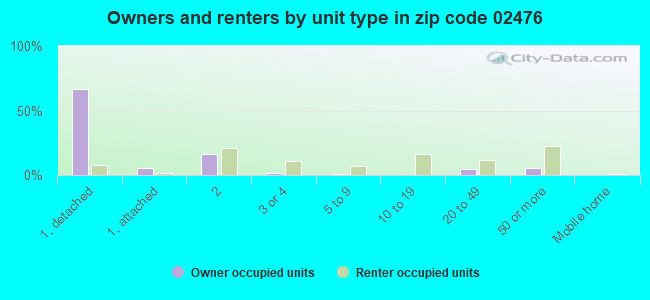
Houses and condos: 7,927 Renter-occupied apartments: 2,863
% of renters here:
37%
State:
38%
March 2022 cost of living index in zip code 02476: 135.8 (high, U.S. average is 100)
Land area: 2.1 sq. mi. Water area: 0.1 sq. mi.
Population density: 8,470 people per square mile
(high).
OSM Map
Google Map
MSN Map
OSM Map
General Map
Google Map
MSN Map
OSM Map
Google Map
MSN Map
OSM Map
Google Map
MSN Map
Please wait while loading the map...
Real estate property taxes paid for housing units in 2022:
This zip code:
1.0% ($9,067)
Massachusetts:
1.0% ($5,536)
Median real estate property taxes paid for housing units with mortgages in 2022: $9,122 (0.9%) Median real estate property taxes paid for housing units with no mortgage in 2022: $8,976 (1.1%)
Business Search- 14 Million verified businesses
Males: 8,233
(46.4%)
Females: 9,499
(53.6%)
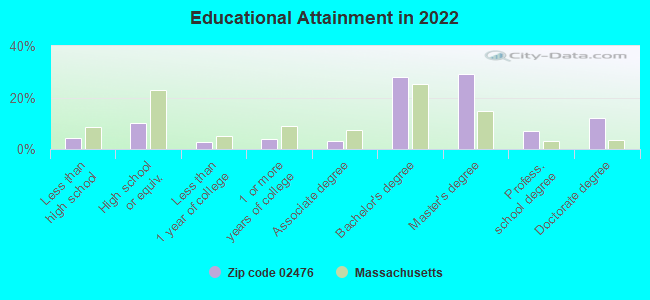
For population 25 years and over in 02476:
High school or higher: 97.1%
Bachelor's degree or higher: 76.9%
Graduate or professional degree: 48.7%
Unemployed: 1.9%
Mean travel time to work (commute): 31.2 minutes
For population 15 years and over in 02476:
Never married: 30.6%
Now married: 55.6%
Separated: 1.0%
Widowed: 4.5%
Divorced: 8.2%
Zip code 02476 compared to state average:
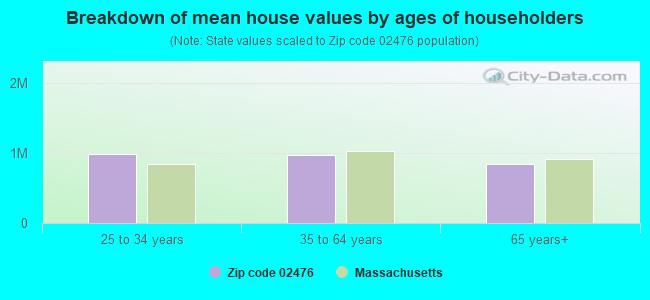
Median house value above state average.
Unemployed percentage below state average.
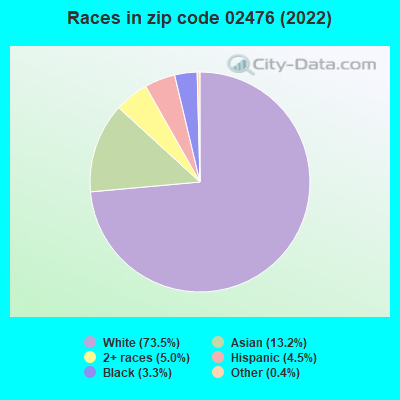
Black race population percentage below state average.
Hispanic race population percentage below state average.
Median age above state average.
Length of stay since moving in significantly above state average.
Percentage of population with a bachelor's degree or higher above state average.
Estimated median house/condo value in 2022: $936,139
02476:
$936,139
Massachusetts:
$534,700
According to our research of Massachusetts and other state lists, there was 1 registered sex offender living in 02476 zip code as of April 27, 2024. The ratio of all residents to sex offenders in zip code 02476 is 16,728 to 1. The ratio of registered sex offenders to all residents in this zip code is much lower than the state average.
Median resident age:
This zip code:
45.5 years
Massachusetts median age:
40.3 years
Average household size:
This zip code:
2.2 people
Massachusetts:
2.4 people
Averages for the 2020 tax year for zip code 02476, filed in 2021:
Average Adjusted Gross Income (AGI) in 2020: $167,794 (Individual Income Tax Returns)
Here:
$167,794
State:
$105,130
Salary/wage: $146,179 (reported on 79.6% of returns)
Here:
$146,179
State:
$82,951
(% of AGI for various income ranges: 1085.3% for AGIs below $25k, 3754.9% for AGIs $25k-50k, 6286.9% for AGIs $50k-75k, 10222.7% for AGIs $75k-100k, 21114.6% for AGIs $100k-200k, 114561.8% for AGIs over 200k)
Taxable interest for individuals: $2,012 (reported on 59.5% of returns)
This zip code:
$2,012
Massachusetts:
$2,361
(% of AGI for various income ranges: 55.0% for AGIs below $25k, 87.5% for AGIs $25k-50k, 108.4% for AGIs $50k-75k, 154.0% for AGIs $75k-100k, 262.2% for AGIs $100k-200k, 899.2% for AGIs over 200k)
Ordinary dividends: $10,101 (reported on 48.2% of returns)
Here:
$10,101
State:
$10,365
(% of AGI for various income ranges: 105.8% for AGIs below $25k, 172.9% for AGIs $25k-50k, 284.9% for AGIs $50k-75k, 440.0% for AGIs $75k-100k, 939.7% for AGIs $100k-200k, 4562.5% for AGIs over 200k)
Net capital gain/loss in AGI: +$41,869 (reported on 42.8% of returns)
Here:
+$41,869
State:
+$48,178
(% of AGI for various income ranges: 50.1% for AGIs below $25k, 88.1% for AGIs $25k-50k, 251.9% for AGIs $50k-75k, 417.1% for AGIs $75k-100k, 1193.1% for AGIs $100k-200k, 23448.7% for AGIs over 200k)
Profit/loss from business: +$28,569 (reported on 20.3% of returns)
Here:
+$28,569
State:
+$20,792
(% of AGI for various income ranges: 168.1% for AGIs below $25k, 322.8% for AGIs $25k-50k, 412.5% for AGIs $50k-75k, 701.9% for AGIs $75k-100k, 1240.8% for AGIs $100k-200k, 4833.5% for AGIs over 200k)
Taxable individual retirement arrangement distribution: $23,166 (reported on 13.9% of returns)
02476:
$23,166
Massachusetts:
$22,790
(% of AGI for various income ranges: 94.7% for AGIs below $25k, 230.4% for AGIs $25k-50k, 371.8% for AGIs $50k-75k, 574.8% for AGIs $75k-100k, 1048.8% for AGIs $100k-200k, 1737.0% for AGIs over 200k)
Self-employed (Keogh) retirement plans: $24,911 (reported on 3.1% of returns)
02476:
$24,911
Massachusetts:
$26,868
(% of AGI for various income ranges: 58.1% for AGIs $50k-75k, 128.9% for AGIs $100k-200k, 846.8% for AGIs over 200k)
Total itemized deductions: $35,338 (reported on 24.1% of returns)
Here:
$35,338
State:
$36,722
(% of AGI for various income ranges: 231.9% for AGIs below $25k, 289.7% for AGIs $25k-50k, 622.9% for AGIs $50k-75k, 1185.4% for AGIs $75k-100k, 1751.6% for AGIs $100k-200k, 7280.5% for AGIs over 200k)
Charity contributions: $10,010 (reported on 20.0% of returns)
Here:
$10,010
State:
$12,529
(% of AGI for various income ranges: 7.4% for AGIs below $25k, 12.4% for AGIs $25k-50k, 72.4% for AGIs $50k-75k, 133.5% for AGIs $75k-100k, 259.2% for AGIs $100k-200k, 2287.2% for AGIs over 200k)
Taxes paid: $9,314 (reported on 24.1% of returns)
02476:
$9,314
State:
$8,782
(% of AGI for various income ranges: 55.0% for AGIs below $25k, 75.4% for AGIs $25k-50k, 195.4% for AGIs $50k-75k, 367.1% for AGIs $75k-100k, 545.6% for AGIs $100k-200k, 1713.8% for AGIs over 200k)
Earned income credit: $1,187 (reported on 3.5% of returns)
Here:
$1,187
State:
$1,909
(% of AGI for various income ranges: 27.7% for AGIs below $25k, 19.1% for AGIs $25k-50k)
Percentage of individuals using paid preparers for their 2020 taxes: 90.1%
Here:
90%
State:
92%
(% for various income ranges: 86.9% for AGIs below $25k, 88.0% for AGIs $25k-50k, 87.9% for AGIs $50k-75k, 88.2% for AGIs $75k-100k, 90.9% for AGIs $100k-200k, 94.8% for AGIs over 200k)
Averages for the 2012 tax year for zip code 02476, filed in 2013:
Average Adjusted Gross Income (AGI) in 2012: $106,049 (Individual Income Tax Returns)
Here:
$106,049
State:
$81,425
Salary/wage: $96,898 (reported on 80.8% of returns)
Here:
$96,898
State:
$64,752
(% of AGI for various income ranges: 60.5% for AGIs below $25k, 69.8% for AGIs $25k-50k, 71.1% for AGIs $50k-75k, 73.6% for AGIs $75k-100k, 80.6% for AGIs $100k-200k, 70.7% for AGIs over 200k)
Taxable interest for individuals: $1,463 (reported on 60.4% of returns)
This zip code:
$1,463
Massachusetts:
$2,136
(% of AGI for various income ranges: 3.2% for AGIs below $25k, 1.2% for AGIs $25k-50k, 1.2% for AGIs $50k-75k, 1.0% for AGIs $75k-100k, 0.6% for AGIs $100k-200k, 0.8% for AGIs over 200k)
Ordinary dividends: $6,589 (reported on 43.1% of returns)
Here:
$6,589
State:
$9,473
(% of AGI for various income ranges: 4.7% for AGIs below $25k, 2.1% for AGIs $25k-50k, 3.0% for AGIs $50k-75k, 2.8% for AGIs $75k-100k, 2.0% for AGIs $100k-200k, 3.1% for AGIs over 200k)
Net capital gain/loss in AGI: +$17,407 (reported on 35.1% of returns)
Here:
+$17,407
State:
+$31,437
(% of AGI for various income ranges: 0.4% for AGIs below $25k, 0.5% for AGIs $25k-50k, 1.1% for AGIs $50k-75k, 1.6% for AGIs $75k-100k, 1.8% for AGIs $100k-200k, 11.3% for AGIs over 200k)
Profit/loss from business: +$23,672 (reported on 20.4% of returns)
Here:
+$23,672
State:
+$20,662
(% of AGI for various income ranges: 8.2% for AGIs below $25k, 6.4% for AGIs $25k-50k, 5.2% for AGIs $50k-75k, 4.6% for AGIs $75k-100k, 4.8% for AGIs $100k-200k, 3.8% for AGIs over 200k)
Taxable individual retirement arrangement distribution: $17,271 (reported on 14.5% of returns)
02476:
$17,271
Massachusetts:
$18,892
(% of AGI for various income ranges: 6.1% for AGIs below $25k, 3.9% for AGIs $25k-50k, 3.1% for AGIs $50k-75k, 3.4% for AGIs $75k-100k, 2.3% for AGIs $100k-200k, 1.7% for AGIs over 200k)
Self-employment retirement plans: $16,035 (reported on 2.7% of returns)
02476:
$16,035
Massachusetts:
$20,669
(% of AGI for various income ranges: 0.3% for AGIs $50k-75k, 0.3% for AGIs $75k-100k, 0.4% for AGIs $100k-200k, 0.5% for AGIs over 200k)
Total itemized deductions: $28,499 (18% of AGI, reported on 54.4% of returns)
Here:
$28,499
State:
$28,907
Here:
17.7% of AGI
State:
18.2% of AGI
(% of AGI for various income ranges: 24.6% for AGIs below $25k, 13.6% for AGIs $25k-50k, 14.5% for AGIs $50k-75k, 15.4% for AGIs $75k-100k, 16.3% for AGIs $100k-200k, 12.8% for AGIs over 200k)
Charity contributions: $3,504 (reported on 47.1% of returns)
Here:
$3,504
State:
$4,208
(% of AGI for various income ranges: 1.1% for AGIs below $25k, 0.9% for AGIs $25k-50k, 1.2% for AGIs $50k-75k, 1.4% for AGIs $75k-100k, 1.4% for AGIs $100k-200k, 1.8% for AGIs over 200k)
Taxes paid: $14,500 (reported on 54.3% of returns)
02476:
$14,500
State:
$13,303
(% of AGI for various income ranges: 7.5% for AGIs below $25k, 5.0% for AGIs $25k-50k, 6.2% for AGIs $50k-75k, 7.2% for AGIs $75k-100k, 8.3% for AGIs $100k-200k, 7.4% for AGIs over 200k)
Earned income credit: $1,145 (reported on 4.6% of returns)
Here:
$1,145
State:
$1,971
(% of AGI for various income ranges: 1.6% for AGIs below $25k, 0.3% for AGIs $25k-50k)
Percentage of individuals using paid preparers for their 2012 taxes: 51.4%
Here:
51%
State:
56%
(% for various income ranges: 47.0% for AGIs below $25k, 50.4% for AGIs $25k-50k, 51.6% for AGIs $50k-75k, 50.0% for AGIs $75k-100k, 51.7% for AGIs $100k-200k, 61.3% for AGIs over 200k)
Averages for the 2004 tax year for zip code 02476, filed in 2005:
Average Adjusted Gross Income (AGI) in 2004: $76,903 (Individual Income Tax Returns)
Here:
$76,903
State:
$62,877
Salary/wage: $69,038 (reported on 79.5% of returns)
Here:
$69,038
State:
$52,969
(% of AGI for various income ranges: 79.5% for AGIs below $10k, 53.9% for AGIs $10k-25k, 71.8% for AGIs $25k-50k, 76.6% for AGIs $50k-75k, 80.0% for AGIs $75k-100k, 69.3% for AGIs over 100k)
Taxable interest for individuals: $2,064 (reported on 71.7% of returns)
This zip code:
$2,064
Massachusetts:
$1,945
(% of AGI for various income ranges: 10.5% for AGIs below $10k, 6.0% for AGIs $10k-25k, 2.9% for AGIs $25k-50k, 2.0% for AGIs $50k-75k, 1.9% for AGIs $75k-100k, 1.5% for AGIs over 100k)
Taxable dividends: $4,106 (reported on 47.5% of returns)
Here:
$4,106
State:
$5,323
(% of AGI for various income ranges: 10.6% for AGIs below $10k, 4.7% for AGIs $10k-25k, 2.0% for AGIs $25k-50k, 2.2% for AGIs $50k-75k, 1.8% for AGIs $75k-100k, 2.6% for AGIs over 100k)
Net capital gain/loss: +$16,584 (reported on 38.8% of returns)
Here:
+$16,584
State:
+$20,377
(% of AGI for various income ranges: -3.0% for AGIs below $10k, 1.4% for AGIs $10k-25k, 0.7% for AGIs $25k-50k, 1.1% for AGIs $50k-75k, 1.6% for AGIs $75k-100k, 12.9% for AGIs over 100k)
Profit/loss from business: +$21,294 (reported on 19.7% of returns)
Here:
+$21,294
State:
+$17,837
(% of AGI for various income ranges: 5.0% for AGIs below $10k, 10.2% for AGIs $10k-25k, 6.9% for AGIs $25k-50k, 5.1% for AGIs $50k-75k, 6.0% for AGIs $75k-100k, 4.9% for AGIs over 100k)
IRA payment deduction: $3,090 (reported on 3.3% of returns)
02476:
$3,090
Massachusetts:
$3,100
(% of AGI for various income ranges: 0.9% for AGIs below $10k, 0.6% for AGIs $10k-25k, 0.3% for AGIs $25k-50k, 0.2% for AGIs $50k-75k, 0.2% for AGIs $75k-100k, 0.1% for AGIs over 100k)
Self-employed pension: $12,331 (reported on 3.6% of returns)
Here:
$12,331
Massachusetts:
$14,516
(% of AGI for various income ranges: 0.4% for AGIs $10k-25k, 0.3% for AGIs $25k-50k, 0.4% for AGIs $50k-75k, 0.6% for AGIs $75k-100k, 0.7% for AGIs over 100k)
Total itemized deductions: $22,677 (19% of AGI, reported on 51.3% of returns)
Here:
$22,677
State:
$22,573
Here:
19.1% of AGI
State:
19.5% of AGI
(% of AGI for various income ranges: 27.4% for AGIs below $10k, 21.7% for AGIs $10k-25k, 13.5% for AGIs $25k-50k, 16.0% for AGIs $50k-75k, 17.6% for AGIs $75k-100k, 14.3% for AGIs over 100k)
Charity contributions deductions: $3,160 (3% of AGI, reported on 47.3% of returns)
Here:
$3,160
State:
$3,295
Here:
2.6% of AGI
State:
2.7% of AGI
(% of AGI for various income ranges: 1.4% for AGIs below $10k, 1.8% for AGIs $10k-25k, 1.2% for AGIs $25k-50k, 1.7% for AGIs $50k-75k, 1.6% for AGIs $75k-100k, 2.2% for AGIs over 100k)
Total tax: $13,559 (reported on 86.3% of returns)
02476:
$13,559
State:
$11,494
(% of AGI for various income ranges: 3.5% for AGIs below $10k, 5.6% for AGIs $10k-25k, 9.5% for AGIs $25k-50k, 11.4% for AGIs $50k-75k, 12.1% for AGIs $75k-100k, 18.1% for AGIs over 100k)
Earned income credit: $856 (reported on 3.6% of returns)
Here:
$856
State:
$1,518
Percentage of individuals using paid preparers for their 2004 taxes: 53.3%
Here:
53%
State:
58%
(% for various income ranges: 46.9% for AGIs below $10k, 56.9% for AGIs $10k-25k, 49.6% for AGIs $25k-50k, 54.2% for AGIs $50k-75k, 54.4% for AGIs $75k-100k, 57.6% for AGIs over 100k)
Likely homosexual households (counted as self-reported same-sex unmarried-partner households)
Lesbian couples: 0.3% of all households
Gay men: 0.0% of all households
Household received Food Stamps/SNAP in the past 12 months: 500 Household did not receive Food Stamps/SNAP in the past 12 months: 7,154
Women who had a birth in the past 12 months: 180 (180 now married, 7 unmarried) Women who did not have a birth in the past 12 months: 3,464 (1,794 now married, 1,636 unmarried)
Housing units in zip code 02476 with a mortgage: 2,872 (489 second mortgage, 14 home equity loan, 377 both second mortgage and home equity loan) Houses without a mortgage: 133
Median monthly owner costs for units with a mortgage: $3,332 Median monthly owner costs for units without a mortgage: $1,244
Residents with income below the poverty level in 2022:
This zip code:
7.1%
Whole state:
10.4%
Residents with income below 50% of the poverty level in 2022:
This zip code:
2.1%
Whole state:
5.1%
Median number of rooms in houses and condos:
Here:
7.0
State:
6.5
Median number of rooms in apartments:
Here:
3.5
State:
4.0
Notable locations in this zip code not listed on our city pages
Notable locations in zip code 02476: Old Schwamb Mill (A), Arlington Fire Department Station 2 (B), Arlington Fire Department Station 3 (C), Arlington Historical Society Building (D), Dallin School Library (E), Arlington Townhall (F), Robbins Library (G), Smith Museum Archives (H). Display/hide their locations on the map
Churches in zip code 02476 include: Saint Paul Lutheran Church (A), Saint Johns Episcopal Church (B), Park Avenue Congregational Church (C), Greek Orthodox Church (D), First Parish Unitarian Church (E), First Baptist Church (F), Baptist Society Meeting House (G), First Baptist Church of Arlington (H). Display/hide their locations on the map
Parks in zip code 02476 include: Warren A Pierce Playground (1), Kensington Park Historic District (2), Arlington center Historic District (3), Pierce Farm Historic District (4), Spy Pond Field (5), Menotomy Rock Park (6). Display/hide their locations on the map
2,839 married couples with children.
429 single-parent households (90 men, 339 women).
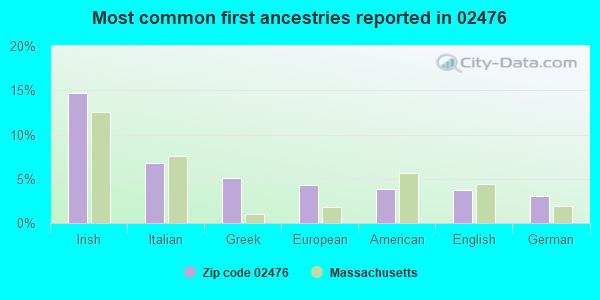
78.8% of residents of 02476 zip code speak English at home.
3.6% of residents speak Spanish at home (83% very well, 10% well, 3% not well, 4% not at all).
9.1% of residents speak other Indo-European language at home (68% very well, 24% well, 7% not well, 1% not at all).
7.7% of residents speak Asian or Pacific Island language at home (67% very well, 18% well, 10% not well, 5% not at all).
0.7% of residents speak other language at home (100% very well).
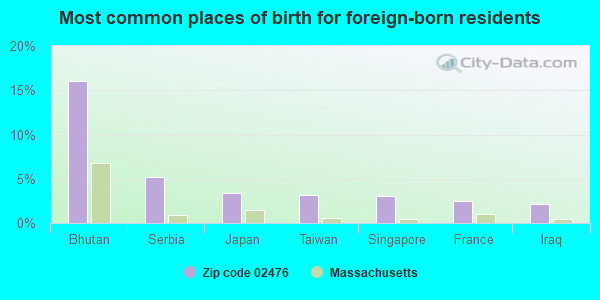
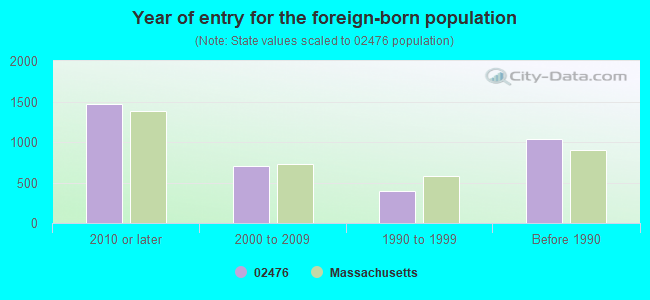
Foreign born population: 3,318 (18.7%) (57.3% of them are naturalized citizens)
Major facilities with environmental interests located in this zip code:
ALPHA AUTO BODY (30 PARK AVE in ARLINGTON, MA)
AIR MINOR (AIRS/AFS) CRITERIA AND HAZARDOUS AIR POLLUTANT INVENTORY (Inventory of air pollution sources) Conditionally Exempt Small Quantity Generators, less than 100 kg/month of hazardous waste (Resource Conservation and Recovery Act (tracking hazardous waste)) - notification Organizations: ALPHA AUTO BODY INC (CONTACT/OWNER)
ARLINGTON HIGH (869 MASS AVENUE in ARLINGTON, MA)
(National Center for Education Statistics) - STATE ID-010505
MENOTOMY PRESCHOOL (869 MASSACHUSETTS AVENUE in ARLINGTON, MA)
(National Center for Education Statistics) - STATE ID-010038 Organizations: ARLINGTON (SCHOOL DISTRICT)
OTTOSON MIDDLE (63 ACTON STREET in ARLINGTON, MA)
(National Center for Education Statistics) - STATE ID-010410 Organizations: ARLINGTON (SCHOOL DISTRICT)
ARLINGTON DPW (51 GROVE ST in ARLINGTON, MA)
(Integrated Compliance Information System) - ICIS-01-1997-0105, FORMAL ENFORCEMENT ACTION
LYONS FUEL INC (6 DUDLEY ST in ARLINGTON, MA)
(Integrated Compliance Information System) - ICIS-01-1997-0035, FORMAL ENFORCEMENT ACTION, ICIS-01-1996-0054,
MIRAK LINCOLN MERCURY NISSAN I (956 MASSACHUSETTS AVE in ARLINGTON, MA)
(Resource Conservation and Recovery Act (tracking hazardous waste)) Business NAICS classification: GENERAL AUTOMOTIVE REPAIR. Organizations: MIRAK LINCOLN-MERCURY NISSAN INC (CONTACT/OWNER)
Alternative names: MIRAK LINCOLN MERCURY NISSAN INC
ARLINGTON GRAPHICS INC (1050 MASSACHUSETTS AVE in ARLINGTON, MA)
(Resource Conservation and Recovery Act (tracking hazardous waste))
MENOTOMY DENTAL LAB (691 MASSACHUSETTS AVE in ARLINGTON, MA)
(Resource Conservation and Recovery Act (tracking hazardous waste))
DUDLEY AUTOMOTIVE SERVICE INC (9 DUDLEY ST PL in ARLINGTON, MA)
(Resource Conservation and Recovery Act (tracking hazardous waste)) Organizations: NIGRO SAMUEL J (CONTACT/OWNER)
DUDLEY ST AUTO BODY (34R DUDLEY ST in ARLINGTON, MA)
(Resource Conservation and Recovery Act (tracking hazardous waste))
A & M AUTO BODY (24R MILL LN in ARLINGTON, MA)
(Resource Conservation and Recovery Act (tracking hazardous waste))
ARLINGTON SCHOOL DEP (23 MAPLE STREET in ARLINGTON, MA)
AIR MINOR (AIRS/AFS) Business SIC classification: ELEMENTARY AND SECONDARY SCHOOLS
Housing units lacking complete kitchen facilities: 0.5%
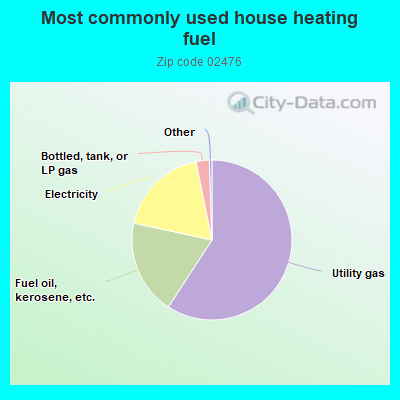
59.2%Utility gas
19.2%Fuel oil, kerosene, etc.
18.4%Electricity
2.7%Bottled, tank, or LP gas
Place of birth for U.S.-born residents:
This state: 8,650
Northeast: 2,712
Midwest: 1,131
South: 1,087
West: 632
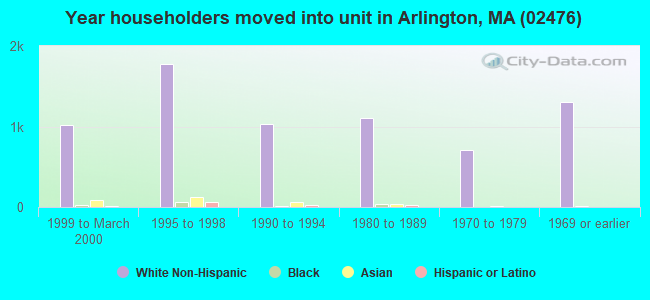
64% of the 02476 zip code residents lived in the same house 5 years ago. Out of people who lived in different houses, 67% lived in this county. Out of people who lived in different counties, 50% lived in Massachusetts.
90% of the 02476 zip code residents lived in the same house 1 year ago. Out of people who lived in different houses, 51% moved from this county. Out of people who lived in different houses, 16% moved from different county within same state. Out of people who lived in different houses, 13% moved from different state. Out of people who lived in different houses, 21% moved from abroad.
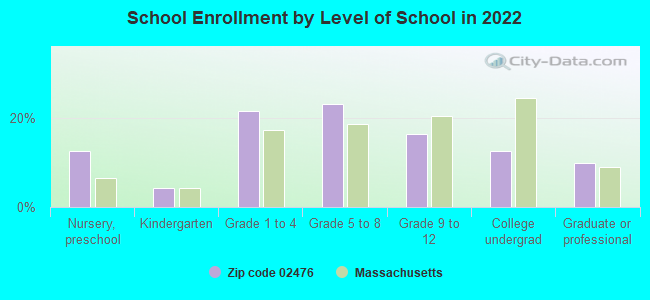
Private vs. public school enrollment:
Students in private schools in grades 1 to 8 (elementary and middle school): 606
Here:
32.6%
Massachusetts:
10.3%
Students in private schools in grades 9 to 12 (high school): 63
Here:
9.4%
Massachusetts:
12.3%
Students in private undergraduate colleges: 238
Here:
46.1%
Massachusetts:
51.2%
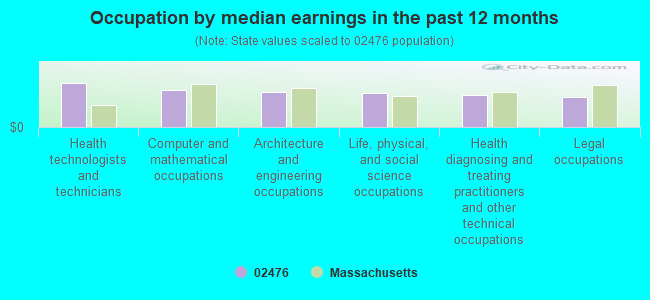
Occupation by median earnings in the past 12 months ($)
160,708Health technologists and technicians
136,101Computer and mathematical occupations
127,255Architecture and engineering occupations
122,872Life, physical, and social science occupations
118,261Health diagnosing and treating practitioners and other technical occupations
109,994Legal occupations
Companies with federal contracts located in this zip code (ARLINGTON, MA):
ARMSTRONG AMBULANCE SERVICE, I (12 BRATTLE CT) : $1,531,981 in 4 contractsfrom 2003 to 2005
$525,343 with Air Force for Other Medical Services. Signed on 2004-09-17. Completion date: 2005-09-16.
$506,313, same as above.Signed on 2005-09-09. Completion date: 2006-09-16.
$500,325, same as above.Signed on 2003-09-05. Completion date: 2004-09-16.
$0, same as above.Signed on 2003-09-05. Completion date: 2004-09-16.
PRO DISPLAYS NORTHEAST INC (8 BECK RD; small business) : $297,811 in 15 contractsfrom 2000 to 2005
Contracts for Maintenance, Repair or Alteration of Real Property -- Conference Space and Facilities, Miscellaneous Furniture and Fixtures, Office Furniture, Other Professional Services, and moreby Army, U.S. Fish and Wildlife Service Signed by year:2000: $67,525; 2001: $37,982; 2002: $0; 2003: $0; 2004: $45,495; 2005: $146,809; 2006: $0.
Biggest contracts:
$82,389 with Army for Maintenance, Repair or Alteration of Real Property -- Conference Space and Facilities. Signed on 2005-09-19. Completion date: 2005-12-05.
$39,150 with Army for Miscellaneous Furniture and Fixtures. Signed on 2000-08-22. Completion date: 2000-08-30.
$37,982 with Army for Office Furniture. Signed on 2001-04-12. Completion date: 2001-04-16.
$28,375 with Army for Other Professional Services. Signed on 2000-09-28. Completion date: 2000-09-30.
OSMUN MUSIC, INC (5 FOREST ST; small business) : $73,660 in 5 contractsfrom 2003 to 2005
Contracts for Musical Instruments, Ship and Boat Propulsion Components, Musical Instrument Parts and Accessories by Air Force, Navy, Army Signed by year:2000: $0; 2001: $0; 2002: $0; 2003: $33,630; 2004: $12,260; 2005: $27,770; 2006: $0.
Biggest contracts:
$27,790 with Air Force for Musical Instruments. Signed on 2003-08-21. Completion date: 2003-08-21.
$17,875 with Navy for Ship and Boat Propulsion Components. Taking place in VA. Signed on 2005-08-02. Completion date: 2007-08-30.
$12,260 with Army for Musical Instruments. Taking place in MD. Signed on 2004-07-14. Completion date: 2004-10-01.
$9,895 with Air Force for Musical Instrument Parts and Accessories. Signed on 2005-09-19. Completion date: 2006-05-17.
PRESENTATION GRAPHICS, INC (1165 MASSACHUSETTS AVE; small business) : $12,164 in 5 contractsfrom 2002 to 2003
Contracts for Arts/Graphics Services by U.S. Army Corps of Engineers - civil program financing only Signed by year:2000: $0; 2001: $0; 2002: $10,831; 2003: $1,333; 2004: $0; 2005: $0; 2006: $0.
Biggest contracts:
$9,200 with U.S. Army Corps of Engineers - civil program financing only for Arts/Graphics Services. Signed on 2002-09-26. Completion date: 2002-09-30.
$1,598, same as above.Signed on 2002-09-23. Completion date: 2002-09-20.
$917, same as above.Signed on 2003-01-28. Completion date: 2003-01-24.
$416, same as above.Signed on 2003-03-12. Completion date: 2003-03-04.
Top industries in this zip code by the number of employees in 2005:
2002 - 2015 National Fire Incident Reporting System (NFIRS) incidents
According to the data from the years 2002 - 2015 the average number of fire incidents per year is 16. The highest number of reported fires - 49 took place in 2005, and the least - 0 in 2011. The data has a declining trend.
When looking into fire subcategories, the most incidents belonged to: Structure Fires (53.2%), and Outside Fires (25.9%).
Fire incident types reported to NFIRS in Zip Code 02476


 Nearest zip codes: 02474, 02478, 02472, 02140, 01890, 02452.


 According to the data from the years 2002 - 2015 the average number of fire incidents per year is 16. The highest number of reported fires - 49 took place in 2005, and the least - 0 in 2011. The data has a declining trend.
 When looking into fire subcategories, the most incidents belonged to: Structure Fires (53.2%), and Outside Fires (25.9%).