Estimated zip code population in 2022: 21,185 Zip code population in 2010: 19,931 Zip code population in 2000: 19,917
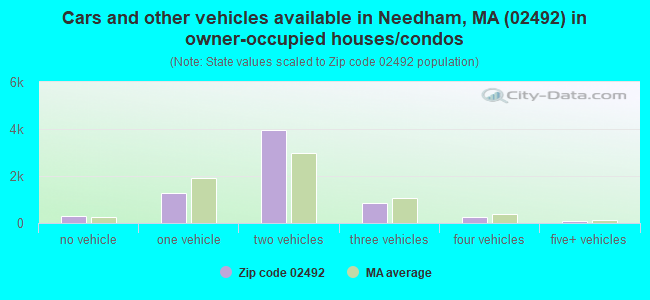
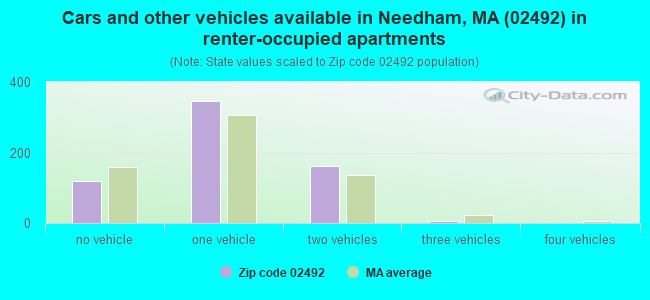
Houses and condos: 7,486 Renter-occupied apartments: 629
% of renters here:
9%
State:
38%
March 2022 cost of living index in zip code 02492: 136.8 (high, U.S. average is 100)
Land area: 9.5 sq. mi. Water area: 0.4 sq. mi.
Population density: 2,224 people per square mile
(low).
OSM Map
Google Map
MSN Map
OSM Map
General Map
Google Map
MSN Map
OSM Map
Google Map
MSN Map
OSM Map
Google Map
MSN Map
Please wait while loading the map...
Real estate property taxes paid for housing units in 2022:
This zip code:
0.8% ($9,915)
Massachusetts:
1.0% ($5,536)
Median real estate property taxes paid for housing units with mortgages in 2022: $9,911 (0.7%) Median real estate property taxes paid for housing units with no mortgage in 2022: $9,925 (0.9%)
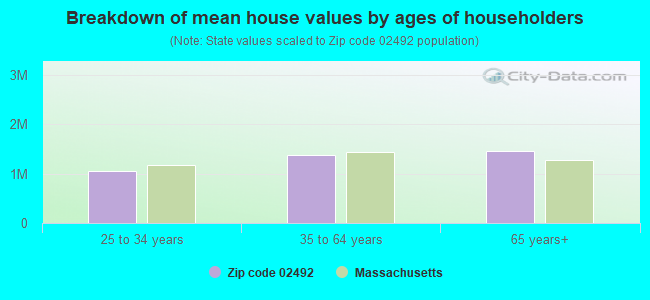
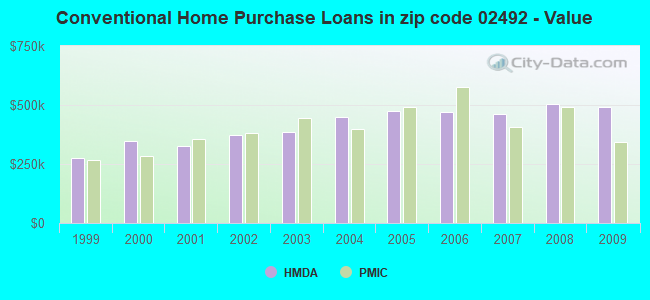
Estimated median house/condo value in 2022: $1,239,788
02492:
$1,239,788
Massachusetts:
$534,700
According to our research of Massachusetts and other state lists, there was 1 registered sex offender living in 02492 zip code as of April 26, 2024. The ratio of all residents to sex offenders in zip code 02492 is 20,474 to 1. The ratio of registered sex offenders to all residents in this zip code is much lower than the state average.
Median resident age:
This zip code:
43.1 years
Massachusetts median age:
40.3 years
Average household size:
This zip code:
2.8 people
Massachusetts:
2.4 people
Averages for the 2020 tax year for zip code 02492, filed in 2021:
Average Adjusted Gross Income (AGI) in 2020: $337,718 (Individual Income Tax Returns)
Here:
$337,718
State:
$105,130
Salary/wage: $239,593 (reported on 77.7% of returns)
Here:
$239,593
State:
$82,951
(% of AGI for various income ranges: 1318.2% for AGIs below $25k, 3700.8% for AGIs $25k-50k, 6211.5% for AGIs $50k-75k, 8111.8% for AGIs $75k-100k, 19546.2% for AGIs $100k-200k, 161903.5% for AGIs over 200k)
Taxable interest for individuals: $7,532 (reported on 67.6% of returns)
This zip code:
$7,532
Massachusetts:
$2,361
(% of AGI for various income ranges: 61.0% for AGIs below $25k, 113.1% for AGIs $25k-50k, 171.3% for AGIs $50k-75k, 242.1% for AGIs $75k-100k, 481.8% for AGIs $100k-200k, 4425.8% for AGIs over 200k)
Ordinary dividends: $20,151 (reported on 63.0% of returns)
Here:
$20,151
State:
$10,365
(% of AGI for various income ranges: 173.6% for AGIs below $25k, 325.8% for AGIs $25k-50k, 676.9% for AGIs $50k-75k, 1129.7% for AGIs $75k-100k, 2042.9% for AGIs $100k-200k, 10138.7% for AGIs over 200k)
Net capital gain/loss in AGI: +$112,348 (reported on 58.2% of returns)
Here:
+$112,348
State:
+$48,178
(% of AGI for various income ranges: 113.0% for AGIs below $25k, 339.8% for AGIs $25k-50k, 321.8% for AGIs $50k-75k, 729.7% for AGIs $75k-100k, 1777.5% for AGIs $100k-200k, 62488.8% for AGIs over 200k)
Profit/loss from business: +$51,718 (reported on 20.8% of returns)
Here:
+$51,718
State:
+$20,792
(% of AGI for various income ranges: 99.8% for AGIs below $25k, 348.5% for AGIs $25k-50k, 531.8% for AGIs $50k-75k, 659.7% for AGIs $75k-100k, 1778.4% for AGIs $100k-200k, 8696.2% for AGIs over 200k)
Taxable individual retirement arrangement distribution: $36,040 (reported on 15.8% of returns)
02492:
$36,040
Massachusetts:
$22,790
(% of AGI for various income ranges: 91.5% for AGIs below $25k, 251.9% for AGIs $25k-50k, 574.1% for AGIs $50k-75k, 1101.5% for AGIs $75k-100k, 2364.6% for AGIs $100k-200k, 3185.4% for AGIs over 200k)
Self-employed (Keogh) retirement plans: $35,007 (reported on 5.9% of returns)
02492:
$35,007
Massachusetts:
$26,868
(% of AGI for various income ranges: 43.3% for AGIs $25k-50k, 205.6% for AGIs $100k-200k, 1888.7% for AGIs over 200k)
Total itemized deductions: $50,550 (reported on 37.4% of returns)
Here:
$50,550
State:
$36,722
(% of AGI for various income ranges: 330.9% for AGIs below $25k, 935.0% for AGIs $25k-50k, 1120.5% for AGIs $50k-75k, 1654.8% for AGIs $75k-100k, 3197.8% for AGIs $100k-200k, 14700.1% for AGIs over 200k)
Charity contributions: $18,474 (reported on 32.9% of returns)
Here:
$18,474
State:
$12,529
(% of AGI for various income ranges: 9.7% for AGIs below $25k, 46.7% for AGIs $25k-50k, 87.4% for AGIs $50k-75k, 183.9% for AGIs $75k-100k, 419.6% for AGIs $100k-200k, 5575.1% for AGIs over 200k)
Taxes paid: $9,582 (reported on 37.3% of returns)
02492:
$9,582
State:
$8,782
(% of AGI for various income ranges: 64.0% for AGIs below $25k, 156.7% for AGIs $25k-50k, 280.8% for AGIs $50k-75k, 437.3% for AGIs $75k-100k, 758.7% for AGIs $100k-200k, 2612.7% for AGIs over 200k)
Earned income credit: $1,325 (reported on 2.1% of returns)
Here:
$1,325
State:
$1,909
(% of AGI for various income ranges: 18.4% for AGIs below $25k, 21.5% for AGIs $25k-50k)
Percentage of individuals using paid preparers for their 2020 taxes: 91.9%
Here:
92%
State:
92%
(% for various income ranges: 91.5% for AGIs below $25k, 89.2% for AGIs $25k-50k, 88.9% for AGIs $50k-75k, 91.7% for AGIs $75k-100k, 90.3% for AGIs $100k-200k, 93.9% for AGIs over 200k)
Averages for the 2012 tax year for zip code 02492, filed in 2013:
Average Adjusted Gross Income (AGI) in 2012: $237,255 (Individual Income Tax Returns)
Here:
$237,255
State:
$81,425
Salary/wage: $163,954 (reported on 79.0% of returns)
Here:
$163,954
State:
$64,752
(% of AGI for various income ranges: 65.7% for AGIs below $25k, 62.5% for AGIs $25k-50k, 53.5% for AGIs $50k-75k, 54.3% for AGIs $75k-100k, 67.3% for AGIs $100k-200k, 52.4% for AGIs over 200k)
Taxable interest for individuals: $5,354 (reported on 69.0% of returns)
This zip code:
$5,354
Massachusetts:
$2,136
(% of AGI for various income ranges: 3.1% for AGIs below $25k, 2.1% for AGIs $25k-50k, 2.1% for AGIs $50k-75k, 2.0% for AGIs $75k-100k, 1.4% for AGIs $100k-200k, 1.5% for AGIs over 200k)
Ordinary dividends: $17,187 (reported on 59.7% of returns)
Here:
$17,187
State:
$9,473
(% of AGI for various income ranges: 9.1% for AGIs below $25k, 5.9% for AGIs $25k-50k, 5.9% for AGIs $50k-75k, 5.9% for AGIs $75k-100k, 4.0% for AGIs $100k-200k, 4.2% for AGIs over 200k)
Net capital gain/loss in AGI: +$66,301 (reported on 52.2% of returns)
Here:
+$66,301
State:
+$31,437
(% of AGI for various income ranges: 1.7% for AGIs below $25k, 1.0% for AGIs $25k-50k, 2.4% for AGIs $50k-75k, 1.6% for AGIs $75k-100k, 2.7% for AGIs $100k-200k, 17.6% for AGIs over 200k)
Profit/loss from business: +$45,394 (reported on 20.3% of returns)
Here:
+$45,394
State:
+$20,662
(% of AGI for various income ranges: 7.1% for AGIs below $25k, 7.2% for AGIs $25k-50k, 5.4% for AGIs $50k-75k, 6.1% for AGIs $75k-100k, 6.1% for AGIs $100k-200k, 3.3% for AGIs over 200k)
Taxable individual retirement arrangement distribution: $30,646 (reported on 18.1% of returns)
02492:
$30,646
Massachusetts:
$18,892
(% of AGI for various income ranges: 5.4% for AGIs below $25k, 4.8% for AGIs $25k-50k, 6.0% for AGIs $50k-75k, 6.2% for AGIs $75k-100k, 4.6% for AGIs $100k-200k, 1.7% for AGIs over 200k)
Self-employment retirement plans: $25,683 (reported on 5.8% of returns)
02492:
$25,683
Massachusetts:
$20,669
(% of AGI for various income ranges: 0.6% for AGIs $25k-50k, 0.4% for AGIs $75k-100k, 0.7% for AGIs $100k-200k, 0.7% for AGIs over 200k)
Total itemized deductions: $52,542 (15% of AGI, reported on 65.7% of returns)
Here:
$52,542
State:
$28,907
Here:
15.2% of AGI
State:
18.2% of AGI
(% of AGI for various income ranges: 28.5% for AGIs below $25k, 23.9% for AGIs $25k-50k, 23.0% for AGIs $50k-75k, 21.9% for AGIs $75k-100k, 20.5% for AGIs $100k-200k, 12.8% for AGIs over 200k)
Charity contributions: $9,969 (reported on 59.9% of returns)
Here:
$9,969
State:
$4,208
(% of AGI for various income ranges: 1.3% for AGIs below $25k, 1.5% for AGIs $25k-50k, 1.8% for AGIs $50k-75k, 2.0% for AGIs $75k-100k, 1.9% for AGIs $100k-200k, 2.7% for AGIs over 200k)
Taxes paid: $26,743 (reported on 65.6% of returns)
02492:
$26,743
State:
$13,303
(% of AGI for various income ranges: 8.4% for AGIs below $25k, 7.6% for AGIs $25k-50k, 9.3% for AGIs $50k-75k, 9.2% for AGIs $75k-100k, 9.5% for AGIs $100k-200k, 6.9% for AGIs over 200k)
Earned income credit: $1,432 (reported on 2.7% of returns)
Here:
$1,432
State:
$1,971
(% of AGI for various income ranges: 1.4% for AGIs below $25k, 0.2% for AGIs $25k-50k)
Percentage of individuals using paid preparers for their 2012 taxes: 61.5%
Here:
61%
State:
56%
(% for various income ranges: 54.1% for AGIs below $25k, 54.7% for AGIs $25k-50k, 63.3% for AGIs $50k-75k, 63.4% for AGIs $75k-100k, 59.6% for AGIs $100k-200k, 70.6% for AGIs over 200k)
Averages for the 2004 tax year for zip code 02492, filed in 2005:
Average Adjusted Gross Income (AGI) in 2004: $136,990 (Individual Income Tax Returns)
Here:
$136,990
State:
$62,877
Salary/wage: $113,408 (reported on 75.0% of returns)
Here:
$113,408
State:
$52,969
(% of AGI for various income ranges: 128.4% for AGIs below $10k, 52.4% for AGIs $10k-25k, 63.0% for AGIs $25k-50k, 54.4% for AGIs $50k-75k, 66.5% for AGIs $75k-100k, 62.0% for AGIs over 100k)
Taxable interest for individuals: $3,359 (reported on 77.1% of returns)
This zip code:
$3,359
Massachusetts:
$1,945
(% of AGI for various income ranges: 17.7% for AGIs below $10k, 7.4% for AGIs $10k-25k, 3.6% for AGIs $25k-50k, 3.5% for AGIs $50k-75k, 2.2% for AGIs $75k-100k, 1.6% for AGIs over 100k)
Taxable dividends: $8,462 (reported on 62.1% of returns)
Here:
$8,462
State:
$5,323
(% of AGI for various income ranges: 21.4% for AGIs below $10k, 7.6% for AGIs $10k-25k, 5.3% for AGIs $25k-50k, 5.9% for AGIs $50k-75k, 3.9% for AGIs $75k-100k, 3.5% for AGIs over 100k)
Net capital gain/loss: +$32,930 (reported on 54.0% of returns)
Here:
+$32,930
State:
+$20,377
(% of AGI for various income ranges: -10.4% for AGIs below $10k, 3.4% for AGIs $10k-25k, 1.7% for AGIs $25k-50k, 3.0% for AGIs $50k-75k, 2.4% for AGIs $75k-100k, 14.8% for AGIs over 100k)
Profit/loss from business: +$35,371 (reported on 19.6% of returns)
Here:
+$35,371
State:
+$17,837
(% of AGI for various income ranges: 1.8% for AGIs below $10k, 7.5% for AGIs $10k-25k, 5.9% for AGIs $25k-50k, 8.5% for AGIs $50k-75k, 8.0% for AGIs $75k-100k, 4.7% for AGIs over 100k)
IRA payment deduction: $3,301 (reported on 3.5% of returns)
02492:
$3,301
Massachusetts:
$3,100
(% of AGI for various income ranges: 0.8% for AGIs below $10k, 0.4% for AGIs $10k-25k, 0.4% for AGIs $25k-50k, 0.3% for AGIs $50k-75k, 0.2% for AGIs $75k-100k, 0.0% for AGIs over 100k)
Self-employed pension: $17,450 (reported on 6.0% of returns)
Here:
$17,450
Massachusetts:
$14,516
(% of AGI for various income ranges: 0.4% for AGIs $10k-25k, 0.4% for AGIs $25k-50k, 0.6% for AGIs $50k-75k, 0.7% for AGIs $75k-100k, 0.8% for AGIs over 100k)
Total itemized deductions: $34,638 (16% of AGI, reported on 58.8% of returns)
Here:
$34,638
State:
$22,573
Here:
16.0% of AGI
State:
19.5% of AGI
(% of AGI for various income ranges: 48.0% for AGIs below $10k, 28.4% for AGIs $10k-25k, 22.0% for AGIs $25k-50k, 23.7% for AGIs $50k-75k, 23.5% for AGIs $75k-100k, 13.3% for AGIs over 100k)
Charity contributions deductions: $5,378 (2% of AGI, reported on 55.5% of returns)
Here:
$5,378
State:
$3,295
Here:
2.4% of AGI
State:
2.7% of AGI
(% of AGI for various income ranges: 1.3% for AGIs below $10k, 1.8% for AGIs $10k-25k, 1.7% for AGIs $25k-50k, 2.3% for AGIs $50k-75k, 2.3% for AGIs $75k-100k, 2.2% for AGIs over 100k)
Total tax: $33,399 (reported on 81.8% of returns)
02492:
$33,399
State:
$11,494
(% of AGI for various income ranges: 4.7% for AGIs below $10k, 5.3% for AGIs $10k-25k, 8.3% for AGIs $25k-50k, 10.0% for AGIs $50k-75k, 10.6% for AGIs $75k-100k, 21.8% for AGIs over 100k)
Earned income credit: $1,139 (reported on 2.2% of returns)
Here:
$1,139
State:
$1,518
Percentage of individuals using paid preparers for their 2004 taxes: 62.3%
Here:
62%
State:
58%
(% for various income ranges: 56.2% for AGIs below $10k, 57.7% for AGIs $10k-25k, 58.9% for AGIs $25k-50k, 68.4% for AGIs $50k-75k, 66.8% for AGIs $75k-100k, 66.2% for AGIs over 100k)
Household received Food Stamps/SNAP in the past 12 months: 180 Household did not receive Food Stamps/SNAP in the past 12 months: 6,993
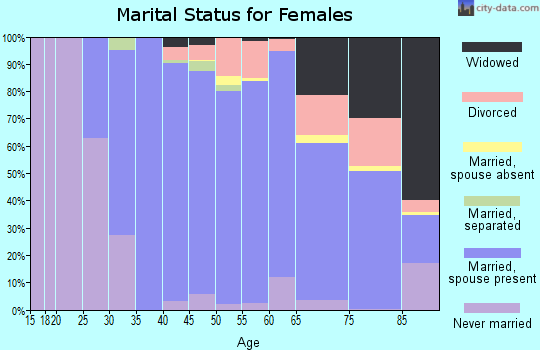
Women who had a birth in the past 12 months: 133 (140 now married, 0 unmarried) Women who did not have a birth in the past 12 months: 4,087 (2,213 now married, 1,828 unmarried)
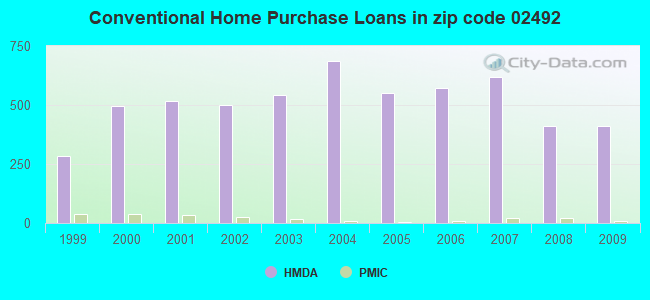
Housing units in zip code 02492 with a mortgage: 4,346 (872 second mortgage, 15 home equity loan, 840 both second mortgage and home equity loan) Houses without a mortgage: 246
Median monthly owner costs for units with a mortgage: $3,900 Median monthly owner costs for units without a mortgage: $1,503
Residents with income below the poverty level in 2022:
This zip code:
3.3%
Whole state:
10.4%
Residents with income below 50% of the poverty level in 2022:
This zip code:
0.8%
Whole state:
5.1%
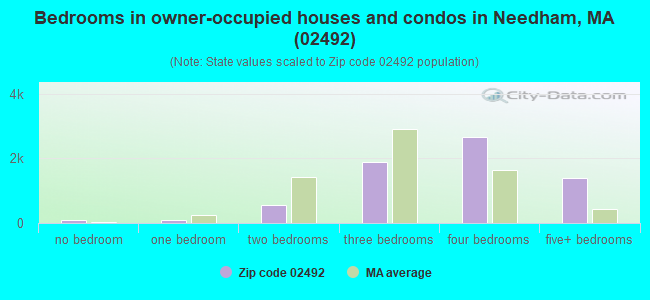
Median number of rooms in houses and condos:
Here:
8.3
State:
6.5
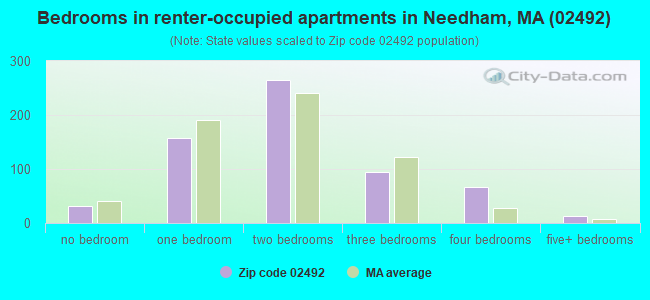
Median number of rooms in apartments:
Here:
4.1
State:
4.0
Notable locations in this zip code not listed on our city pages
Notable locations in zip code 02492: Needham Center Station (A), Needham Junction Station (B), Hersey Station (C), Needham Disposal Area (D), Needham Golf Course (E), Broadmeadow Elementary School Library (F), Newman Elementary School Library (G), Needham Historical Society Library (H), Needham Fire Department Station 1 Headquarters (I), Glover Memorial Hospital Medical Library (J), Needham Townhall (K), Needham Free Public Library (L). Display/hide their locations on the map
Churches in zip code 02492 include: Unitarian First Parish Church (A), Saint Bartholomew Church (B), Needham Congregational Church (C), Grace Lutheran Church (D), Good Shepherd Christian Church (E), First Church of Christ (F), First Baptist Church (G), Cornerstone Assembly of God Church (H). Display/hide their locations on the map
Parks in zip code 02492 include: Cutler Park (1), McIntosh Corner Historic District (2), Memorial Park (3), Claxton Field (4), DeFazio Park (5), Needham Town Hall Historic District (6). Display/hide their locations on the map
In group quarters: 547 (-1 institutionalized population)
Size of family households: 2,321 2-persons, 872 3-persons, 1,949 4-persons, 607 5-persons, 96 6-persons, 60 7-or-more-persons
Size of nonfamily households: 1,124 1-person, 229 2-persons, 4 3-persons
5,223 married couples with children.
588 single-parent households (65 men, 523 women).
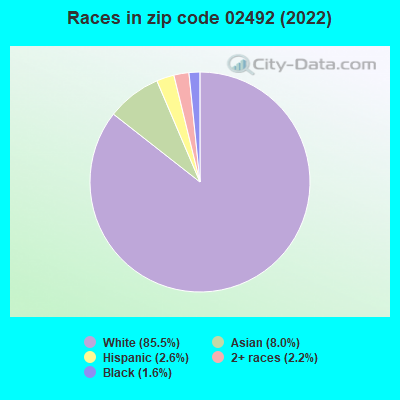
85.1% of residents of 02492 zip code speak English at home.
1.8% of residents speak Spanish at home (86% very well, 13% well, 1% not at all).
7.7% of residents speak other Indo-European language at home (76% very well, 13% well, 6% not well, 4% not at all).
3.3% of residents speak Asian or Pacific Island language at home (77% very well, 16% well, 4% not well, 3% not at all).
1.6% of residents speak other language at home (70% very well, 30% well).
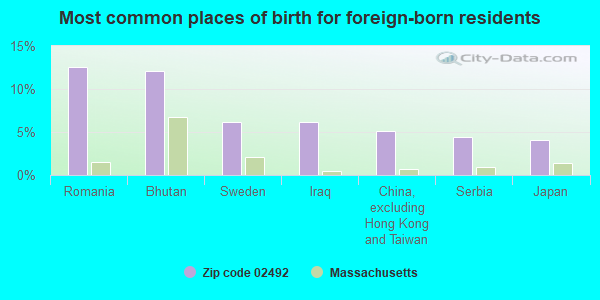
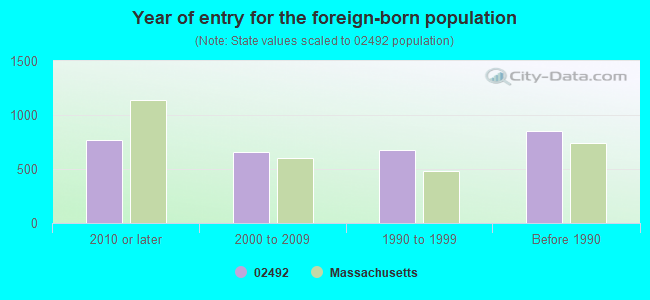
Foreign born population: 2,720 (12.8%) (70.7% of them are naturalized citizens)
Major facilities with environmental interests located in this zip code:
NEEDHAM - SEWER REHAB 1,3,4 II (470 DEDHAM AVENUE in NEEDHAM, MA)
ENFORCEMENT/COMPLIANCE ACTIVITY (Integrated Compliance Information System) - ICIS-01-2003-9048, FORMAL ENFORCEMENT ACTION (Integrated Compliance Information System) - ICIS-01-2003-9048, FORMAL ENFORCEMENT ACTION National Pollutant Discharge Elimination System NON-MAJOR (Tracking pollutant discharge elimination systems) - permit Business SIC classification: WATER, SEWER, PIPELINE, AND COMMUNICATIONS AND POWER LINE CONSTRUCTION Alternative names: NEEDHAM MA DPW COMPLEX, REVOLI CONSTRUCTION CO INC
NEEDHAM RECYCLING & TRANSFER STATION (1421 CENTRAL AVE in NEEDHAM, MA)
ENFORCEMENT/COMPLIANCE ACTIVITY (Integrated Compliance Information System) - ICIS-01-2003-9048, FORMAL ENFORCEMENT ACTION (Integrated Compliance Information System) - ICIS-01-2003-9048, FORMAL ENFORCEMENT ACTION Small Quantity Generators, between 100 kg and 1000 kg of hazardous waste/month (Resource Conservation and Recovery Act (tracking hazardous waste)) - notification Organizations: NEEDHAM DEPARTMENT OF PUBLIC WORKS (CONTACT/OPERATOR)
, TOWN OF NEEDHAM (CONTACT/OWNER)
Alternative names: NEEDHAM D P W
LYNWOOD LABORATORIES INC (945 GREAT PLAIN AVE in NEEDHAM, MA)
(Integrated Compliance Information System) - ICIS-01-1995-0023, FORMAL ENFORCEMENT ACTION STATE MASTER (New Jersey environmental info) - NJEMS-000850, PESTICIDES - MANUFACTURE Business SIC classification: PESTICIDES AND AGRICULTURAL CHEMICALS
NEEDHAM TOWN OF (1471 HIGHLAND AVE in NEEDHAM, MA)
AIR MINOR (AIRS/AFS) (Integrated Compliance Information System) - ICIS-01-1996-0085, FORMAL ENFORCEMENT ACTION CRITERIA AND HAZARDOUS AIR POLLUTANT INVENTORY (Inventory of air pollution sources) Business SIC classification: GENERAL GOVERNMENT Alternative names: NEEDHAM TOWN HALL
BROADMEADOW SCHOOL (120 BROADMEADOW ST. in NEEDHAM, MA)
COMPLIANCE ACTIVITY (Tracking inspections of insecticide, fungicide, and rodenticide, and toxic substances) (National Center for Education Statistics) - STATE ID-199005 Organizations: NEEDHAM (SCHOOL DISTRICT)
NEWMAN ELEM (1155 CENTRAL AVENUE in NEEDHAM, MA)
(National Center for Education Statistics) - STATE ID-199050 Organizations: NEEDHAM (SCHOOL DISTRICT)
NEWMAN BUILDING (1155 CENTRAL AVE. in NEEDHAM, MA)
AIR MINOR (AIRS/AFS) COMPLIANCE ACTIVITY (Tracking inspections of insecticide, fungicide, and rodenticide, and toxic substances) CRITERIA AND HAZARDOUS AIR POLLUTANT INVENTORY (Inventory of air pollution sources) Business SIC classification: ELEMENTARY AND SECONDARY SCHOOLS Alternative names: NEWMAN SCHOOL
NYNEX (66 PICKERING ST in NEEDHAM, MA)
(Resource Conservation and Recovery Act (tracking hazardous waste))
ARBUCKLE G T INC (397 GREAT PLAIN AVE in NEEDHAM, MA)
(Resource Conservation and Recovery Act (tracking hazardous waste)) Organizations: ARBUCKLE G. THOMAS (CONTACT/OWNER)
JENSONS CLEANERS (37 CHAPEL ST in NEEDHAM, MA)
Small Quantity Generators, between 100 kg and 1000 kg of hazardous waste/month (Resource Conservation and Recovery Act (tracking hazardous waste)) - notification Organizations: L PETRINI & SON CORP (CONTACT/OWNER)
, PAUL LEONELLI (CONTACT/OWNER)
KENS AUTO BODY INC (20 CLYDE ST in NEEDHAM, MA)
(Resource Conservation and Recovery Act (tracking hazardous waste)) Organizations: MCNAIR KEN (CONTACT/OWNER)
KIS COLOR SYSTEMS INC (20 PICKERING ST 3RD FLR in NEEDHAM, MA)
(Resource Conservation and Recovery Act (tracking hazardous waste))
LOWDEN INC (433 CHESTNUT ST in NEEDHAM, MA)
(Resource Conservation and Recovery Act (tracking hazardous waste)) Organizations: CROW WILLIAM (CONTACT/OWNER)
Housing units lacking complete plumbing facilities: 1.5% Housing units lacking complete kitchen facilities: 0.7%
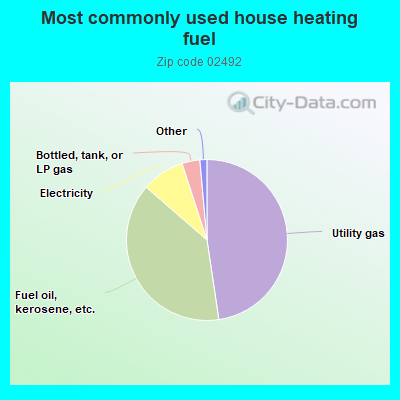
47.6%Utility gas
38.7%Fuel oil, kerosene, etc.
8.6%Electricity
3.6%Bottled, tank, or LP gas
0.6%Other fuel
0.5%No fuel used
Place of birth for U.S.-born residents:
This state: 11,994
Northeast: 3,328
Midwest: 1,196
South: 1,095
West: 556
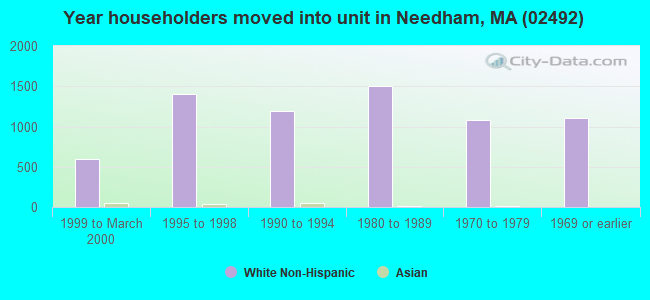
74% of the 02492 zip code residents lived in the same house 5 years ago. Out of people who lived in different houses, 43% lived in this county. Out of people who lived in different counties, 50% lived in Massachusetts.
94% of the 02492 zip code residents lived in the same house 1 year ago. Out of people who lived in different houses, 30% moved from this county. Out of people who lived in different houses, 41% moved from different county within same state. Out of people who lived in different houses, 28% moved from different state. Out of people who lived in different houses, 5% moved from abroad.
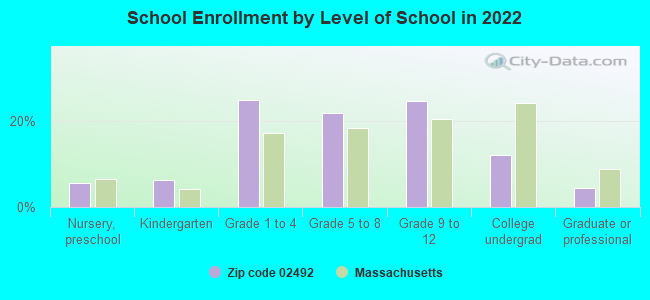
Private vs. public school enrollment:
Students in private schools in grades 1 to 8 (elementary and middle school): 292
Here:
9.7%
Massachusetts:
10.3%
Students in private schools in grades 9 to 12 (high school): 396
Here:
24.8%
Massachusetts:
12.3%
Students in private undergraduate colleges: 598
Here:
74.8%
Massachusetts:
51.2%
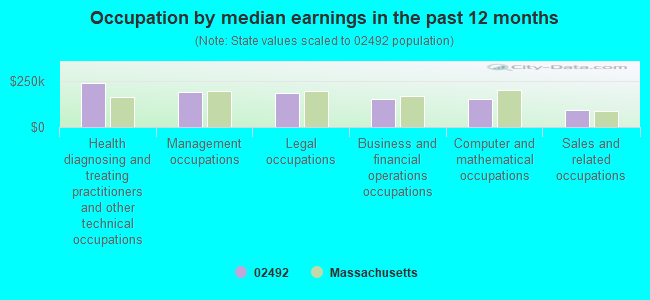
Occupation by median earnings in the past 12 months ($)
237,902Health diagnosing and treating practitioners and other technical occupations
186,959Management occupations
183,143Legal occupations
152,197Business and financial operations occupations
149,289Computer and mathematical occupations
92,335Sales and related occupations
Companies with federal contracts located in this zip code (NEEDHAM, MA):
R P U TECHNOLOGY (173 DEDHAM AVE; small business) : $553,405 in 3 contractsfrom 2004 to 2006
$374,784 with Army for Other Defense -- Applied Research and Exploratory Development (R&D). Signed on 2006-04-12. Completion date: 2008-06-30.
$98,684, same as above.Signed on 2004-11-09. Completion date: 2005-07-18.
$79,937 with Navy for Defense Electronics and Communication Equipment -- Basic Research (R&D). Signed on 2004-10-22. Completion date: 2005-04-30.
SYSTEMS ANALYTICS INC (57 BRENTWOOD CIR; small business) : $474,994 in 3 contractsfrom 2005 to 2006
$250,000 with Air Force for Other Research and Development -- Basic Research (R&D). Signed on 2006-04-15. Completion date: 2008-04-14.
$125,000, same as above.Signed on 2006-06-23. Completion date: 2008-04-14.
$99,994, same as above.Signed on 2005-04-29. Completion date: 2006-01-31.
CENTERLINE DEVELOPMENT SYSTEMS (315A CHESTNUT STREET; small business)
$93,800 with Navy for ADP Software. Signed on 2000-03-07. Completion date: 2000-03-14.
WAIFE & ASSOCIATES INC (62 WARREN ST) : $58,696 in 3 contractsfrom 2002 to 2004
$41,040 with Army for Other Professional Services. Taking place in MD. Signed on 2002-06-06. Completion date: 2002-09-30.
$26,900, same as above.Signed on 2002-08-29. Completion date: 2002-09-30.
-$9,244, same as above.Signed on 2004-05-26. Completion date: 2002-09-30.
LIVING CARE VILLAGES OF MASSAC (865 CENTRAL AVE; small business) : $26,200 in 13 contractsfrom 2002 to 2006
Contracts for Snow Removal/Salt Service (also spreading aggregate or other snow melting material) by Army Signed by year:2000: $0; 2001: $0; 2002: $2,800; 2003: $13,000; 2004: $0; 2005: $8,600; 2006: $1,800.
Biggest contracts:
$6,000 with Army for Snow Removal/Salt Service (also spreading aggregate or other snow melting material). Signed on 2003-01-31. Completion date: 2003-04-30.
$4,400, same as above.Signed on 2005-12-21. Completion date: 2004-09-30.
$3,400, same as above.Signed on 2003-03-05. Completion date: 2003-04-30.
$3,000, same as above.Signed on 2005-10-19. Completion date: 2004-09-30.
$11,000 with Navy for Generators and Generators Sets, Electrical. Signed on 2005-08-05. Completion date: 2005-10-31.
GRAY ELECTRONICS INC (40 FREEMAN PL; small business)
$8,455 with Army for Miscellaneous Communication Equipment. Signed on 2005-09-29. Completion date: 2005-10-31.
BROOKS, ROBERT B (60 OAK KNOLL TERRACE; small business) : $4,000 in 2 contractsin 2005
$3,410 with Army for Maintenance, Repair and Rebuilding of Equipment -- Miscellaneous. Taking place in PA. Signed on 2005-04-18. Completion date: 2005-04-19.
$590, same as above.Signed on 2005-05-23. Completion date: 2005-04-19.
Top industries in this zip code by the number of employees in 2005:
2002 - 2018 National Fire Incident Reporting System (NFIRS) incidents
According to the data from the years 2002 - 2018 the average number of fire incidents per year is 13. The highest number of reported fires - 60 took place in 2016, and the least - 0 in 2006. The data has a rising trend.
When looking into fire subcategories, the most incidents belonged to: Outside Fires (51.1%), and Structure Fires (35.1%).
Fire incident types reported to NFIRS in Zip Code 02492


 Nearest zip codes: 02494, 02457, 02464, 02481, 02462, 02468.


 According to the data from the years 2002 - 2018 the average number of fire incidents per year is 13. The highest number of reported fires - 60 took place in 2016, and the least - 0 in 2006. The data has a rising trend.
 When looking into fire subcategories, the most incidents belonged to: Outside Fires (51.1%), and Structure Fires (35.1%).