Estimated zip code population in 2022: 10,926 Zip code population in 2010: 9,663 Zip code population in 2000: 9,466
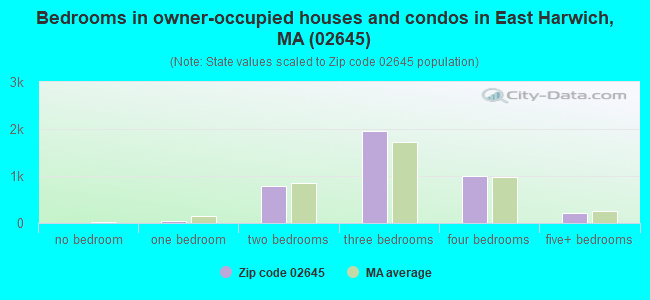
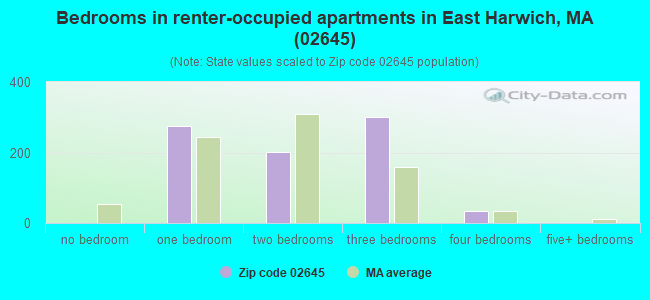
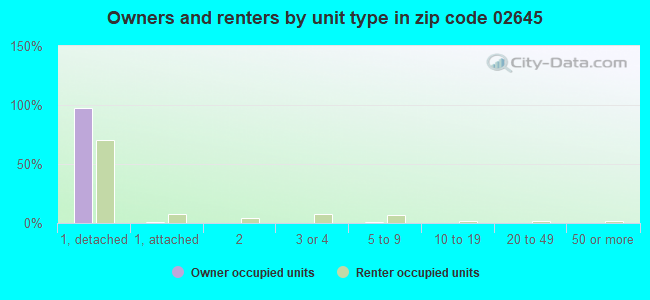
Houses and condos: 6,814 Renter-occupied apartments: 805
% of renters here:
17%
State:
38%
March 2022 cost of living index in zip code 02645: 119.2 (more than average, U.S. average is 100)
Land area: 16.6 sq. mi. Water area: 1.8 sq. mi.
Population density: 657 people per square mile
(low).
OSM Map
Google Map
MSN Map
OSM Map
General Map
Google Map
MSN Map
OSM Map
Google Map
MSN Map
OSM Map
Google Map
MSN Map
Please wait while loading the map...
Real estate property taxes paid for housing units in 2022:
This zip code:
0.6% ($3,782)
Massachusetts:
1.0% ($5,536)
Median real estate property taxes paid for housing units with mortgages in 2022: $3,675 (0.6%) Median real estate property taxes paid for housing units with no mortgage in 2022: $4,011 (0.7%)
Business Search- 14 Million verified businesses
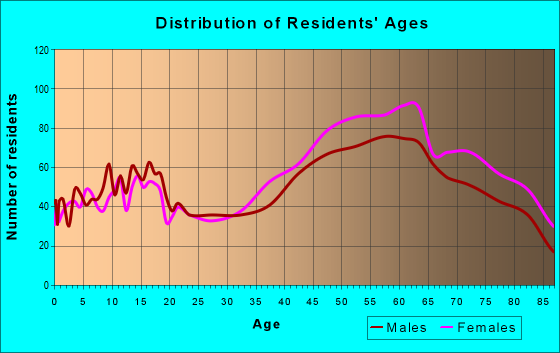
Males: 5,231
(47.9%)
Females: 5,695
(52.1%)
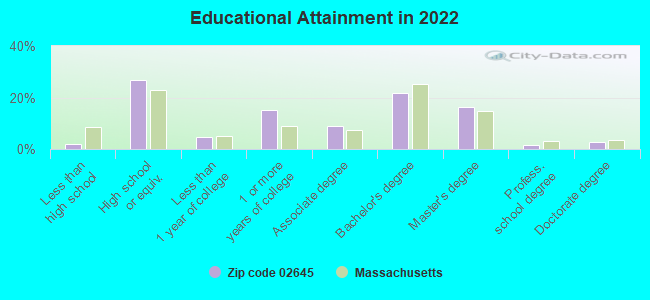
For population 25 years and over in 02645:
High school or higher: 97.4%
Bachelor's degree or higher: 42.3%
Graduate or professional degree: 20.6%
Unemployed: 4.8%
Mean travel time to work (commute): 21.3 minutes
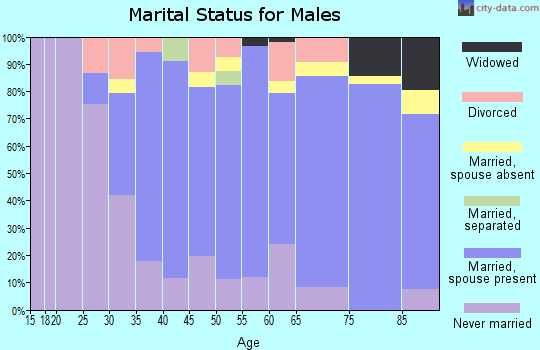
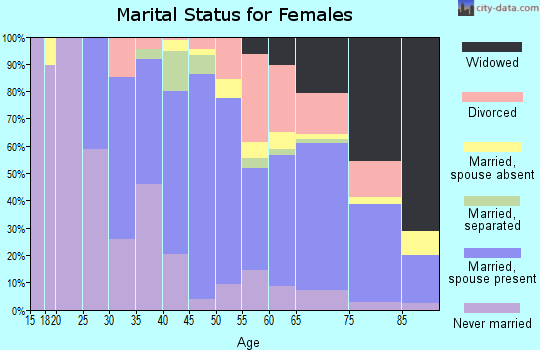
For population 15 years and over in 02645:
Never married: 23.4%
Now married: 48.5%
Separated: 0.6%
Widowed: 9.6%
Divorced: 18.0%
Zip code 02645 compared to state average:
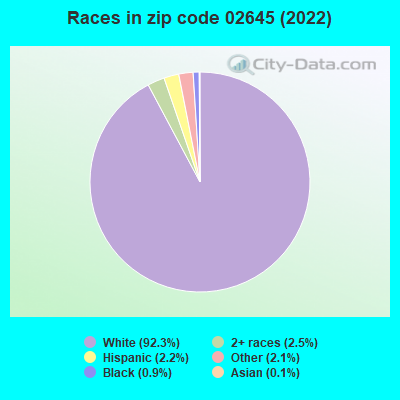
Black race population percentage significantly below state average.
Hispanic race population percentage significantly below state average.
Median age significantly above state average.
Foreign-born population percentage significantly below state average.
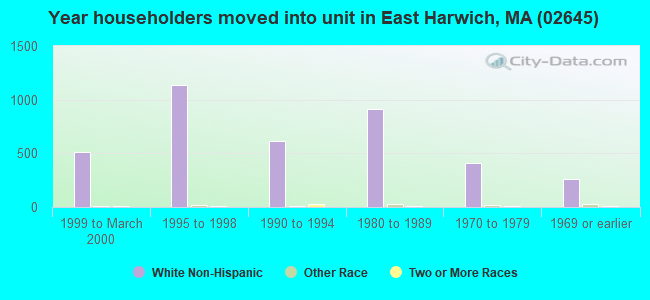
Renting percentage significantly below state average.
Length of stay since moving in above state average.
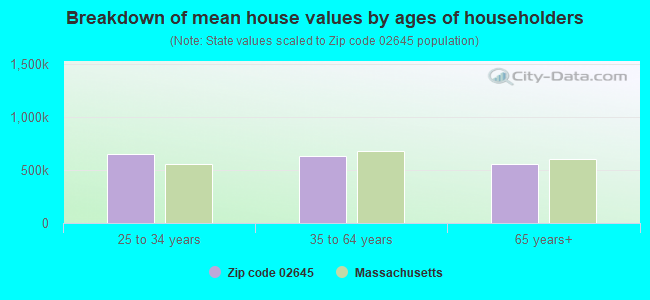
Estimated median house/condo value in 2022: $615,695
02645:
$615,695
Massachusetts:
$534,700
According to our research of Massachusetts and other state lists, there were 2 registered sex offenders living in 02645 zip code as of April 27, 2024. The ratio of all residents to sex offenders in zip code 02645 is 4,796 to 1. The ratio of registered sex offenders to all residents in this zip code is much lower than the state average.
Median resident age:
This zip code:
57.1 years
Massachusetts median age:
40.3 years
Average household size:
This zip code:
2.2 people
Massachusetts:
2.4 people
Averages for the 2020 tax year for zip code 02645, filed in 2021:
Average Adjusted Gross Income (AGI) in 2020: $81,356 (Individual Income Tax Returns)
Here:
$81,356
State:
$105,130
Salary/wage: $63,361 (reported on 70.6% of returns)
Here:
$63,361
State:
$82,951
(% of AGI for various income ranges: 1149.6% for AGIs below $25k, 3332.7% for AGIs $25k-50k, 5826.7% for AGIs $50k-75k, 9058.2% for AGIs $75k-100k, 16060.7% for AGIs $100k-200k, 71881.0% for AGIs over 200k)
Taxable interest for individuals: $1,322 (reported on 43.0% of returns)
This zip code:
$1,322
Massachusetts:
$2,361
(% of AGI for various income ranges: 36.1% for AGIs below $25k, 50.0% for AGIs $25k-50k, 62.5% for AGIs $50k-75k, 69.5% for AGIs $75k-100k, 201.1% for AGIs $100k-200k, 909.0% for AGIs over 200k)
Ordinary dividends: $7,656 (reported on 30.4% of returns)
Here:
$7,656
State:
$10,365
(% of AGI for various income ranges: 73.1% for AGIs below $25k, 143.2% for AGIs $25k-50k, 241.8% for AGIs $50k-75k, 352.9% for AGIs $75k-100k, 745.6% for AGIs $100k-200k, 5141.0% for AGIs over 200k)
Net capital gain/loss in AGI: +$17,783 (reported on 26.1% of returns)
Here:
+$17,783
State:
+$48,178
(% of AGI for various income ranges: 31.6% for AGIs below $25k, 77.0% for AGIs $25k-50k, 165.8% for AGIs $50k-75k, 259.5% for AGIs $75k-100k, 1075.9% for AGIs $100k-200k, 18737.0% for AGIs over 200k)
Profit/loss from business: +$19,669 (reported on 20.5% of returns)
Here:
+$19,669
State:
+$20,792
(% of AGI for various income ranges: 180.7% for AGIs below $25k, 334.2% for AGIs $25k-50k, 548.6% for AGIs $50k-75k, 783.7% for AGIs $75k-100k, 1068.1% for AGIs $100k-200k, 7594.0% for AGIs over 200k)
Taxable individual retirement arrangement distribution: $25,497 (reported on 16.8% of returns)
02645:
$25,497
Massachusetts:
$22,790
(% of AGI for various income ranges: 102.6% for AGIs below $25k, 216.4% for AGIs $25k-50k, 496.3% for AGIs $50k-75k, 837.9% for AGIs $75k-100k, 2075.6% for AGIs $100k-200k, 5345.0% for AGIs over 200k)
Self-employed (Keogh) retirement plans: $19,760 (reported on 0.8% of returns)
02645:
$19,760
Massachusetts:
$26,868
(% of AGI for various income ranges: 46.9% for AGIs $100k-200k, 735.0% for AGIs over 200k)
Total itemized deductions: $28,894 (reported on 14.4% of returns)
Here:
$28,894
State:
$36,722
(% of AGI for various income ranges: 177.1% for AGIs below $25k, 306.0% for AGIs $25k-50k, 693.3% for AGIs $50k-75k, 757.6% for AGIs $75k-100k, 1320.0% for AGIs $100k-200k, 6528.0% for AGIs over 200k)
Charity contributions: $6,061 (reported on 11.4% of returns)
Here:
$6,061
State:
$12,529
(% of AGI for various income ranges: 13.1% for AGIs below $25k, 30.7% for AGIs $25k-50k, 70.5% for AGIs $50k-75k, 90.3% for AGIs $75k-100k, 166.1% for AGIs $100k-200k, 2052.0% for AGIs over 200k)
Taxes paid: $7,707 (reported on 14.3% of returns)
02645:
$7,707
State:
$8,782
(% of AGI for various income ranges: 37.0% for AGIs below $25k, 69.5% for AGIs $25k-50k, 172.1% for AGIs $50k-75k, 249.5% for AGIs $75k-100k, 390.9% for AGIs $100k-200k, 1538.0% for AGIs over 200k)
Earned income credit: $1,620 (reported on 7.5% of returns)
Here:
$1,620
State:
$1,909
(% of AGI for various income ranges: 44.4% for AGIs below $25k, 38.6% for AGIs $25k-50k)
Percentage of individuals using paid preparers for their 2020 taxes: 92.9%
Here:
93%
State:
92%
(% for various income ranges: 90.5% for AGIs below $25k, 93.4% for AGIs $25k-50k, 93.5% for AGIs $50k-75k, 92.6% for AGIs $75k-100k, 94.7% for AGIs $100k-200k, 94.4% for AGIs over 200k)
Averages for the 2012 tax year for zip code 02645, filed in 2013:
Average Adjusted Gross Income (AGI) in 2012: $59,843 (Individual Income Tax Returns)
Here:
$59,843
State:
$81,425
Salary/wage: $46,724 (reported on 73.2% of returns)
Here:
$46,724
State:
$64,752
(% of AGI for various income ranges: 60.8% for AGIs below $25k, 63.0% for AGIs $25k-50k, 60.3% for AGIs $50k-75k, 57.7% for AGIs $75k-100k, 62.5% for AGIs $100k-200k, 40.1% for AGIs over 200k)
Taxable interest for individuals: $1,517 (reported on 45.1% of returns)
This zip code:
$1,517
Massachusetts:
$2,136
(% of AGI for various income ranges: 2.0% for AGIs below $25k, 1.2% for AGIs $25k-50k, 0.8% for AGIs $50k-75k, 0.7% for AGIs $75k-100k, 1.0% for AGIs $100k-200k, 1.7% for AGIs over 200k)
Ordinary dividends: $6,357 (reported on 30.2% of returns)
Here:
$6,357
State:
$9,473
(% of AGI for various income ranges: 3.7% for AGIs below $25k, 2.5% for AGIs $25k-50k, 2.3% for AGIs $50k-75k, 2.6% for AGIs $75k-100k, 2.5% for AGIs $100k-200k, 5.9% for AGIs over 200k)
Net capital gain/loss in AGI: +$22,562 (reported on 24.5% of returns)
Here:
+$22,562
State:
+$31,437
(% of AGI for various income ranges: 0.7% for AGIs $25k-50k, 0.5% for AGIs $50k-75k, 1.7% for AGIs $75k-100k, 2.7% for AGIs $100k-200k, 42.6% for AGIs over 200k)
Profit/loss from business: +$19,484 (reported on 21.6% of returns)
Here:
+$19,484
State:
+$20,662
(% of AGI for various income ranges: 12.9% for AGIs below $25k, 9.8% for AGIs $25k-50k, 6.7% for AGIs $50k-75k, 6.5% for AGIs $75k-100k, 5.4% for AGIs $100k-200k, 6.1% for AGIs over 200k)
Taxable individual retirement arrangement distribution: $15,342 (reported on 18.5% of returns)
02645:
$15,342
Massachusetts:
$18,892
(% of AGI for various income ranges: 5.5% for AGIs below $25k, 4.4% for AGIs $25k-50k, 4.7% for AGIs $50k-75k, 6.2% for AGIs $75k-100k, 4.5% for AGIs $100k-200k, 4.0% for AGIs over 200k)
Self-employment retirement plans: $17,920 (reported on 1.0% of returns)
02645:
$17,920
Massachusetts:
$20,669
Total itemized deductions: $21,856 (23% of AGI, reported on 43.8% of returns)
Here:
$21,856
State:
$28,907
Here:
22.9% of AGI
State:
18.2% of AGI
(% of AGI for various income ranges: 22.5% for AGIs below $25k, 15.2% for AGIs $25k-50k, 16.8% for AGIs $50k-75k, 17.1% for AGIs $75k-100k, 17.7% for AGIs $100k-200k, 9.9% for AGIs over 200k)
Charity contributions: $2,167 (reported on 35.6% of returns)
Here:
$2,167
State:
$4,208
(% of AGI for various income ranges: 1.2% for AGIs below $25k, 1.0% for AGIs $25k-50k, 1.2% for AGIs $50k-75k, 1.2% for AGIs $75k-100k, 1.6% for AGIs $100k-200k, 1.1% for AGIs over 200k)
Taxes paid: $7,788 (reported on 43.8% of returns)
02645:
$7,788
State:
$13,303
(% of AGI for various income ranges: 4.7% for AGIs below $25k, 4.1% for AGIs $25k-50k, 5.2% for AGIs $50k-75k, 5.9% for AGIs $75k-100k, 7.1% for AGIs $100k-200k, 5.4% for AGIs over 200k)
Earned income credit: $1,746 (reported on 9.7% of returns)
Here:
$1,746
State:
$1,971
(% of AGI for various income ranges: 3.0% for AGIs below $25k, 0.5% for AGIs $25k-50k)
Percentage of individuals using paid preparers for their 2012 taxes: 60.5%
Here:
61%
State:
56%
(% for various income ranges: 54.4% for AGIs below $25k, 58.5% for AGIs $25k-50k, 67.1% for AGIs $50k-75k, 65.4% for AGIs $75k-100k, 64.7% for AGIs $100k-200k, 78.6% for AGIs over 200k)
Averages for the 2004 tax year for zip code 02645, filed in 2005:
Average Adjusted Gross Income (AGI) in 2004: $45,421 (Individual Income Tax Returns)
Here:
$45,421
State:
$62,877
Salary/wage: $37,621 (reported on 72.2% of returns)
Here:
$37,621
State:
$52,969
(% of AGI for various income ranges: 173.3% for AGIs below $10k, 52.7% for AGIs $10k-25k, 64.9% for AGIs $25k-50k, 64.7% for AGIs $50k-75k, 63.6% for AGIs $75k-100k, 49.8% for AGIs over 100k)
Taxable interest for individuals: $1,503 (reported on 63.6% of returns)
This zip code:
$1,503
Massachusetts:
$1,945
(% of AGI for various income ranges: 18.3% for AGIs below $10k, 4.8% for AGIs $10k-25k, 1.9% for AGIs $25k-50k, 1.7% for AGIs $50k-75k, 1.1% for AGIs $75k-100k, 1.9% for AGIs over 100k)
Taxable dividends: $3,359 (reported on 36.5% of returns)
Here:
$3,359
State:
$5,323
(% of AGI for various income ranges: 19.2% for AGIs below $10k, 4.4% for AGIs $10k-25k, 2.3% for AGIs $25k-50k, 1.9% for AGIs $50k-75k, 2.1% for AGIs $75k-100k, 2.9% for AGIs over 100k)
Net capital gain/loss: +$8,571 (reported on 28.9% of returns)
Here:
+$8,571
State:
+$20,377
(% of AGI for various income ranges: -11.2% for AGIs below $10k, -0.9% for AGIs $10k-25k, 0.5% for AGIs $25k-50k, 1.5% for AGIs $50k-75k, 2.3% for AGIs $75k-100k, 15.4% for AGIs over 100k)
Profit/loss from business: +$16,065 (reported on 21.7% of returns)
Here:
+$16,065
State:
+$17,837
(% of AGI for various income ranges: -11.0% for AGIs below $10k, 11.6% for AGIs $10k-25k, 8.4% for AGIs $25k-50k, 6.7% for AGIs $50k-75k, 6.8% for AGIs $75k-100k, 7.8% for AGIs over 100k)
IRA payment deduction: $3,111 (reported on 4.8% of returns)
02645:
$3,111
Massachusetts:
$3,100
(% of AGI for various income ranges: 0.7% for AGIs $10k-25k, 0.5% for AGIs $25k-50k, 0.3% for AGIs $50k-75k, 0.2% for AGIs $75k-100k, 0.2% for AGIs over 100k)
Self-employed pension: $10,827 (reported on 1.6% of returns)
Here:
$10,827
Massachusetts:
$14,516
(% of AGI for various income ranges: 0.2% for AGIs $25k-50k, 0.3% for AGIs $50k-75k, 0.4% for AGIs $75k-100k, 0.7% for AGIs over 100k)
Total itemized deductions: $18,267 (26% of AGI, reported on 45.2% of returns)
Here:
$18,267
State:
$22,573
Here:
26.4% of AGI
State:
19.5% of AGI
(% of AGI for various income ranges: 70.5% for AGIs below $10k, 25.7% for AGIs $10k-25k, 19.2% for AGIs $25k-50k, 17.5% for AGIs $50k-75k, 18.1% for AGIs $75k-100k, 14.6% for AGIs over 100k)
Charity contributions deductions: $1,797 (2% of AGI, reported on 40.1% of returns)
Here:
$1,797
State:
$3,295
Here:
2.5% of AGI
State:
2.7% of AGI
(% of AGI for various income ranges: 2.3% for AGIs below $10k, 1.7% for AGIs $10k-25k, 1.3% for AGIs $25k-50k, 1.3% for AGIs $50k-75k, 1.6% for AGIs $75k-100k, 1.9% for AGIs over 100k)
Total tax: $6,353 (reported on 80.4% of returns)
02645:
$6,353
State:
$11,494
(% of AGI for various income ranges: 9.1% for AGIs below $10k, 5.0% for AGIs $10k-25k, 7.8% for AGIs $25k-50k, 9.5% for AGIs $50k-75k, 10.8% for AGIs $75k-100k, 16.8% for AGIs over 100k)
Earned income credit: $1,317 (reported on 8.0% of returns)
Here:
$1,317
State:
$1,518
Percentage of individuals using paid preparers for their 2004 taxes: 61.5%
Here:
61%
State:
58%
(% for various income ranges: 50.9% for AGIs below $10k, 61.7% for AGIs $10k-25k, 60.8% for AGIs $25k-50k, 64.8% for AGIs $50k-75k, 67.1% for AGIs $75k-100k, 73.1% for AGIs over 100k)
Likely homosexual households (counted as self-reported same-sex unmarried-partner households)
Lesbian couples: 0.2% of all households
Gay men: 0.0% of all households
Household received Food Stamps/SNAP in the past 12 months: 324 Household did not receive Food Stamps/SNAP in the past 12 months: 4,413
Women who had a birth in the past 12 months: 57 (60 now married, 0 unmarried) Women who did not have a birth in the past 12 months: 1,473 (487 now married, 989 unmarried)
Housing units in zip code 02645 with a mortgage: 2,402 (413 second mortgage, 371 both second mortgage and home equity loan) Houses without a mortgage: 225
Median monthly owner costs for units with a mortgage: $2,085 Median monthly owner costs for units without a mortgage: $850
Residents with income below the poverty level in 2022:
This zip code:
4.4%
Whole state:
10.4%
Residents with income below 50% of the poverty level in 2022:
This zip code:
3.4%
Whole state:
5.1%
Median number of rooms in houses and condos:
Here:
6.3
State:
6.5
Median number of rooms in apartments:
Here:
4.2
State:
4.0
Notable locations in this zip code not listed on our city pages
Notable locations in zip code 02645: Sand Pond (A), Harwich Fire Department Station 2 (B), Harwich Fire Department Station 1 Headquarters (C), Harwich Elementary School Library Media Center (D), Cape Cod Regional Technical High School Library (E), Bay Path Regional Vocational Technical High School Media Center (F), Brooks Library (G), North Harwich Station (H). Display/hide their locations on the map
In group quarters: 161 (-1 institutionalized population)
Size of family households: 1,478 2-persons, 764 3-persons, 517 4-persons, 84 5-persons, 7 7-or-more-persons
Size of nonfamily households: 1,423 1-person, 524 2-persons, 35 3-persons
953 married couples with children.
460 single-parent households (346 men, 114 women).
92.6% of residents of 02645 zip code speak English at home.
0.4% of residents speak Spanish at home (57% very well, 30% well, 14% not at all).
6.2% of residents speak other Indo-European language at home (87% very well, 11% well, 3% not well).
1.4% of residents speak Asian or Pacific Island language at home (100% very well).
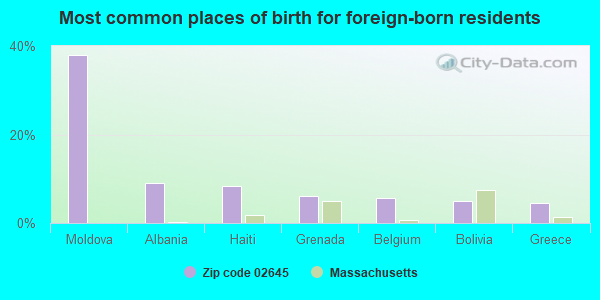
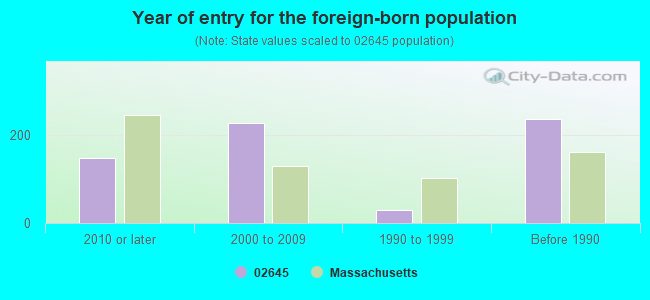
Foreign born population: 590 (5.4%) (82.1% of them are naturalized citizens)
This zip code:
5.4%
Whole state:
18.0%
38%Moldova
9%Albania
8%Haiti
6%Grenada
6%Belgium
5%Bolivia
4%Greece
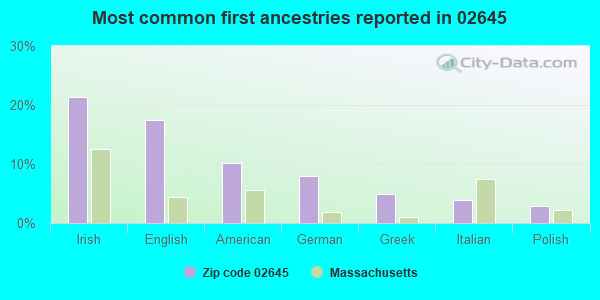
21%Irish
18%English
10%American
8%German
5%Greek
4%Italian
3%Polish
Year of entry for the foreign-born population
1482010 or later
2272000 to 2009
291990 to 1999
235Before 1990
Facilities with environmental interests located in this zip code:
ALLEN HARBOR MARINE SERVICE INC (335 LOWER COUNTY RD in HARWICH, MA)
CAPE COD REG TECH HIGH SCHOOL DIS (PLEASANT LAKE AVE in HARWICH, MA)
AIR MINOR (AIRS/AFS) COMPLIANCE ACTIVITY (Tracking inspections of insecticide, fungicide, and rodenticide, and toxic substances) CRITERIA AND HAZARDOUS AIR POLLUTANT INVENTORY (Inventory of air pollution sources) Small Quantity Generators, between 100 kg and 1000 kg of hazardous waste/month (Resource Conservation and Recovery Act (tracking hazardous waste)) - notification Business SIC classification: ELEMENTARY AND SECONDARY SCHOOLS Organizations: CAPE COD REGIONAL TECH (CONTACT/OWNER)
Alternative names: C.C.REG.TECH.H.S.DIS, CAPE COD REG TECH HS, CAPE COD REGIONAL TECHNICAL HIGH SCHOOL
CAPE COD REGION VOC TECH (PLEASANT LAKE AVENUE in HARWICH, MA)
(National Center for Education Statistics) - STATE ID-815605
CAPE COD OIL CO (HARWICH ST in HARWICH, MA)
(Integrated Compliance Information System) - ICIS-01-1997-0106, FORMAL ENFORCEMENT ACTION
CAPE COD RADIOLOGY ASSOC INC (253 PLEASANT LAKE AVE in HARWICH, MA)
Conditionally Exempt Small Quantity Generators, less than 100 kg/month of hazardous waste (Resource Conservation and Recovery Act (tracking hazardous waste)) - notification Organizations: CAPE COD RADIOLOGY ASSOC. INC. (CONTACT/OPERATOR)
, CAPE COD RADIOLOGY ASSOC INC. (CONTACT/OWNER)
ENERGY RETAILERS INC (435 MAIN ST RTE 28 in HARWICH, MA)
(Resource Conservation and Recovery Act (tracking hazardous waste))
MARKS AUTO SERVICE (166 QUEEN ANNE RD in HARWICH, MA)
(Resource Conservation and Recovery Act (tracking hazardous waste)) Organizations: MARK STINES (CONTACT/OWNER)
CAPE COD AUTO MALL (182 LONG POND RD in HARWICH, MA)
Small Quantity Generators, between 100 kg and 1000 kg of hazardous waste/month (Resource Conservation and Recovery Act (tracking hazardous waste)) - notification Organizations: PETER S STAGG (CONTACT/OWNER)
ORLEANS CAMERA & VIDEO INC (27A RTE 39 in HARWICH, MA)
Small Quantity Generators, between 100 kg and 1000 kg of hazardous waste/month (Resource Conservation and Recovery Act (tracking hazardous waste)) - notification
OUR ROBERT B CO INC (GREAT WESTERN RD in HARWICH, MA)
(Resource Conservation and Recovery Act (tracking hazardous waste))
ER LILLEY PHOTOGRAPHY (500 MAIN ST in HARWICH, MA)
Small Quantity Generators, between 100 kg and 1000 kg of hazardous waste/month (Resource Conservation and Recovery Act (tracking hazardous waste)) - notification Organizations: LILLEY ER PHOTOGRAPHY (CONTACT/OPERATOR)
, BU & PR: EDWARD R LILLEY (CONTACT/OWNER)
Alternative names: LILLEY E R PHOTOGRAPHY, LILLEY ER PHOTOGRAPHY
KARLS BOAT SHOP (50 GREAT WESTERN ROAD in HARWICH, MA)
Conditionally Exempt Small Quantity Generators, less than 100 kg/month of hazardous waste (Resource Conservation and Recovery Act (tracking hazardous waste)) - notification Business NAICS classification: BOAT BUILDING. Organizations: ANDERSON KARL (CONTACT/OWNER)
Alternative names: PEASE BOAT WORKS
LYNCH HEAD SERVICE (210 QUEEN ANNE RD in HARWICH, MA)
Conditionally Exempt Small Quantity Generators, less than 100 kg/month of hazardous waste (Resource Conservation and Recovery Act (tracking hazardous waste)) - notification Business NAICS classification: MOTOR VEHICLE BODY MANUFACTURING. Organizations: WILLIAM D LYNCH (CONTACT/OWNER)
Housing units lacking complete plumbing facilities: 0.3%
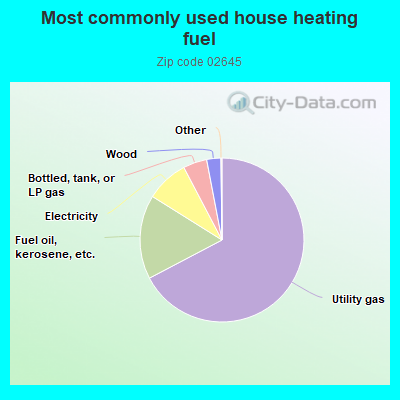
67.3%Utility gas
16.6%Fuel oil, kerosene, etc.
8.4%Electricity
4.7%Bottled, tank, or LP gas
2.8%Wood
Population in 1990: 7,363. Population change in the 1990s: +2,103 (+28.6%).
Place of birth for U.S.-born residents:
This state: 6,555
Northeast: 2,303
Midwest: 574
South: 257
West: 552
58% of the 02645 zip code residents lived in the same house 5 years ago. Out of people who lived in different houses, 54% lived in this county. Out of people who lived in different counties, 50% lived in Massachusetts.
94% of the 02645 zip code residents lived in the same house 1 year ago. Out of people who lived in different houses, 49% moved from this county. Out of people who lived in different houses, 8% moved from different county within same state. Out of people who lived in different houses, 45% moved from different state.
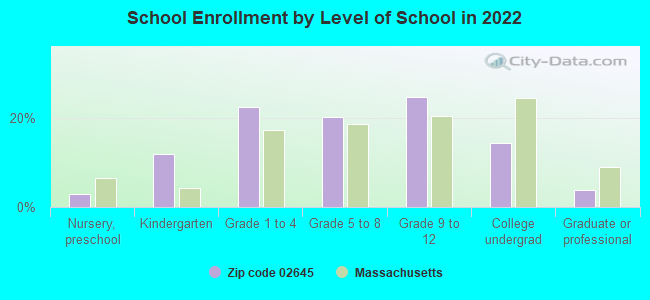
Private vs. public school enrollment:
Students in private schools in grades 1 to 8 (elementary and middle school): 97
Here:
17.7%
Massachusetts:
10.3%
Students in private schools in grades 9 to 12 (high school): 14
Here:
4.5%
Massachusetts:
12.3%
Students in private undergraduate colleges: 65
Here:
35.7%
Massachusetts:
51.2%
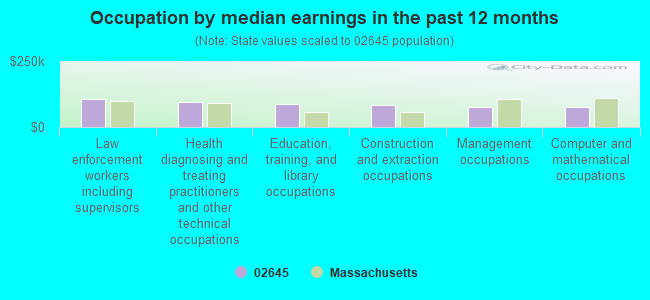
Occupation by median earnings in the past 12 months ($)
105,657Law enforcement workers including supervisors
93,971Health diagnosing and treating practitioners and other technical occupations
88,306Education, training, and library occupations
82,277Construction and extraction occupations
78,081Management occupations
75,888Computer and mathematical occupations
Companies with federal contracts located in this zip code:
SNOWS PROPERTY MANAGEMENT (107 COURTNRY RD in HARWICH, MA; small business) : $155,857 in 25 contractsfrom 2005 to 2006
Contracts for Landscaping/Groundskeeping Services by U.S. Army Corps of Engineers - civil program financing only, Army, U.S. Coast Guard Signed by year:2000: $0; 2001: $0; 2002: $0; 2003: $0; 2004: $0; 2005: $98,515; 2006: $57,342.
Biggest contracts:
$44,649 with U.S. Army Corps of Engineers - civil program financing only for Landscaping/Groundskeeping Services. Signed on 2005-05-13. Completion date: 2005-11-11.
$44,649 with Army for Landscaping/Groundskeeping Services. Signed on 2005-05-13. Completion date: 2005-11-11.
$30,075 with U.S. Coast Guard for Landscaping/Groundskeeping Services. Signed on 2005-05-20. Completion date: 2005-11-30.
$27,830, same as above.Signed on 2006-05-03. Completion date: 2006-11-30.
KLAASSEN'S KLEEN SWEEP INC (231 QUEEN ANNE RD in HARWICH, MA) : $47,190 in 4 contractsfrom 2004 to 2005
$24,095 with Army for Other Housekeeping Services. Signed on 2004-03-13. Completion date: 2004-12-31.
$24,095 with U.S. Army Corps of Engineers - civil program financing only for Other Housekeeping Services. Signed on 2004-03-13. Completion date: 2004-12-31.
-$500, same as above.Signed on 2005-02-08. Completion date: 2005-01-31.
-$500 with Army for Other Housekeeping Services. Signed on 2005-02-08. Completion date: 2005-01-31.
Top industries in this zip code by the number of employees in 2005:
Health Care and Social Assistance: Nursing Care Facilities (100-249 employees: 1 establishment, 20-49 employees: 1 establishment)
Administrative and Support and Waste Management and Remediation Services: Landscaping Services (20-49: 1, 5-9: 2, 1-4: 25)
Construction: Water and Sewer Line and Related Structures Construction (50-99: 1, 1-4: 1)
2002 - 2018 National Fire Incident Reporting System (NFIRS) incidents
According to the data from the years 2002 - 2018 the average number of fire incidents per year is 61. The highest number of fires - 81 took place in 2006, and the least - 34 in 2018. The data has a decreasing trend.
When looking into fire subcategories, the most incidents belonged to: Structure Fires (53.3%), and Outside Fires (30.6%).
Fire incident types reported to NFIRS in Zip Code 02645


 Nearest zip codes: 02646, 02659, 02631, 02671, 02669, 02639.


 According to the data from the years 2002 - 2018 the average number of fire incidents per year is 61. The highest number of fires - 81 took place in 2006, and the least - 34 in 2018. The data has a decreasing trend.
 When looking into fire subcategories, the most incidents belonged to: Structure Fires (53.3%), and Outside Fires (30.6%).