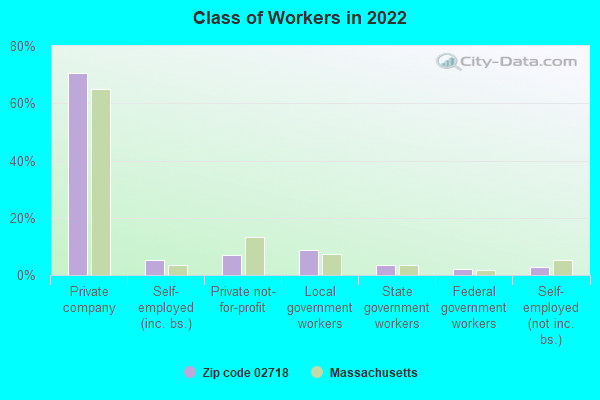
Estimated zip code population in 2022: 7,210 Zip code population in 2010: 6,655 Zip code population in 2000: 6,726
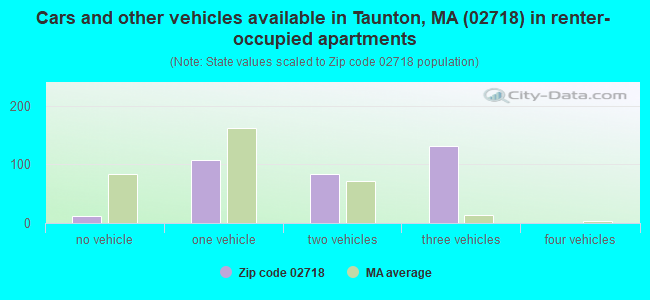
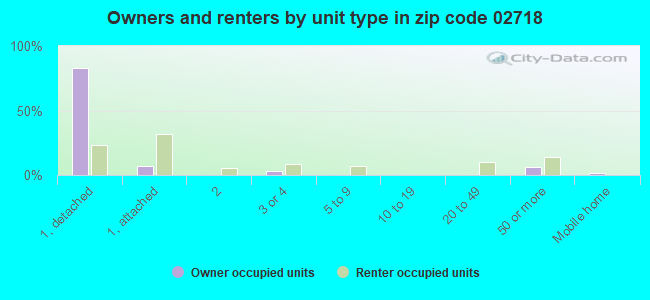
Houses and condos: 2,671 Renter-occupied apartments: 334
% of renters here:
13%
State:
38%
March 2022 cost of living index in zip code 02718: 131.3 (high, U.S. average is 100)
Land area: 10.3 sq. mi. Water area: 0.3 sq. mi.
Population density: 697 people per square mile
(low).
OSM Map
Google Map
MSN Map
OSM Map
General Map
Google Map
MSN Map
OSM Map
Google Map
MSN Map
OSM Map
Google Map
MSN Map
Please wait while loading the map...
Real estate property taxes paid for housing units in 2022:
This zip code:
1.0% ($4,399)
Massachusetts:
1.0% ($5,536)
Median real estate property taxes paid for housing units with mortgages in 2022: $4,565 (1.0%) Median real estate property taxes paid for housing units with no mortgage in 2022: $4,128 (1.0%)
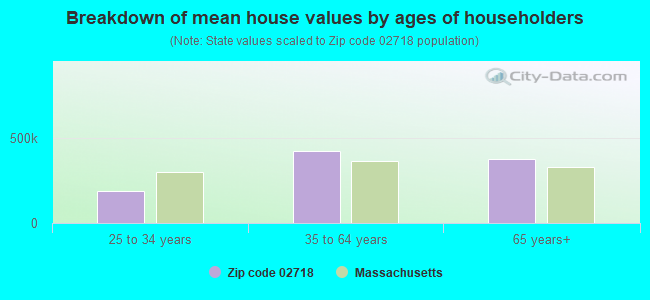
Estimated median house/condo value in 2022: $445,197
02718:
$445,197
Massachusetts:
$534,700
According to our research of Massachusetts and other state lists, there were 6 registered sex offenders living in 02718 zip code as of April 27, 2024. The ratio of all residents to sex offenders in zip code 02718 is 1,103 to 1.
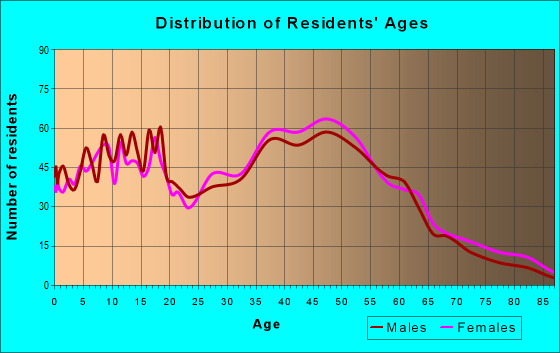
Median resident age:
This zip code:
41.2 years
Massachusetts median age:
40.3 years
Average household size:
This zip code:
2.8 people
Massachusetts:
2.4 people
Averages for the 2020 tax year for zip code 02718, filed in 2021:
Average Adjusted Gross Income (AGI) in 2020: $67,149 (Individual Income Tax Returns)
Here:
$67,149
State:
$105,130
Salary/wage: $60,866 (reported on 86.4% of returns)
Here:
$60,866
State:
$82,951
(% of AGI for various income ranges: 1168.2% for AGIs below $25k, 3411.2% for AGIs $25k-50k, 6335.7% for AGIs $50k-75k, 9851.0% for AGIs $75k-100k, 18190.8% for AGIs $100k-200k, 55463.3% for AGIs over 200k)
Taxable interest for individuals: $619 (reported on 31.9% of returns)
This zip code:
$619
Massachusetts:
$2,361
(% of AGI for various income ranges: 15.4% for AGIs below $25k, 12.0% for AGIs $25k-50k, 21.2% for AGIs $50k-75k, 31.3% for AGIs $75k-100k, 51.4% for AGIs $100k-200k, 353.3% for AGIs over 200k)
Ordinary dividends: $1,789 (reported on 14.1% of returns)
Here:
$1,789
State:
$10,365
(% of AGI for various income ranges: 4.0% for AGIs below $25k, 12.9% for AGIs $25k-50k, 22.7% for AGIs $50k-75k, 49.0% for AGIs $75k-100k, 102.4% for AGIs $100k-200k, 236.7% for AGIs over 200k)
Net capital gain/loss in AGI: +$7,764 (reported on 11.2% of returns)
Here:
+$7,764
State:
+$48,178
(% of AGI for various income ranges: 3.4% for AGIs below $25k, 14.2% for AGIs $25k-50k, 5.1% for AGIs $50k-75k, 103.9% for AGIs $75k-100k, 270.6% for AGIs $100k-200k, 4903.3% for AGIs over 200k)
Profit/loss from business: +$11,809 (reported on 12.0% of returns)
Here:
+$11,809
State:
+$20,792
(% of AGI for various income ranges: 86.8% for AGIs below $25k, 123.9% for AGIs $25k-50k, 202.0% for AGIs $50k-75k, 204.8% for AGIs $75k-100k, 407.6% for AGIs $100k-200k, 946.7% for AGIs over 200k)
Taxable individual retirement arrangement distribution: $15,500 (reported on 6.4% of returns)
02718:
$15,500
Massachusetts:
$22,790
(% of AGI for various income ranges: 39.7% for AGIs below $25k, 66.8% for AGIs $25k-50k, 96.3% for AGIs $50k-75k, 192.9% for AGIs $75k-100k, 395.7% for AGIs $100k-200k)
Total itemized deductions: $23,758 (reported on 10.6% of returns)
Here:
$23,758
State:
$36,722
(% of AGI for various income ranges: 170.2% for AGIs $25k-50k, 380.6% for AGIs $50k-75k, 661.0% for AGIs $75k-100k, 769.6% for AGIs $100k-200k, 2316.7% for AGIs over 200k)
Charity contributions: $3,734 (reported on 7.7% of returns)
Here:
$3,734
State:
$12,529
(% of AGI for various income ranges: 6.7% for AGIs $25k-50k, 30.4% for AGIs $50k-75k, 72.9% for AGIs $75k-100k, 100.0% for AGIs $100k-200k, 580.0% for AGIs over 200k)
Taxes paid: $8,152 (reported on 10.6% of returns)
02718:
$8,152
State:
$8,782
(% of AGI for various income ranges: 44.7% for AGIs $25k-50k, 137.3% for AGIs $50k-75k, 240.3% for AGIs $75k-100k, 268.8% for AGIs $100k-200k, 770.0% for AGIs over 200k)
Earned income credit: $1,797 (reported on 9.3% of returns)
Here:
$1,797
State:
$1,909
(% of AGI for various income ranges: 47.9% for AGIs below $25k, 45.9% for AGIs $25k-50k)
Percentage of individuals using paid preparers for their 2020 taxes: 93.4%
Here:
93%
State:
92%
(% for various income ranges: 91.7% for AGIs below $25k, 95.2% for AGIs $25k-50k, 93.8% for AGIs $50k-75k, 93.2% for AGIs $75k-100k, 93.7% for AGIs $100k-200k, 88.9% for AGIs over 200k)
Averages for the 2012 tax year for zip code 02718, filed in 2013:
Average Adjusted Gross Income (AGI) in 2012: $55,430 (Individual Income Tax Returns)
Here:
$55,430
State:
$81,425
Salary/wage: $51,357 (reported on 89.3% of returns)
Here:
$51,357
State:
$64,752
(% of AGI for various income ranges: 75.4% for AGIs below $25k, 81.7% for AGIs $25k-50k, 84.8% for AGIs $50k-75k, 86.0% for AGIs $75k-100k, 88.2% for AGIs $100k-200k, 49.3% for AGIs over 200k)
Taxable interest for individuals: $500 (reported on 36.1% of returns)
This zip code:
$500
Massachusetts:
$2,136
(% of AGI for various income ranges: 0.6% for AGIs below $25k, 0.4% for AGIs $25k-50k, 0.3% for AGIs $50k-75k, 0.5% for AGIs $75k-100k, 0.2% for AGIs $100k-200k, 0.2% for AGIs over 200k)
Ordinary dividends: $1,409 (reported on 13.6% of returns)
Here:
$1,409
State:
$9,473
(% of AGI for various income ranges: 0.7% for AGIs below $25k, 0.5% for AGIs $25k-50k, 0.3% for AGIs $50k-75k, 0.2% for AGIs $75k-100k, 0.4% for AGIs $100k-200k)
Net capital gain/loss in AGI: +$2,423 (reported on 7.7% of returns)
Here:
+$2,423
State:
+$31,437
(% of AGI for various income ranges: 0.2% for AGIs $50k-75k, 0.8% for AGIs $100k-200k, 0.4% for AGIs over 200k)
Profit/loss from business: +$11,647 (reported on 11.2% of returns)
Here:
+$11,647
State:
+$20,662
(% of AGI for various income ranges: 8.0% for AGIs below $25k, 4.0% for AGIs $25k-50k, 2.2% for AGIs $50k-75k, 1.9% for AGIs $75k-100k, 1.3% for AGIs $100k-200k)
Taxable individual retirement arrangement distribution: $9,946 (reported on 7.1% of returns)
02718:
$9,946
Massachusetts:
$18,892
(% of AGI for various income ranges: 2.1% for AGIs below $25k, 1.8% for AGIs $25k-50k, 1.3% for AGIs $50k-75k, 1.4% for AGIs $75k-100k, 1.1% for AGIs $100k-200k)
Total itemized deductions: $19,903 (23% of AGI, reported on 41.7% of returns)
Here:
$19,903
State:
$28,907
Here:
22.6% of AGI
State:
18.2% of AGI
(% of AGI for various income ranges: 9.2% for AGIs below $25k, 11.9% for AGIs $25k-50k, 15.8% for AGIs $50k-75k, 17.1% for AGIs $75k-100k, 16.1% for AGIs $100k-200k, 13.5% for AGIs over 200k)
Charity contributions: $1,563 (reported on 33.1% of returns)
Here:
$1,563
State:
$4,208
(% of AGI for various income ranges: 0.4% for AGIs below $25k, 0.6% for AGIs $25k-50k, 1.0% for AGIs $50k-75k, 0.9% for AGIs $75k-100k, 1.1% for AGIs $100k-200k, 1.5% for AGIs over 200k)
Taxes paid: $7,843 (reported on 41.7% of returns)
02718:
$7,843
State:
$13,303
(% of AGI for various income ranges: 2.5% for AGIs below $25k, 3.9% for AGIs $25k-50k, 5.5% for AGIs $50k-75k, 6.4% for AGIs $75k-100k, 7.0% for AGIs $100k-200k, 7.7% for AGIs over 200k)
Earned income credit: $2,014 (reported on 12.7% of returns)
Here:
$2,014
State:
$1,971
(% of AGI for various income ranges: 4.9% for AGIs below $25k, 0.8% for AGIs $25k-50k)
Percentage of individuals using paid preparers for their 2012 taxes: 59.2%
Here:
59%
State:
56%
(% for various income ranges: 54.0% for AGIs below $25k, 58.9% for AGIs $25k-50k, 63.6% for AGIs $50k-75k, 63.6% for AGIs $75k-100k, 61.2% for AGIs $100k-200k, 75.0% for AGIs over 200k)
Averages for the 2004 tax year for zip code 02718, filed in 2005:
Average Adjusted Gross Income (AGI) in 2004: $49,289 (Individual Income Tax Returns)
Here:
$49,289
State:
$62,877
Salary/wage: $46,910 (reported on 91.8% of returns)
Here:
$46,910
State:
$52,969
(% of AGI for various income ranges: 94.4% for AGIs below $10k, 77.9% for AGIs $10k-25k, 88.4% for AGIs $25k-50k, 88.9% for AGIs $50k-75k, 94.8% for AGIs $75k-100k, 81.1% for AGIs over 100k)
Taxable interest for individuals: $565 (reported on 52.5% of returns)
This zip code:
$565
Massachusetts:
$1,945
(% of AGI for various income ranges: 3.0% for AGIs below $10k, 1.2% for AGIs $10k-25k, 0.7% for AGIs $25k-50k, 0.5% for AGIs $50k-75k, 0.4% for AGIs $75k-100k, 0.5% for AGIs over 100k)
Taxable dividends: $732 (reported on 17.3% of returns)
Here:
$732
State:
$5,323
(% of AGI for various income ranges: 1.3% for AGIs below $10k, 0.4% for AGIs $10k-25k, 0.3% for AGIs $25k-50k, 0.3% for AGIs $50k-75k, 0.1% for AGIs $75k-100k, 0.2% for AGIs over 100k)
Net capital gain/loss: +$6,087 (reported on 11.2% of returns)
Here:
+$6,087
State:
+$20,377
(% of AGI for various income ranges: 0.4% for AGIs below $10k, 0.3% for AGIs $10k-25k, 0.1% for AGIs $25k-50k, 0.4% for AGIs $50k-75k, 0.8% for AGIs $75k-100k, 4.0% for AGIs over 100k)
Profit/loss from business: +$10,573 (reported on 12.4% of returns)
Here:
+$10,573
State:
+$17,837
(% of AGI for various income ranges: 9.4% for AGIs below $10k, 6.2% for AGIs $10k-25k, 3.0% for AGIs $25k-50k, 2.5% for AGIs $50k-75k, 1.3% for AGIs $75k-100k, 2.6% for AGIs over 100k)
IRA payment deduction: $2,800 (reported on 2.5% of returns)
02718:
$2,800
Massachusetts:
$3,100
(% of AGI for various income ranges: 0.3% for AGIs $25k-50k, 0.1% for AGIs $50k-75k, 0.2% for AGIs $75k-100k, 0.1% for AGIs over 100k)
Total itemized deductions: $16,866 (22% of AGI, reported on 46.3% of returns)
Here:
$16,866
State:
$22,573
Here:
21.8% of AGI
State:
19.5% of AGI
(% of AGI for various income ranges: 8.7% for AGIs below $10k, 9.2% for AGIs $10k-25k, 15.3% for AGIs $25k-50k, 18.8% for AGIs $50k-75k, 19.0% for AGIs $75k-100k, 12.9% for AGIs over 100k)
Charity contributions deductions: $1,423 (2% of AGI, reported on 42.2% of returns)
Here:
$1,423
State:
$3,295
Here:
1.8% of AGI
State:
2.7% of AGI
(% of AGI for various income ranges: 0.6% for AGIs $10k-25k, 1.0% for AGIs $25k-50k, 1.4% for AGIs $50k-75k, 1.3% for AGIs $75k-100k, 1.3% for AGIs over 100k)
Total tax: $6,318 (reported on 82.1% of returns)
02718:
$6,318
State:
$11,494
(% of AGI for various income ranges: 3.0% for AGIs below $10k, 4.8% for AGIs $10k-25k, 7.2% for AGIs $25k-50k, 8.0% for AGIs $50k-75k, 9.2% for AGIs $75k-100k, 17.8% for AGIs over 100k)
Earned income credit: $1,487 (reported on 9.5% of returns)
Here:
$1,487
State:
$1,518
Percentage of individuals using paid preparers for their 2004 taxes: 62.1%
Here:
62%
State:
58%
(% for various income ranges: 50.5% for AGIs below $10k, 61.9% for AGIs $10k-25k, 65.8% for AGIs $25k-50k, 64.6% for AGIs $50k-75k, 66.9% for AGIs $75k-100k, 60.8% for AGIs over 100k)
Likely homosexual households (counted as self-reported same-sex unmarried-partner households)
Lesbian couples: 0.0% of all households
Gay men: 1.0% of all households
Household received Food Stamps/SNAP in the past 12 months: 347 Household did not receive Food Stamps/SNAP in the past 12 months: 2,197
Women who had a birth in the past 12 months: 87 (32 now married, 48 unmarried) Women who did not have a birth in the past 12 months: 1,455 (717 now married, 726 unmarried)
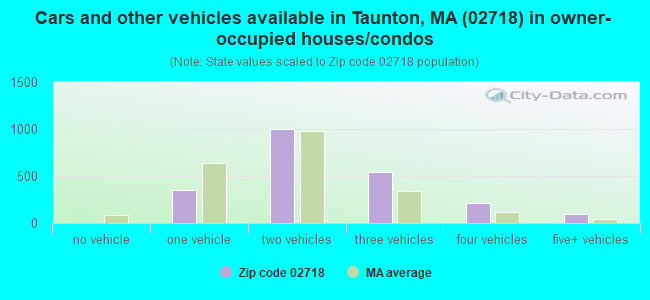
Housing units in zip code 02718 with a mortgage: 1,448 (160 second mortgage, 38 home equity loan, 116 both second mortgage and home equity loan) Houses without a mortgage: 66
Median monthly owner costs for units with a mortgage: $2,278 Median monthly owner costs for units without a mortgage: $753
Residents with income below the poverty level in 2022:
This zip code:
11.6%
Whole state:
10.4%
Residents with income below 50% of the poverty level in 2022:
This zip code:
7.0%
Whole state:
5.1%
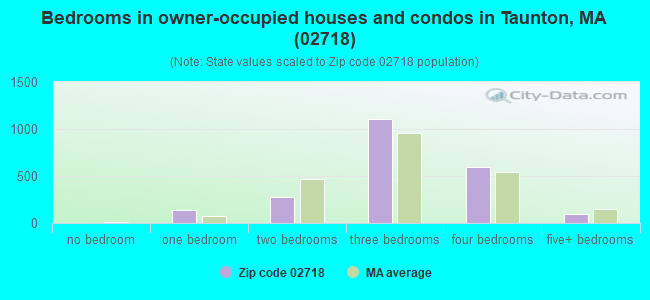
Median number of rooms in houses and condos:
Here:
6.1
State:
6.5
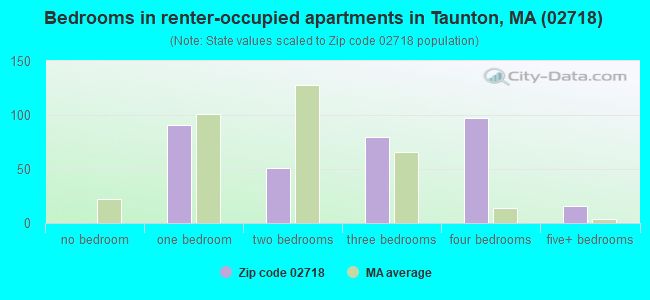
Median number of rooms in apartments:
Here:
5.0
State:
4.0
Notable locations in this zip code not listed on our city pages
Notable locations in zip code 02718: Taunton Fire Department East Taunton Station (A), Martin Middle School Library Media Center (B). Display/hide their locations on the map
In group quarters: 3 (-1 institutionalized population)
Size of family households: 602 2-persons, 521 3-persons, 322 4-persons, 385 5-persons, 81 6-persons
Size of nonfamily households: 487 1-person, 136 2-persons
695 married couples with children.
114 single-parent households (89 men, 25 women).
79.7% of residents of 02718 zip code speak English at home.
0.6% of residents speak Spanish at home (100% very well).
17.9% of residents speak other Indo-European language at home (66% very well, 18% well, 11% not well, 5% not at all).
0.4% of residents speak Asian or Pacific Island language at home (100% very well).
0.8% of residents speak other language at home (100% very well).
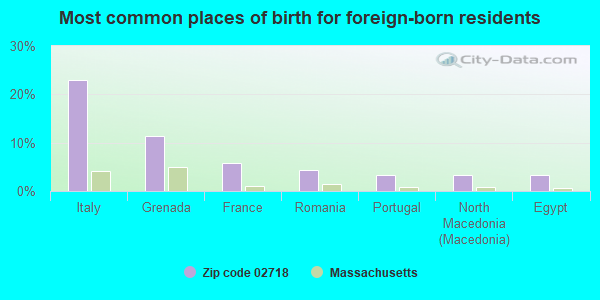
Foreign born population: 1,025 (14.2%) (76.5% of them are naturalized citizens)
This zip code:
14.2%
Whole state:
18.0%
23%Italy
11%Grenada
6%France
4%Romania
3%Portugal
3%North Macedonia (Macedonia)
3%Egypt
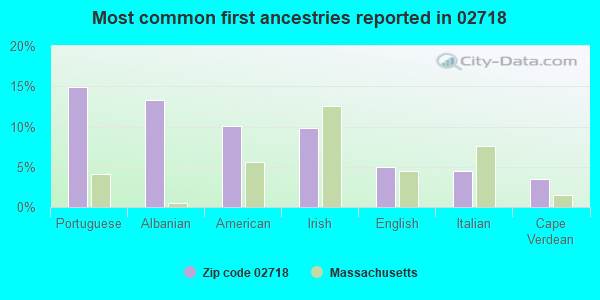
15%Portuguese
13%Albanian
10%American
10%Irish
5%English
5%Italian
3%Cape Verdean
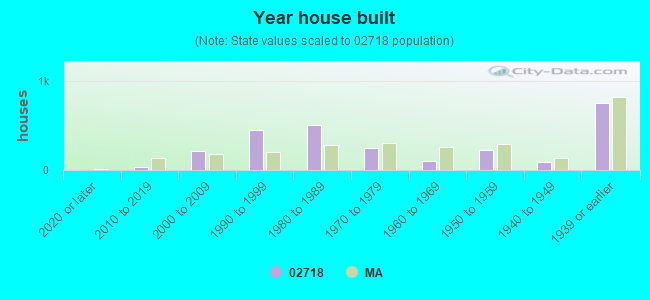
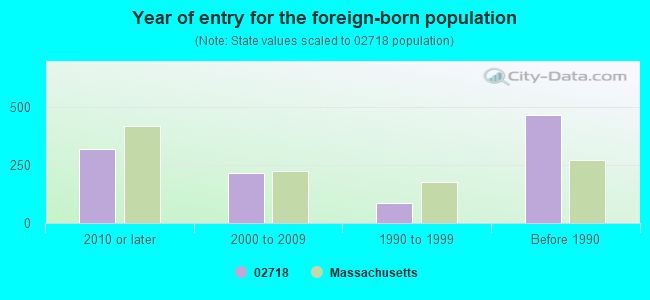
Year of entry for the foreign-born population
3212010 or later
2182000 to 2009
881990 to 1999
467Before 1990
Facilities with environmental interests located in this zip code:
LALLY COLUMN CORP (160 MIDDLEBORO AVE in TAUNTON, MA)
AIR MINOR (AIRS/AFS) STATE MASTER (MA-EPICS) - NEI-1200478, AIR PROGRAM Business SIC classification: FABRICATED STRUCTURAL METAL
CAPE DORY YACHTS INC (160 MIDDLEBORO AVE. in EAST TAUNTON, MA)
AIR MINOR (AIRS/AFS) (Resource Conservation and Recovery Act (tracking hazardous waste)) TRI REPORTER (Tracking of toxic chemicals releasing facilities) Business SIC classification: BOAT BUILDING AND REPAIRING Business NAICS classification: BOAT BUILDING. Organizations: VAVOLOTIS ANDREW C (CONTACT/OWNER)
EAST TAUNTON ELEM (58R STEVENS STREET in EAST TAUNTON, MA)
(National Center for Education Statistics) - STATE ID-293010
JOSEPH H MARTIN (131 CASWELL STREET in EAST TAUNTON, MA)
(National Center for Education Statistics) - STATE ID-293042 Organizations: TAUNTON (SCHOOL DISTRICT)
NORTHEAST REFRIGERATED TERMINALS INC (81 INGELL ST in TAUNTON, MA)
(Integrated Compliance Information System) - ICIS-01-1998-0176, FORMAL ENFORCEMENT ACTION Business SIC classification: LOCAL TRUCKING WITH STORAGE
NORWELL MFG CO INC (82 STEVENS ST in TAUNTON, MA)
AIR MINOR (AIRS/AFS) CRITERIA AND HAZARDOUS AIR POLLUTANT INVENTORY (Inventory of air pollution sources) Small Quantity Generators, between 100 kg and 1000 kg of hazardous waste/month (Resource Conservation and Recovery Act (tracking hazardous waste)) - notification Business SIC classification: ELECTRIC LAMP BULBS AND TUBES Organizations: NORWELL MFG CO INC MICHAEL CORRAO (CONTACT/OWNER)
LALLY COLUMN (138 PLAIN DRIVE in TAUNTON, MA)
CRITERIA AND HAZARDOUS AIR POLLUTANT INVENTORY (Inventory of air pollution sources)
Housing units lacking complete kitchen facilities: 2.8%
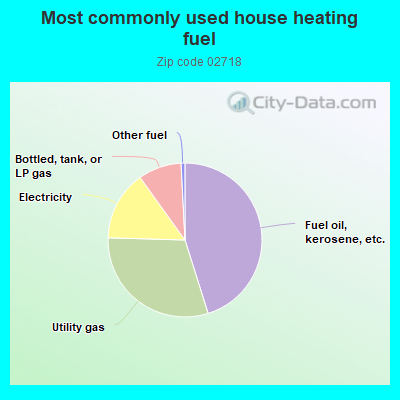
45.1%Fuel oil, kerosene, etc.
30.3%Utility gas
14.6%Electricity
9.1%Bottled, tank, or LP gas
0.8%Other fuel
Population in 1990: 4,800. Population change in the 1990s: +1,926 (+40.1%).
Place of birth for U.S.-born residents:
This state: 5,361
Northeast: 261
Midwest: 135
South: 290
West: 20
69% of the 02718 zip code residents lived in the same house 5 years ago. Out of people who lived in different houses, 52% lived in this county. Out of people who lived in different counties, 50% lived in Massachusetts.
95% of the 02718 zip code residents lived in the same house 1 year ago. Out of people who lived in different houses, 49% moved from this county. Out of people who lived in different houses, 51% moved from different county within same state.
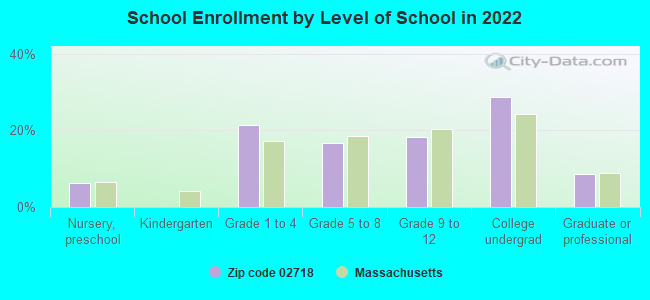
Private vs. public school enrollment:
Students in private schools in grades 1 to 8 (elementary and middle school): 23
Here:
4.2%
Massachusetts:
10.3%
Students in private schools in grades 9 to 12 (high school):
Here:
0.0%
Massachusetts:
12.3%
Students in private undergraduate colleges: 53
Here:
13.5%
Massachusetts:
51.2%
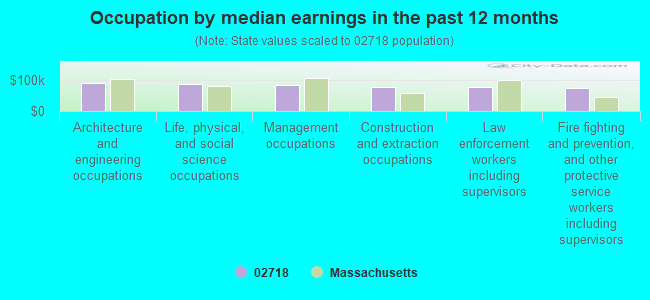
Occupation by median earnings in the past 12 months ($)
90,257Architecture and engineering occupations
88,313Life, physical, and social science occupations
85,402Management occupations
77,411Construction and extraction occupations
75,921Law enforcement workers including supervisors
74,752Fire fighting and prevention, and other protective service workers including supervisors
Companies with federal contracts located in this zip code:
PHOENIXX TPC, INC (250 CAPE HWY , RTE 44 in EAST TAUNTON, MA; small business)
$233,550 with Army for Chemicals. Signed on 2006-04-05. Completion date: 2006-04-05.
GREENSCAPE LAND DESIGN, INC (100 COTLEY STREET EAST in EAST TAUNTON, MA; small business) : $75,146 in 4 contractsin 2002
$26,353 with U.S. Army Corps of Engineers - civil program financing only for Landscaping/Groundskeeping Services. Signed on 2002-09-09. Completion date: 2002-10-31.
$24,231, same as above.Signed on 2002-06-17. Completion date: 2002-08-23.
$16,712, same as above.Signed on 2002-08-10. Completion date: 2002-08-23.
$7,850, same as above.Signed on 2002-10-25. Completion date: 2002-10-31.
J W FISHERS MFG INC (1953 COUNTY ST in EAST TAUNTON, MA; small business) 750 employees, $0 revenue. : $40,989 in 5 contractsfrom 2003 to 2006
Contracts for Miscellaneous Vessels, Electrical and Electronic Properties Measuring and Testing Instruments, Underwater Sound Equipment by U.S. Army Corps of Engineers - civil program financing only, Army, Navy Signed by year:2000: $0; 2001: $0; 2002: $0; 2003: $8,083; 2004: $23,686; 2005: $0; 2006: $9,220.
Biggest contracts:
$11,843 with U.S. Army Corps of Engineers - civil program financing only for Miscellaneous Vessels. Taking place in WA. Signed on 2004-12-23. Completion date: 2005-01-07.
$11,843 with Army for Miscellaneous Vessels. Taking place in WA. Signed on 2004-12-23. Completion date: 2005-01-07.
$9,220 with Navy for Electrical and Electronic Properties Measuring and Testing Instruments. Signed on 2006-02-10. Completion date: 2006-02-16.
$9,083 with Navy for Underwater Sound Equipment. Signed on 2003-02-13. Completion date: 2003-02-18.
Top industries in this zip code by the number of employees in 2005:
Professional, Scientific, and Technical Services: Direct Mail Advertising (100-249 employees: 1 establishment)
Management of Companies and Enterprises: Corporate, Subsidiary, and Regional Managing Offices (100-249: 1)
Accommodation and Food Services: Full-Service Restaurants (50-99: 1, 5-9: 1)
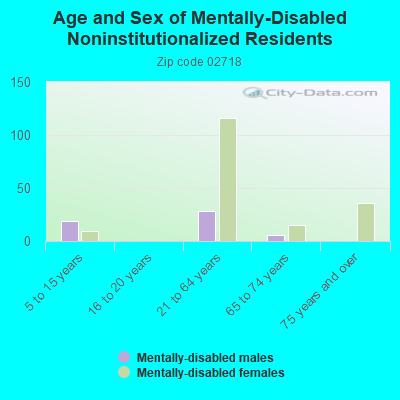
People in group quarters in 2000:
2 people in homes for the mentally retarded
Fatal accident statistics in 2014:
Fatal accident count: 1
Vehicles involved in fatal accidents: 1
Fatal accidents caused by drunken drivers: 1
Fatalities: 1
Persons involved in fatal accidents: 1
Pedestrians involved in fatal accidents: 0
Fatal accident statistics in 2013:
Fatal accident count: 1
Vehicles involved in fatal accidents: 1
Fatal accidents caused by drunken drivers: 0
Fatalities: 1
Persons involved in fatal accidents: 1
Pedestrians involved in fatal accidents: 0
Home Mortgage Disclosure Act Aggregated Statistics For Year 2009 (Based on 2 partial tracts)
A) FHA, FSA/RHS & VA Home Purchase Loans
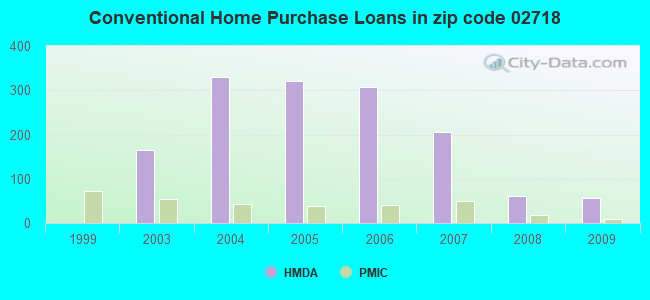
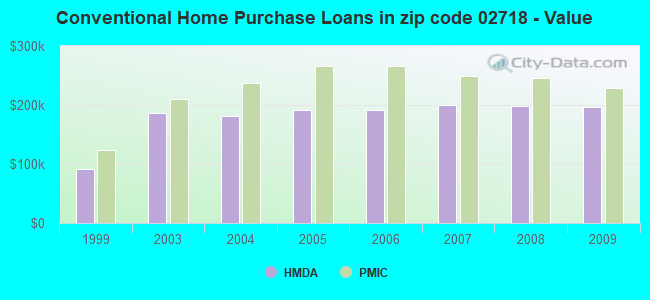
B) Conventional Home Purchase Loans
C) Refinancings
D) Home Improvement Loans
F) Non-occupant Loans on < 5 Family Dwellings (A B C & D)
Number
Average Value
Number
Average Value
Number
Average Value
Number
Average Value
Number
Average Value
LOANS ORIGINATED
73
$238,488
56
$196,028
372
$209,147
22
$118,825
19
$154,919
APPLICATIONS APPROVED, NOT ACCEPTED
2
$117,220
2
$171,175
30
$231,087
0
$0
2
$41,865
APPLICATIONS DENIED
19
$228,364
11
$215,660
128
$210,757
6
$71,013
6
$138,305
APPLICATIONS WITHDRAWN
6
$196,293
6
$200,945
50
$196,256
2
$18,605
2
$195,365
FILES CLOSED FOR INCOMPLETENESS
2
$232,575
4
$170,245
39
$214,542
2
$282,810
0
$0
Aggregated Statistics For Year 2008 (Based on 2 partial tracts)
A) FHA, FSA/RHS & VA Home Purchase Loans
B) Conventional Home Purchase Loans
C) Refinancings
D) Home Improvement Loans
F) Non-occupant Loans on < 5 Family Dwellings (A B C & D)
Number
Average Value
Number
Average Value
Number
Average Value
Number
Average Value
Number
Average Value
LOANS ORIGINATED
41
$245,463
61
$198,993
229
$220,786
39
$78,670
19
$193,111
APPLICATIONS APPROVED, NOT ACCEPTED
2
$237,225
9
$203,426
43
$233,787
15
$39,445
4
$136,290
APPLICATIONS DENIED
13
$233,434
22
$151,047
154
$262,574
37
$135,522
6
$159,082
APPLICATIONS WITHDRAWN
4
$273,042
7
$178,617
67
$232,186
7
$181,807
0
$0
FILES CLOSED FOR INCOMPLETENESS
2
$133,035
6
$172,105
22
$186,314
7
$70,437
0
$0
Aggregated Statistics For Year 2007 (Based on 2 partial tracts)
A) FHA, FSA/RHS & VA Home Purchase Loans
B) Conventional Home Purchase Loans
C) Refinancings
D) Home Improvement Loans
F) Non-occupant Loans on < 5 Family Dwellings (A B C & D)
G) Loans On Manufactured Home Dwelling (A B C & D)
Number
Average Value
Number
Average Value
Number
Average Value
Number
Average Value
Number
Average Value
Number
Average Value
LOANS ORIGINATED
6
$301,107
205
$200,173
331
$204,396
74
$75,455
13
$158,294
0
$0
APPLICATIONS APPROVED, NOT ACCEPTED
0
$0
19
$156,584
69
$165,701
11
$71,210
7
$195,629
0
$0
APPLICATIONS DENIED
4
$278,160
50
$208,424
218
$230,544
45
$95,718
9
$110,602
2
$93,030
APPLICATIONS WITHDRAWN
2
$209,315
39
$198,846
132
$198,591
9
$206,733
4
$164,198
0
$0
FILES CLOSED FOR INCOMPLETENESS
0
$0
9
$206,940
54
$281,467
6
$230,095
0
$0
0
$0
Aggregated Statistics For Year 2006 (Based on 2 partial tracts)
A) FHA, FSA/RHS & VA Home Purchase Loans
B) Conventional Home Purchase Loans
C) Refinancings
D) Home Improvement Loans
F) Non-occupant Loans on < 5 Family Dwellings (A B C & D)
G) Loans On Manufactured Home Dwelling (A B C & D)
Number
Average Value
Number
Average Value
Number
Average Value
Number
Average Value
Number
Average Value
Number
Average Value
LOANS ORIGINATED
6
$205,907
307
$191,466
489
$178,469
117
$74,265
41
$174,851
0
$0
APPLICATIONS APPROVED, NOT ACCEPTED
0
$0
20
$262,530
69
$164,703
20
$44,189
6
$153,810
0
$0
APPLICATIONS DENIED
0
$0
61
$170,474
259
$218,258
37
$50,689
19
$138,468
4
$69,772
APPLICATIONS WITHDRAWN
0
$0
22
$122,884
151
$193,108
7
$61,134
7
$63,791
0
$0
FILES CLOSED FOR INCOMPLETENESS
0
$0
2
$320,025
32
$246,762
0
$0
0
$0
0
$0
Aggregated Statistics For Year 2005 (Based on 2 partial tracts)
A) FHA, FSA/RHS & VA Home Purchase Loans
B) Conventional Home Purchase Loans
C) Refinancings
D) Home Improvement Loans
F) Non-occupant Loans on < 5 Family Dwellings (A B C & D)
G) Loans On Manufactured Home Dwelling (A B C & D)
Number
Average Value
Number
Average Value
Number
Average Value
Number
Average Value
Number
Average Value
Number
Average Value
LOANS ORIGINATED
4
$274,438
322
$191,226
636
$197,306
99
$78,014
33
$195,983
2
$322,815
APPLICATIONS APPROVED, NOT ACCEPTED
0
$0
32
$184,141
60
$190,588
11
$85,925
0
$0
2
$93,960
APPLICATIONS DENIED
2
$227,925
43
$167,887
238
$217,268
43
$161,093
6
$117,218
4
$176,292
APPLICATIONS WITHDRAWN
2
$227,925
41
$217,418
294
$194,388
43
$104,626
17
$249,102
0
$0
FILES CLOSED FOR INCOMPLETENESS
0
$0
17
$265,847
41
$224,588
0
$0
4
$278,625
0
$0
Aggregated Statistics For Year 2004 (Based on 2 partial tracts)
A) FHA, FSA/RHS & VA Home Purchase Loans
B) Conventional Home Purchase Loans
C) Refinancings
D) Home Improvement Loans
E) Loans on Dwellings For 5+ Families
F) Non-occupant Loans on < 5 Family Dwellings (A B C & D)
Number
Average Value
Number
Average Value
Number
Average Value
Number
Average Value
Number
Average Value
Number
Average Value
LOANS ORIGINATED
11
$248,475
331
$181,288
644
$179,762
93
$96,611
0
$0
20
$182,246
APPLICATIONS APPROVED, NOT ACCEPTED
0
$0
41
$223,045
74
$170,848
22
$41,779
0
$0
2
$181,410
APPLICATIONS DENIED
4
$209,782
54
$191,056
199
$196,158
45
$132,557
0
$0
7
$209,450
APPLICATIONS WITHDRAWN
2
$169,315
19
$195,167
260
$195,349
26
$94,604
2
$116,290
0
$0
FILES CLOSED FOR INCOMPLETENESS
0
$0
11
$164,240
33
$186,680
9
$54,784
0
$0
2
$139,545
Aggregated Statistics For Year 2003 (Based on 2 partial tracts)
A) FHA, FSA/RHS & VA Home Purchase Loans
B) Conventional Home Purchase Loans
C) Refinancings
D) Home Improvement Loans
F) Non-occupant Loans on < 5 Family Dwellings (A B C & D)
Number
Average Value
Number
Average Value
Number
Average Value
Number
Average Value
Number
Average Value
LOANS ORIGINATED
26
$195,649
164
$185,686
1,351
$153,372
47
$51,582
43
$155,079
APPLICATIONS APPROVED, NOT ACCEPTED
0
$0
13
$216,259
143
$152,517
17
$76,832
2
$113,495
APPLICATIONS DENIED
4
$260,020
20
$144,940
188
$159,725
35
$50,927
6
$184,200
APPLICATIONS WITHDRAWN
0
$0
13
$234,292
246
$161,577
17
$53,301
2
$93,030
FILES CLOSED FOR INCOMPLETENESS
0
$0
2
$146,985
30
$177,563
0
$0
0
$0
Aggregated Statistics For Year 1999 (Based on 1 partial tract)


 Nearest zip codes: 02347, 02779, 02767, 02702, 02717, 02324.