Estimated zip code population in 2022: 15,470 Zip code population in 2010: 13,708 Zip code population in 2000: 13,425
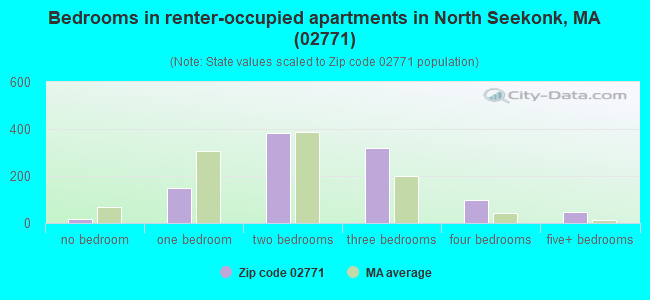
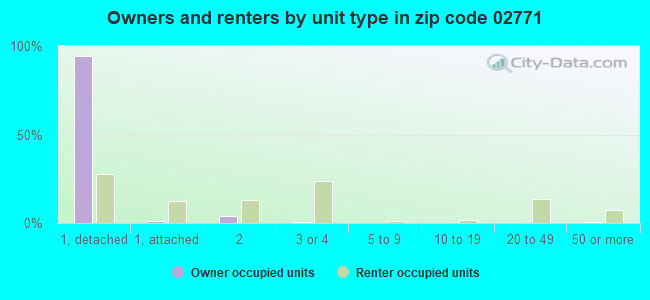
Houses and condos: 6,339 Renter-occupied apartments: 1,014
% of renters here:
17%
State:
38%
March 2022 cost of living index in zip code 02771: 131.1 (high, U.S. average is 100)
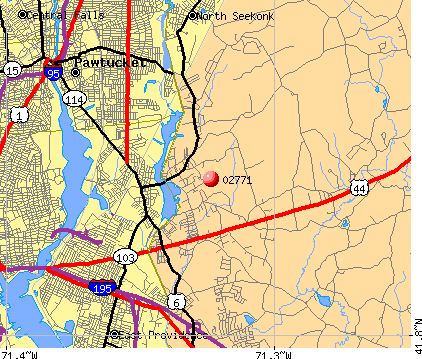
Land area: 18.4 sq. mi. Water area: 0.2 sq. mi.
Population density: 842 people per square mile
(low).
OSM Map
Google Map
MSN Map
OSM Map
General Map
Google Map
MSN Map
OSM Map
Google Map
MSN Map
OSM Map
Google Map
MSN Map
Please wait while loading the map...
Real estate property taxes paid for housing units in 2022:
This zip code:
1.0% ($4,642)
Massachusetts:
1.0% ($5,536)
Median real estate property taxes paid for housing units with mortgages in 2022: $4,549 (0.9%) Median real estate property taxes paid for housing units with no mortgage in 2022: $4,891 (1.1%)
Averages for the 2020 tax year for zip code 02771, filed in 2021:
Average Adjusted Gross Income (AGI) in 2020: $90,873 (Individual Income Tax Returns)
Here:
$90,873
State:
$105,130
Salary/wage: $72,635 (reported on 82.3% of returns)
Here:
$72,635
State:
$82,951
(% of AGI for various income ranges: 1170.4% for AGIs below $25k, 3560.3% for AGIs $25k-50k, 6578.2% for AGIs $50k-75k, 9553.0% for AGIs $75k-100k, 18359.7% for AGIs $100k-200k, 63704.0% for AGIs over 200k)
Taxable interest for individuals: $1,503 (reported on 41.7% of returns)
This zip code:
$1,503
Massachusetts:
$2,361
(% of AGI for various income ranges: 31.4% for AGIs below $25k, 51.3% for AGIs $25k-50k, 58.7% for AGIs $50k-75k, 85.2% for AGIs $75k-100k, 112.5% for AGIs $100k-200k, 996.0% for AGIs over 200k)
Ordinary dividends: $4,827 (reported on 24.7% of returns)
Here:
$4,827
State:
$10,365
(% of AGI for various income ranges: 34.5% for AGIs below $25k, 50.0% for AGIs $25k-50k, 82.5% for AGIs $50k-75k, 128.4% for AGIs $75k-100k, 190.6% for AGIs $100k-200k, 2679.0% for AGIs over 200k)
Net capital gain/loss in AGI: +$18,623 (reported on 21.7% of returns)
Here:
+$18,623
State:
+$48,178
(% of AGI for various income ranges: 15.0% for AGIs below $25k, 45.7% for AGIs $25k-50k, 109.3% for AGIs $50k-75k, 157.2% for AGIs $75k-100k, 592.5% for AGIs $100k-200k, 12302.5% for AGIs over 200k)
Profit/loss from business: +$17,069 (reported on 15.1% of returns)
Here:
+$17,069
State:
+$20,792
(% of AGI for various income ranges: 107.3% for AGIs below $25k, 135.7% for AGIs $25k-50k, 183.3% for AGIs $50k-75k, 457.4% for AGIs $75k-100k, 604.1% for AGIs $100k-200k, 3803.0% for AGIs over 200k)
Taxable individual retirement arrangement distribution: $18,241 (reported on 11.6% of returns)
02771:
$18,241
Massachusetts:
$22,790
(% of AGI for various income ranges: 105.7% for AGIs below $25k, 157.6% for AGIs $25k-50k, 256.0% for AGIs $50k-75k, 411.0% for AGIs $75k-100k, 608.3% for AGIs $100k-200k, 1597.5% for AGIs over 200k)
Self-employed (Keogh) retirement plans: $16,433 (reported on 0.7% of returns)
02771:
$16,433
Massachusetts:
$26,868
(% of AGI for various income ranges: 36.3% for AGIs $100k-200k, 293.5% for AGIs over 200k)
Total itemized deductions: $27,881 (reported on 11.5% of returns)
Here:
$27,881
State:
$36,722
(% of AGI for various income ranges: 66.0% for AGIs below $25k, 153.4% for AGIs $25k-50k, 420.6% for AGIs $50k-75k, 550.2% for AGIs $75k-100k, 857.3% for AGIs $100k-200k, 3936.5% for AGIs over 200k)
Charity contributions: $5,367 (reported on 8.8% of returns)
Here:
$5,367
State:
$12,529
(% of AGI for various income ranges: 1.6% for AGIs below $25k, 12.8% for AGIs $25k-50k, 32.0% for AGIs $50k-75k, 63.9% for AGIs $75k-100k, 121.1% for AGIs $100k-200k, 881.0% for AGIs over 200k)
Taxes paid: $8,662 (reported on 11.4% of returns)
02771:
$8,662
State:
$8,782
(% of AGI for various income ranges: 15.8% for AGIs below $25k, 47.9% for AGIs $25k-50k, 133.7% for AGIs $50k-75k, 189.7% for AGIs $75k-100k, 287.2% for AGIs $100k-200k, 1024.0% for AGIs over 200k)
Earned income credit: $1,560 (reported on 6.4% of returns)
Here:
$1,560
State:
$1,909
(% of AGI for various income ranges: 35.3% for AGIs below $25k, 32.3% for AGIs $25k-50k)
Percentage of individuals using paid preparers for their 2020 taxes: 93.4%
Here:
93%
State:
92%
(% for various income ranges: 91.5% for AGIs below $25k, 93.5% for AGIs $25k-50k, 93.4% for AGIs $50k-75k, 94.8% for AGIs $75k-100k, 94.2% for AGIs $100k-200k, 95.0% for AGIs over 200k)
Averages for the 2012 tax year for zip code 02771, filed in 2013:
Average Adjusted Gross Income (AGI) in 2012: $71,315 (Individual Income Tax Returns)
Here:
$71,315
State:
$81,425
Salary/wage: $59,794 (reported on 84.7% of returns)
Here:
$59,794
State:
$64,752
(% of AGI for various income ranges: 70.4% for AGIs below $25k, 76.3% for AGIs $25k-50k, 72.7% for AGIs $50k-75k, 77.4% for AGIs $75k-100k, 79.7% for AGIs $100k-200k, 52.4% for AGIs over 200k)
Taxable interest for individuals: $1,285 (reported on 50.6% of returns)
This zip code:
$1,285
Massachusetts:
$2,136
(% of AGI for various income ranges: 1.9% for AGIs below $25k, 1.1% for AGIs $25k-50k, 0.9% for AGIs $50k-75k, 0.6% for AGIs $75k-100k, 0.7% for AGIs $100k-200k, 1.1% for AGIs over 200k)
Ordinary dividends: $3,908 (reported on 28.0% of returns)
Here:
$3,908
State:
$9,473
(% of AGI for various income ranges: 2.4% for AGIs below $25k, 0.9% for AGIs $25k-50k, 1.6% for AGIs $50k-75k, 1.2% for AGIs $75k-100k, 1.0% for AGIs $100k-200k, 2.5% for AGIs over 200k)
Net capital gain/loss in AGI: +$5,929 (reported on 20.0% of returns)
Here:
+$5,929
State:
+$31,437
(% of AGI for various income ranges: 0.7% for AGIs $50k-75k, 0.4% for AGIs $75k-100k, 1.2% for AGIs $100k-200k, 4.8% for AGIs over 200k)
Profit/loss from business: +$16,022 (reported on 15.0% of returns)
Here:
+$16,022
State:
+$20,662
(% of AGI for various income ranges: 6.8% for AGIs below $25k, 3.9% for AGIs $25k-50k, 3.6% for AGIs $50k-75k, 3.4% for AGIs $75k-100k, 3.1% for AGIs $100k-200k, 2.7% for AGIs over 200k)
Taxable individual retirement arrangement distribution: $13,033 (reported on 12.4% of returns)
02771:
$13,033
Massachusetts:
$18,892
(% of AGI for various income ranges: 5.6% for AGIs below $25k, 3.2% for AGIs $25k-50k, 3.5% for AGIs $50k-75k, 2.7% for AGIs $75k-100k, 1.8% for AGIs $100k-200k, 0.9% for AGIs over 200k)
Self-employment retirement plans: $14,550 (reported on 0.8% of returns)
02771:
$14,550
Massachusetts:
$20,669
(% of AGI for various income ranges: 0.3% for AGIs $25k-50k, 0.4% for AGIs $100k-200k)
Total itemized deductions: $23,635 (20% of AGI, reported on 45.8% of returns)
Here:
$23,635
State:
$28,907
Here:
19.9% of AGI
State:
18.2% of AGI
(% of AGI for various income ranges: 13.8% for AGIs below $25k, 13.7% for AGIs $25k-50k, 15.9% for AGIs $50k-75k, 17.5% for AGIs $75k-100k, 16.7% for AGIs $100k-200k, 12.2% for AGIs over 200k)
Charity contributions: $2,478 (reported on 38.9% of returns)
Here:
$2,478
State:
$4,208
(% of AGI for various income ranges: 0.7% for AGIs below $25k, 1.0% for AGIs $25k-50k, 1.1% for AGIs $50k-75k, 1.3% for AGIs $75k-100k, 1.4% for AGIs $100k-200k, 1.7% for AGIs over 200k)
Taxes paid: $11,000 (reported on 45.8% of returns)
02771:
$11,000
State:
$13,303
(% of AGI for various income ranges: 3.8% for AGIs below $25k, 4.4% for AGIs $25k-50k, 6.3% for AGIs $50k-75k, 7.2% for AGIs $75k-100k, 8.2% for AGIs $100k-200k, 7.6% for AGIs over 200k)
Earned income credit: $1,715 (reported on 8.5% of returns)
Here:
$1,715
State:
$1,971
(% of AGI for various income ranges: 2.9% for AGIs below $25k, 0.6% for AGIs $25k-50k)
Percentage of individuals using paid preparers for their 2012 taxes: 66.5%
Here:
66%
State:
56%
(% for various income ranges: 58.6% for AGIs below $25k, 64.3% for AGIs $25k-50k, 71.4% for AGIs $50k-75k, 72.1% for AGIs $75k-100k, 71.9% for AGIs $100k-200k, 82.1% for AGIs over 200k)
Averages for the 2004 tax year for zip code 02771, filed in 2005:
Average Adjusted Gross Income (AGI) in 2004: $58,756 (Individual Income Tax Returns)
Here:
$58,756
State:
$62,877
Salary/wage: $50,809 (reported on 86.9% of returns)
Here:
$50,809
State:
$52,969
(% of AGI for various income ranges: 140.5% for AGIs below $10k, 71.6% for AGIs $10k-25k, 79.7% for AGIs $25k-50k, 79.5% for AGIs $50k-75k, 83.6% for AGIs $75k-100k, 68.0% for AGIs over 100k)
Taxable interest for individuals: $1,423 (reported on 60.9% of returns)
This zip code:
$1,423
Massachusetts:
$1,945
(% of AGI for various income ranges: 6.5% for AGIs below $10k, 3.3% for AGIs $10k-25k, 1.7% for AGIs $25k-50k, 1.3% for AGIs $50k-75k, 1.2% for AGIs $75k-100k, 1.3% for AGIs over 100k)
Taxable dividends: $2,448 (reported on 33.0% of returns)
Here:
$2,448
State:
$5,323
(% of AGI for various income ranges: 4.1% for AGIs below $10k, 1.5% for AGIs $10k-25k, 1.2% for AGIs $25k-50k, 0.9% for AGIs $50k-75k, 1.1% for AGIs $75k-100k, 1.6% for AGIs over 100k)
Net capital gain/loss: +$9,156 (reported on 25.3% of returns)
Here:
+$9,156
State:
+$20,377
(% of AGI for various income ranges: -2.0% for AGIs below $10k, -0.1% for AGIs $10k-25k, 0.2% for AGIs $25k-50k, 0.9% for AGIs $50k-75k, 1.1% for AGIs $75k-100k, 7.8% for AGIs over 100k)
Profit/loss from business: +$14,468 (reported on 15.1% of returns)
Here:
+$14,468
State:
+$17,837
(% of AGI for various income ranges: 4.3% for AGIs below $10k, 5.2% for AGIs $10k-25k, 3.9% for AGIs $25k-50k, 4.8% for AGIs $50k-75k, 3.7% for AGIs $75k-100k, 3.1% for AGIs over 100k)
IRA payment deduction: $3,309 (reported on 3.6% of returns)
02771:
$3,309
Massachusetts:
$3,100
(% of AGI for various income ranges: 0.3% for AGIs $10k-25k, 0.4% for AGIs $25k-50k, 0.3% for AGIs $50k-75k, 0.2% for AGIs $75k-100k, 0.1% for AGIs over 100k)
Self-employed pension: $10,745 (reported on 1.5% of returns)
Here:
$10,745
Massachusetts:
$14,516
(% of AGI for various income ranges: 0.2% for AGIs $25k-50k, 0.1% for AGIs $50k-75k, 0.2% for AGIs $75k-100k, 0.4% for AGIs over 100k)
Total itemized deductions: $19,702 (20% of AGI, reported on 47.8% of returns)
Here:
$19,702
State:
$22,573
Here:
20.3% of AGI
State:
19.5% of AGI
(% of AGI for various income ranges: 13.5% for AGIs below $10k, 12.9% for AGIs $10k-25k, 15.5% for AGIs $25k-50k, 18.8% for AGIs $50k-75k, 19.0% for AGIs $75k-100k, 14.4% for AGIs over 100k)
Charity contributions deductions: $2,198 (2% of AGI, reported on 44.5% of returns)
Here:
$2,198
State:
$3,295
Here:
2.2% of AGI
State:
2.7% of AGI
(% of AGI for various income ranges: 0.5% for AGIs below $10k, 0.8% for AGIs $10k-25k, 1.3% for AGIs $25k-50k, 1.6% for AGIs $50k-75k, 1.7% for AGIs $75k-100k, 1.9% for AGIs over 100k)
Total tax: $9,149 (reported on 82.8% of returns)
02771:
$9,149
State:
$11,494
(% of AGI for various income ranges: 4.0% for AGIs below $10k, 4.8% for AGIs $10k-25k, 7.6% for AGIs $25k-50k, 8.6% for AGIs $50k-75k, 9.7% for AGIs $75k-100k, 18.3% for AGIs over 100k)
Earned income credit: $1,234 (reported on 5.8% of returns)
Here:
$1,234
State:
$1,518
Percentage of individuals using paid preparers for their 2004 taxes: 66.4%
Here:
66%
State:
58%
(% for various income ranges: 54.7% for AGIs below $10k, 65.7% for AGIs $10k-25k, 67.8% for AGIs $25k-50k, 70.4% for AGIs $50k-75k, 69.6% for AGIs $75k-100k, 73.0% for AGIs over 100k)
Likely homosexual households (counted as self-reported same-sex unmarried-partner households)
Lesbian couples: 0.4% of all households
Gay men: 0.0% of all households
Household received Food Stamps/SNAP in the past 12 months: 454 Household did not receive Food Stamps/SNAP in the past 12 months: 5,355
Women who had a birth in the past 12 months: 155 (96 now married, 55 unmarried) Women who did not have a birth in the past 12 months: 3,114 (1,488 now married, 1,604 unmarried)
Housing units in zip code 02771 with a mortgage: 3,314 (648 second mortgage, 593 both second mortgage and home equity loan) Houses without a mortgage: 145
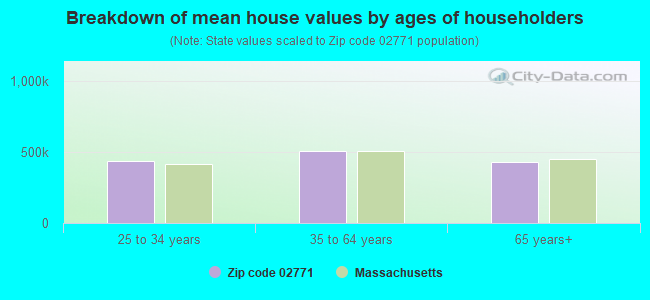
Median monthly owner costs for units with a mortgage: $2,150 Median monthly owner costs for units without a mortgage: $856
Residents with income below the poverty level in 2022:
This zip code:
4.4%
Whole state:
10.4%
Residents with income below 50% of the poverty level in 2022:
This zip code:
1.5%
Whole state:
5.1%
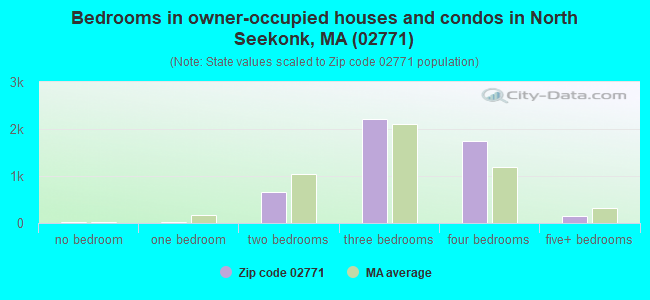
Median number of rooms in houses and condos:
Here:
6.9
State:
6.5
Median number of rooms in apartments:
Here:
4.6
State:
4.0
Notable locations in this zip code not listed on our city pages
Notable locations in zip code 02771: Firefly Country Club (A), Ledgemont Country Club (B), Attleboro Sewage Disposal (C), Pawtucket Country Club (D), Seekonk Townhall (E), Seekonk Fire Department (F), Seekonk Fire Department Station 2 (G), Seekonk Fire Department Headquarters (H), Seekonk Public Library (I), Seekonk Middle School Library (J). Display/hide their locations on the map
Size of family households: 1,930 2-persons, 1,053 3-persons, 1,003 4-persons, 199 5-persons, 103 6-persons, 112 7-or-more-persons
Size of nonfamily households: 1,081 1-person, 327 2-persons, 51 4-persons
2,027 married couples with children.
516 single-parent households (125 men, 391 women).
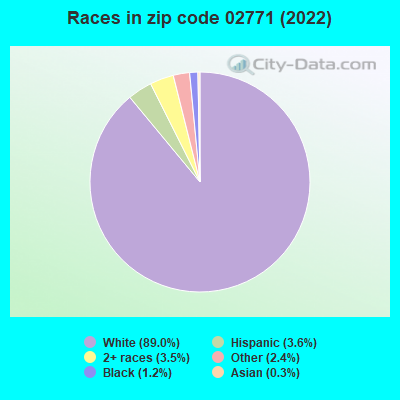
87.9% of residents of 02771 zip code speak English at home.
1.5% of residents speak Spanish at home (55% very well, 41% well, 5% not well).
9.6% of residents speak other Indo-European language at home (78% very well, 10% well, 12% not well).
0.3% of residents speak Asian or Pacific Island language at home (100% very well).
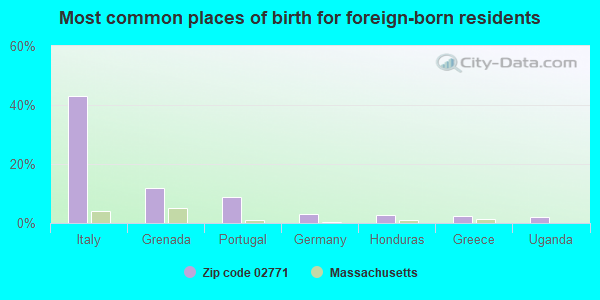
Foreign born population: 1,177 (7.6%) (80.1% of them are naturalized citizens)
This zip code:
7.6%
Whole state:
18.0%
43%Italy
12%Grenada
9%Portugal
3%Germany
3%Honduras
2%Greece
2%Uganda
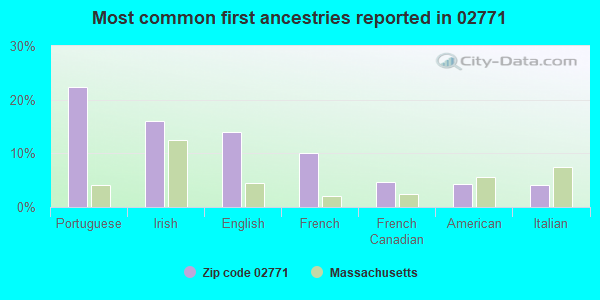
22%Portuguese
16%Irish
14%English
10%French
5%French Canadian
4%American
4%Italian
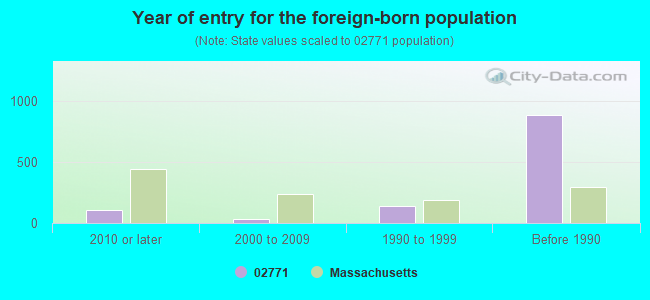
Year of entry for the foreign-born population
1092010 or later
312000 to 2009
1381990 to 1999
886Before 1990
Major facilities with environmental interests located in this zip code:
NORTH (2 NORTH STREET in SEEKONK, MA)
(National Center for Education Statistics) - STATE ID-265020 Organizations: SEEKONK (SCHOOL DISTRICT)
L.K POWDER COATING (945 TAUNTON AVENUE in SEEKONK, MA)
National Pollutant Discharge Elimination System NON-MAJOR (Tracking pollutant discharge elimination systems) - permit National Pollutant Discharge Elimination System NON-MAJOR (Tracking pollutant discharge elimination systems) - permit Business SIC classification: HEAVY CONSTRUCTION Alternative names: EAGLE RIDGE ESTATES DEV, L. K POWDER, L. K. POWDER COATING (LAZY K C
AFRICO TRUCKING (19 INDUSTRIAL WAY in SEEKONK, MA)
(Resource Conservation and Recovery Act (tracking hazardous waste)) Organizations: CARL R AFRICO (CONTACT/OWNER)
Alternative names: AFRICO INC
ATTLEBORO DYEING & FINISHING (FORMER) (36 MAPLE AVE in SEEKONK, MA)
SUPERFUND (Superfund database) (Resource Conservation and Recovery Act (tracking hazardous waste)) Organizations: ATTLEBORO DYEING & FINISHING C (CONTACT/OPERATOR)
BLACK & DECKER US INC (120 HIGHLAND AVE in SEEKONK, MA)
(Resource Conservation and Recovery Act (tracking hazardous waste)) Organizations: BLANK & DECKER US INC (CONTACT/OWNER)
BOAT TRANSIT INC (RTE 6 in SEEKONK, MA)
(Resource Conservation and Recovery Act (tracking hazardous waste)) Organizations: HARRY THOMASEN (CONTACT/OWNER)
CABRAL AUTO BODY (1903 FALL RIVER AVE in SEEKONK, MA)
Conditionally Exempt Small Quantity Generators, less than 100 kg/month of hazardous waste (Resource Conservation and Recovery Act (tracking hazardous waste)) - notification Organizations: RICHARD CABRAL (CONTACT/OWNER)
MILDRED AITKENS ELEMENTARY SCHOOL (165 NEWMAN AVENUE in SEEKONK, MA)
AIR MINOR (AIRS/AFS) CRITERIA AND HAZARDOUS AIR POLLUTANT INVENTORY (Inventory of air pollution sources) Business SIC classification: ELEMENTARY AND SECONDARY SCHOOLS Alternative names: M. AITKENS SCHOOL, MILDRED AITKEN SCHOOL
JIFFY LUBE #1234 (999 FALL RIVER AVE in SEEKONK, MA)
Conditionally Exempt Small Quantity Generators, less than 100 kg/month of hazardous waste (Resource Conservation and Recovery Act (tracking hazardous waste)) - notification Business NAICS classification: GENERAL AUTOMOTIVE REPAIR. Organizations: JK DEVELOPMENT (CONTACT/OWNER)
JOHNSON AND WALES INN (213 TAUNTON AVE in SEEKONK, MA)
AIR MINOR (AIRS/AFS) CRITERIA AND HAZARDOUS AIR POLLUTANT INVENTORY (Inventory of air pollution sources) Business SIC classification: HOTELS AND MOTELS
LEDGEMONT COUNTRY CLUB (131 BROWN AVE in SEEKONK, MA)
(Resource Conservation and Recovery Act (tracking hazardous waste))
Housing units lacking complete plumbing facilities: 0.4% Housing units lacking complete kitchen facilities: 1.7%
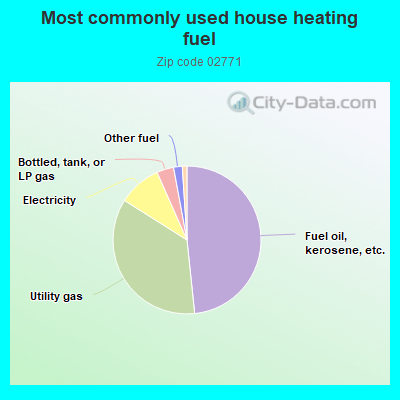
48.3%Fuel oil, kerosene, etc.
35.6%Utility gas
9.4%Electricity
3.7%Bottled, tank, or LP gas
1.9%Other fuel
1.0%Wood
Population in 1990: 13,375. Population change in the 1990s: +50 (+0.4%).
Place of birth for U.S.-born residents:
This state: 4,428
Northeast: 8,996
Midwest: 164
South: 361
West: 334
73% of the 02771 zip code residents lived in the same house 5 years ago. Out of people who lived in different houses, 49% lived in this county. Out of people who lived in different counties, 50% lived in Massachusetts.
95% of the 02771 zip code residents lived in the same house 1 year ago. Out of people who lived in different houses, 21% moved from this county. Out of people who lived in different houses, 15% moved from different county within same state. Out of people who lived in different houses, 71% moved from different state. Out of people who lived in different houses, 3% moved from abroad.
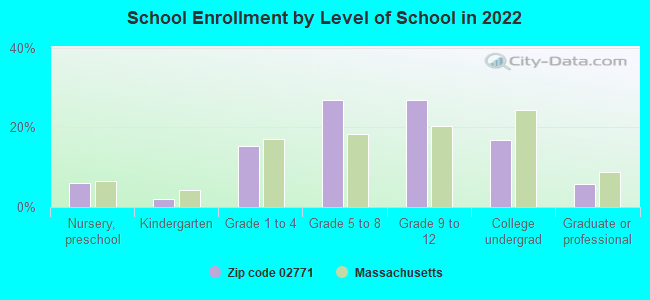
Private vs. public school enrollment:
Students in private schools in grades 1 to 8 (elementary and middle school): 128
Here:
9.4%
Massachusetts:
10.3%
Students in private schools in grades 9 to 12 (high school): 161
Here:
18.4%
Massachusetts:
12.3%
Students in private undergraduate colleges: 404
Here:
72.7%
Massachusetts:
51.2%
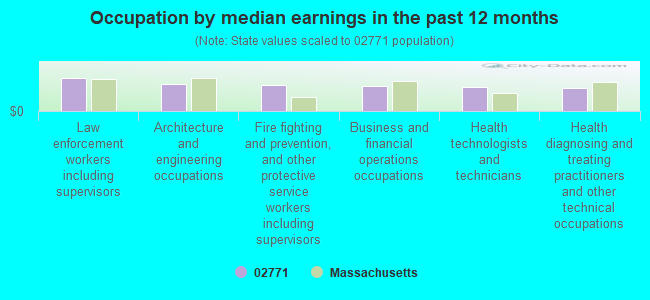
Occupation by median earnings in the past 12 months ($)
115,067Law enforcement workers including supervisors
96,418Architecture and engineering occupations
90,273Fire fighting and prevention, and other protective service workers including supervisors
87,785Business and financial operations occupations
82,869Health technologists and technicians
80,642Health diagnosing and treating practitioners and other technical occupations
Companies with federal contracts located in this zip code (SEEKONK, MA):
NUWATER INC. (96 POND ST., UNIT A; small business) : $758,521 in 7 contractsfrom 1999 to 2003
Contracts for Maintenance, Repair or Alteration of Real Property -- Miscellaneous Buildings, Maintenance, Repair or Alteration of Real Property -- Other Industrial Buildings, Construction of Structures and Facilities -- Other Administrative Facilities and Service Buildings by Navy, United States Coast Guard (disused code: now 7008) Signed by year:2000: $3,500; 2001: $0; 2002: $675,583; 2003: -$2,562; 2004: $0; 2005: $0; 2006: $0.
Biggest contracts:
$620,300 with Navy for Maintenance, Repair or Alteration of Real Property -- Miscellaneous Buildings. Taking place in PA. Signed on 2002-03-28. Completion date: 2003-01-28.
$82,000 with United States Coast Guard (disused code: now 7008) for Maintenance, Repair or Alteration of Real Property -- Other Industrial Buildings. Signed on 1999-10-15. Completion date: 2000-10-15.
$55,283 with Navy for Maintenance, Repair or Alteration of Real Property -- Miscellaneous Buildings. Taking place in PA. Signed on 2002-09-26. Completion date: 2003-01-28.
$5,000 with United States Coast Guard (disused code: now 7008) for Maintenance, Repair or Alteration of Real Property -- Other Industrial Buildings. Signed on 2000-04-15. Completion date: 2000-10-15.
AMARAL CUSTOM FABRICATIONS (40 MEAD STREET; small business)
$178,472 with Navy for Marine Hardware and Hull Items. Signed on 2001-06-18. Completion date: 2001-09-17.
AMERICA'S PRIDE, INC (75 COUNTY ST) : $58,746 in 9 contractsfrom 2003 to 2005
Contracts for Vehicular Brake, Steering, Axle, Wheel, and Track Components, Bending and Forming Machines, Motor Vehicle Maintenance and Repair Shop Specialized Equipment, Compressors and Vacuum Pumps, and moreby Navy, Army, Transportation Security Administration Signed by year:2000: $0; 2001: $0; 2002: $0; 2003: $4,500; 2004: $31,048; 2005: $23,198; 2006: $0.
Biggest contracts:
$13,000 with Navy for Vehicular Brake, Steering, Axle, Wheel, and Track Components. Signed on 2005-01-31. Completion date: 2005-02-28.
$9,270 with Army for Bending and Forming Machines. Signed on 2004-09-17. Completion date: 2004-10-29.
$8,723 with Army for Motor Vehicle Maintenance and Repair Shop Specialized Equipment. Signed on 2004-05-06. Completion date: 2004-06-07.
$6,460, same as above.Signed on 2004-09-22. Completion date: 2004-11-15.
CONLON MOVING & STORAGE INC (55 MEAD ST; small business) : $24,242 in 3 contractsfrom 2004 to 2005
$17,102 with U.S. Fish and Wildlife Service for Other Cargo and Freight Services. Taking place in RI. Signed on 2004-11-16. Completion date: 2004-11-16.
$6,384 with Navy for Preparation and Disposal of Excess and Surplus Property. Taking place in RI. Signed on 2005-06-24. Completion date: 2005-07-06.
$756, same as above.Signed on 2005-08-02. Completion date: 2005-07-06.
MANCINI, ADAM (27 JOHN ALDEN RD; small business) : $19,525 in 2 contractsfrom 2003 to 2004
$14,952 with Army for Technical Assistance. Signed on 2003-07-28. Completion date: 2004-07-31.
$4,573, same as above.Signed on 2004-03-09. Completion date: 2004-07-31.
DON-MAR CREATIONS INC (175 HIGHLAND AVE)
$5,220 with Army for Miscellaneous Service and Trade Equipment. Signed on 2003-09-30. Completion date: 2003-10-30.
Top industries in this zip code by the number of employees in 2005:
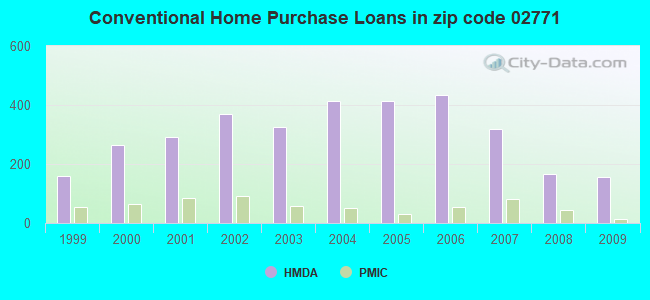
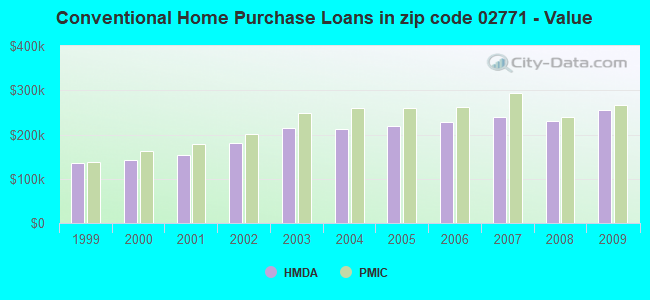
Detailed PMIC statistics for the following Tracts:6321.00
, 6322.00
2002 - 2018 National Fire Incident Reporting System (NFIRS) incidents
According to the data from the years 2002 - 2018 the average number of fire incidents per year is 74. The highest number of reported fire incidents - 93 took place in 2002, and the least - 51 in 2018. The data has a dropping trend.
When looking into fire subcategories, the most reports belonged to: Outside Fires (45.3%), and Structure Fires (31.7%).
Fire incident types reported to NFIRS in Zip Code 02771


 Nearest zip codes: 02916, 02914, 02861, 02906, 02915, 02860.
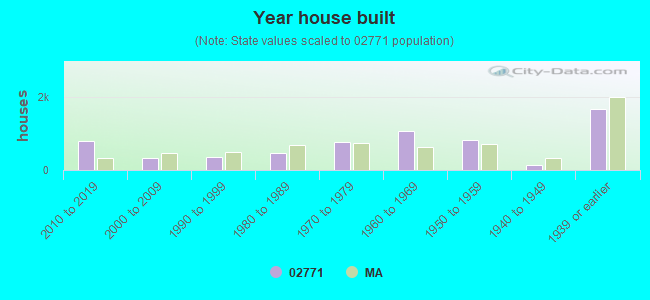


 According to the data from the years 2002 - 2018 the average number of fire incidents per year is 74. The highest number of reported fire incidents - 93 took place in 2002, and the least - 51 in 2018. The data has a dropping trend.
 When looking into fire subcategories, the most reports belonged to: Outside Fires (45.3%), and Structure Fires (31.7%).