Estimated zip code population in 2022: 18,898 Zip code population in 2010: 17,020 Zip code population in 2000: 14,918
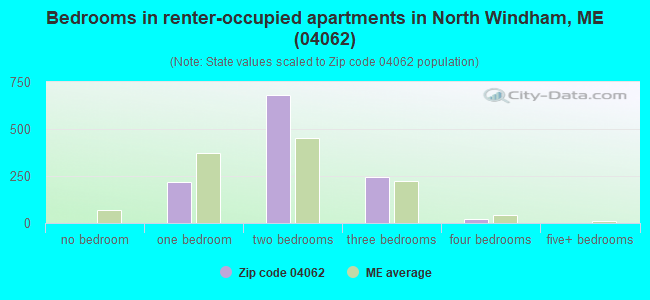
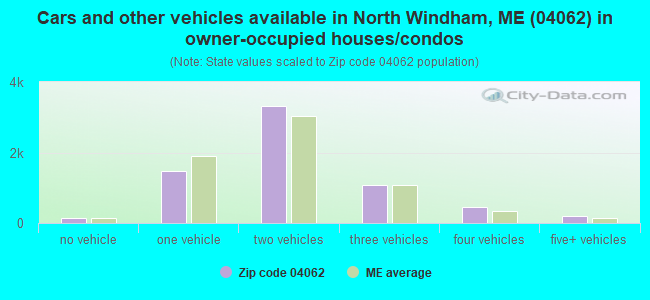
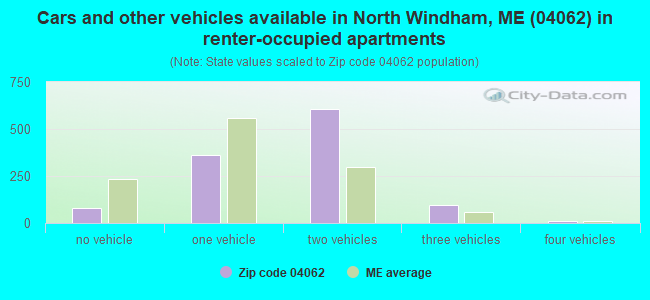
Houses and condos: 8,480 Renter-occupied apartments: 1,163
% of renters here:
15%
State:
26%
March 2022 cost of living index in zip code 04062: 99.9 (near average, U.S. average is 100)
Land area: 47.0 sq. mi. Water area: 2.8 sq. mi.
Population density: 402 people per square mile
(low).
OSM Map
Google Map
MSN Map
OSM Map
General Map
Google Map
MSN Map
OSM Map
Google Map
MSN Map
OSM Map
Google Map
MSN Map
Please wait while loading the map...
Real estate property taxes paid for housing units in 2022:
This zip code:
0.9% ($3,453)
Maine:
1.0% ($2,785)
Median real estate property taxes paid for housing units with mortgages in 2022: $3,471 (0.9%) Median real estate property taxes paid for housing units with no mortgage in 2022: $3,437 (0.9%)
Averages for the 2020 tax year for zip code 04062, filed in 2021:
Average Adjusted Gross Income (AGI) in 2020: $75,069 (Individual Income Tax Returns)
Here:
$75,069
State:
$68,227
Salary/wage: $61,964 (reported on 84.9% of returns)
Here:
$61,964
State:
$55,127
(% of AGI for various income ranges: 1138.8% for AGIs below $25k, 3711.4% for AGIs $25k-50k, 6672.4% for AGIs $50k-75k, 9875.2% for AGIs $75k-100k, 18412.6% for AGIs $100k-200k, 71628.3% for AGIs over 200k)
Taxable interest for individuals: $913 (reported on 39.1% of returns)
This zip code:
$913
Maine:
$1,162
(% of AGI for various income ranges: 17.6% for AGIs below $25k, 17.1% for AGIs $25k-50k, 25.2% for AGIs $50k-75k, 44.0% for AGIs $75k-100k, 79.1% for AGIs $100k-200k, 1217.5% for AGIs over 200k)
Ordinary dividends: $4,309 (reported on 17.3% of returns)
Here:
$4,309
State:
$7,695
(% of AGI for various income ranges: 26.8% for AGIs below $25k, 27.5% for AGIs $25k-50k, 67.6% for AGIs $50k-75k, 85.5% for AGIs $75k-100k, 180.8% for AGIs $100k-200k, 2590.8% for AGIs over 200k)
Net capital gain/loss in AGI: +$20,025 (reported on 16.2% of returns)
Here:
+$20,025
State:
+$22,201
(% of AGI for various income ranges: 11.8% for AGIs below $25k, 47.9% for AGIs $25k-50k, 83.9% for AGIs $50k-75k, 191.4% for AGIs $75k-100k, 506.3% for AGIs $100k-200k, 19623.3% for AGIs over 200k)
Profit/loss from business: +$14,910 (reported on 15.5% of returns)
Here:
+$14,910
State:
+$15,095
(% of AGI for various income ranges: 154.5% for AGIs below $25k, 224.8% for AGIs $25k-50k, 283.3% for AGIs $50k-75k, 312.2% for AGIs $75k-100k, 567.4% for AGIs $100k-200k, 3734.2% for AGIs over 200k)
Taxable individual retirement arrangement distribution: $16,643 (reported on 9.7% of returns)
04062:
$16,643
Maine:
$18,314
(% of AGI for various income ranges: 87.1% for AGIs below $25k, 103.4% for AGIs $25k-50k, 211.8% for AGIs $50k-75k, 302.2% for AGIs $75k-100k, 575.3% for AGIs $100k-200k, 1493.3% for AGIs over 200k)
Self-employed (Keogh) retirement plans: $17,625 (reported on 0.4% of returns)
04062:
$17,625
Maine:
$21,913
(% of AGI for various income ranges: 67.8% for AGIs $100k-200k)
Total itemized deductions: $23,944 (reported on 8.7% of returns)
Here:
$23,944
State:
$31,197
(% of AGI for various income ranges: 56.6% for AGIs below $25k, 88.9% for AGIs $25k-50k, 366.7% for AGIs $50k-75k, 432.9% for AGIs $75k-100k, 616.1% for AGIs $100k-200k, 3300.0% for AGIs over 200k)
Charity contributions: $4,598 (reported on 5.6% of returns)
Here:
$4,598
State:
$9,863
(% of AGI for various income ranges: 3.8% for AGIs below $25k, 2.9% for AGIs $25k-50k, 24.9% for AGIs $50k-75k, 36.1% for AGIs $75k-100k, 90.4% for AGIs $100k-200k, 775.8% for AGIs over 200k)
Taxes paid: $7,991 (reported on 8.7% of returns)
04062:
$7,991
State:
$8,241
(% of AGI for various income ranges: 8.3% for AGIs below $25k, 24.8% for AGIs $25k-50k, 119.2% for AGIs $50k-75k, 170.5% for AGIs $75k-100k, 225.3% for AGIs $100k-200k, 1015.8% for AGIs over 200k)
Earned income credit: $1,783 (reported on 9.8% of returns)
Here:
$1,783
State:
$1,960
(% of AGI for various income ranges: 54.9% for AGIs below $25k, 42.9% for AGIs $25k-50k)
Percentage of individuals using paid preparers for their 2020 taxes: 91.9%
Here:
92%
State:
92%
(% for various income ranges: 89.3% for AGIs below $25k, 92.2% for AGIs $25k-50k, 92.7% for AGIs $50k-75k, 92.2% for AGIs $75k-100k, 93.8% for AGIs $100k-200k, 93.0% for AGIs over 200k)
Averages for the 2012 tax year for zip code 04062, filed in 2013:
Average Adjusted Gross Income (AGI) in 2012: $59,920 (Individual Income Tax Returns)
Here:
$59,920
State:
$52,375
Salary/wage: $48,132 (reported on 87.7% of returns)
Here:
$48,132
State:
$43,415
(% of AGI for various income ranges: 75.1% for AGIs below $25k, 81.5% for AGIs $25k-50k, 81.5% for AGIs $50k-75k, 81.8% for AGIs $75k-100k, 81.6% for AGIs $100k-200k, 31.1% for AGIs over 200k)
Taxable interest for individuals: $1,216 (reported on 32.7% of returns)
This zip code:
$1,216
Maine:
$1,221
(% of AGI for various income ranges: 0.9% for AGIs below $25k, 0.6% for AGIs $25k-50k, 0.4% for AGIs $50k-75k, 0.4% for AGIs $75k-100k, 0.5% for AGIs $100k-200k, 1.1% for AGIs over 200k)
Ordinary dividends: $3,136 (reported on 18.0% of returns)
Here:
$3,136
State:
$5,812
(% of AGI for various income ranges: 1.2% for AGIs below $25k, 0.8% for AGIs $25k-50k, 0.4% for AGIs $50k-75k, 0.8% for AGIs $75k-100k, 1.0% for AGIs $100k-200k, 1.5% for AGIs over 200k)
Net capital gain/loss in AGI: +$10,583 (reported on 13.5% of returns)
Here:
+$10,583
State:
+$11,897
(% of AGI for various income ranges: 0.4% for AGIs $25k-50k, 0.6% for AGIs $50k-75k, 1.1% for AGIs $75k-100k, 1.9% for AGIs $100k-200k, 7.7% for AGIs over 200k)
Profit/loss from business: +$11,145 (reported on 14.9% of returns)
Here:
+$11,145
State:
+$12,144
(% of AGI for various income ranges: 7.4% for AGIs below $25k, 3.8% for AGIs $25k-50k, 2.4% for AGIs $50k-75k, 2.9% for AGIs $75k-100k, 2.4% for AGIs $100k-200k, 1.1% for AGIs over 200k)
Taxable individual retirement arrangement distribution: $13,622 (reported on 9.7% of returns)
04062:
$13,622
Maine:
$13,385
(% of AGI for various income ranges: 3.1% for AGIs below $25k, 2.2% for AGIs $25k-50k, 2.6% for AGIs $50k-75k, 2.4% for AGIs $75k-100k, 2.4% for AGIs $100k-200k, 1.2% for AGIs over 200k)
Self-employment retirement plans: $12,367 (reported on 0.4% of returns)
04062:
$12,367
Maine:
$17,341
Total itemized deductions: $20,646 (20% of AGI, reported on 40.8% of returns)
Here:
$20,646
State:
$21,859
Here:
20.0% of AGI
State:
20.9% of AGI
(% of AGI for various income ranges: 9.5% for AGIs below $25k, 11.6% for AGIs $25k-50k, 16.0% for AGIs $50k-75k, 16.3% for AGIs $75k-100k, 17.0% for AGIs $100k-200k, 10.9% for AGIs over 200k)
Charity contributions: $1,958 (reported on 31.2% of returns)
Here:
$1,958
State:
$2,741
(% of AGI for various income ranges: 0.5% for AGIs below $25k, 0.6% for AGIs $25k-50k, 1.1% for AGIs $50k-75k, 1.1% for AGIs $75k-100k, 1.3% for AGIs $100k-200k, 1.1% for AGIs over 200k)
Taxes paid: $9,268 (reported on 40.6% of returns)
04062:
$9,268
State:
$9,996
(% of AGI for various income ranges: 2.5% for AGIs below $25k, 3.8% for AGIs $25k-50k, 6.0% for AGIs $50k-75k, 6.8% for AGIs $75k-100k, 8.5% for AGIs $100k-200k, 6.7% for AGIs over 200k)
Earned income credit: $1,898 (reported on 13.3% of returns)
Here:
$1,898
State:
$1,959
(% of AGI for various income ranges: 4.5% for AGIs below $25k, 0.7% for AGIs $25k-50k)
Percentage of individuals using paid preparers for their 2012 taxes: 42.9%
Here:
43%
State:
48%
(% for various income ranges: 35.8% for AGIs below $25k, 40.2% for AGIs $25k-50k, 45.9% for AGIs $50k-75k, 50.5% for AGIs $75k-100k, 52.2% for AGIs $100k-200k, 77.8% for AGIs over 200k)
Averages for the 2004 tax year for zip code 04062, filed in 2005:
Average Adjusted Gross Income (AGI) in 2004: $47,886 (Individual Income Tax Returns)
Here:
$47,886
State:
$42,606
Salary/wage: $41,307 (reported on 89.1% of returns)
Here:
$41,307
State:
$36,376
(% of AGI for various income ranges: 124.9% for AGIs below $10k, 77.4% for AGIs $10k-25k, 84.8% for AGIs $25k-50k, 85.7% for AGIs $50k-75k, 86.8% for AGIs $75k-100k, 57.5% for AGIs over 100k)
Taxable interest for individuals: $1,135 (reported on 48.9% of returns)
This zip code:
$1,135
Maine:
$1,367
(% of AGI for various income ranges: 4.7% for AGIs below $10k, 1.8% for AGIs $10k-25k, 0.8% for AGIs $25k-50k, 0.8% for AGIs $50k-75k, 0.5% for AGIs $75k-100k, 1.7% for AGIs over 100k)
Taxable dividends: $1,847 (reported on 22.1% of returns)
Here:
$1,847
State:
$3,533
(% of AGI for various income ranges: 3.6% for AGIs below $10k, 0.8% for AGIs $10k-25k, 0.6% for AGIs $25k-50k, 0.5% for AGIs $50k-75k, 0.7% for AGIs $75k-100k, 1.2% for AGIs over 100k)
Net capital gain/loss: +$12,003 (reported on 17.0% of returns)
Here:
+$12,003
State:
+$11,433
(% of AGI for various income ranges: 3.6% for AGIs below $10k, 0.4% for AGIs $10k-25k, 0.9% for AGIs $25k-50k, 1.4% for AGIs $50k-75k, 1.3% for AGIs $75k-100k, 11.2% for AGIs over 100k)
Profit/loss from business: +$10,019 (reported on 16.2% of returns)
Here:
+$10,019
State:
+$10,755
(% of AGI for various income ranges: 2.9% for AGIs below $10k, 6.4% for AGIs $10k-25k, 4.2% for AGIs $25k-50k, 3.1% for AGIs $50k-75k, 2.5% for AGIs $75k-100k, 2.8% for AGIs over 100k)
IRA payment deduction: $2,880 (reported on 3.4% of returns)
04062:
$2,880
Maine:
$3,014
(% of AGI for various income ranges: 0.4% for AGIs $10k-25k, 0.3% for AGIs $25k-50k, 0.2% for AGIs $50k-75k, 0.2% for AGIs $75k-100k, 0.1% for AGIs over 100k)
Self-employed pension: $10,491 (reported on 0.7% of returns)
Here:
$10,491
Maine:
$12,886
(% of AGI for various income ranges: 0.1% for AGIs $10k-25k, 0.3% for AGIs $50k-75k, 0.3% for AGIs over 100k)
Total itemized deductions: $17,044 (22% of AGI, reported on 44.4% of returns)
Here:
$17,044
State:
$18,231
Here:
21.9% of AGI
State:
21.7% of AGI
(% of AGI for various income ranges: 19.0% for AGIs below $10k, 10.1% for AGIs $10k-25k, 15.3% for AGIs $25k-50k, 18.1% for AGIs $50k-75k, 18.5% for AGIs $75k-100k, 14.3% for AGIs over 100k)
Charity contributions deductions: $1,752 (2% of AGI, reported on 38.3% of returns)
Here:
$1,752
State:
$2,466
Here:
2.1% of AGI
State:
2.8% of AGI
(% of AGI for various income ranges: 0.8% for AGIs below $10k, 0.6% for AGIs $10k-25k, 1.1% for AGIs $25k-50k, 1.4% for AGIs $50k-75k, 1.4% for AGIs $75k-100k, 1.8% for AGIs over 100k)
Total tax: $6,332 (reported on 81.6% of returns)
04062:
$6,332
State:
$6,047
(% of AGI for various income ranges: 3.2% for AGIs below $10k, 5.1% for AGIs $10k-25k, 7.2% for AGIs $25k-50k, 8.4% for AGIs $50k-75k, 9.8% for AGIs $75k-100k, 17.3% for AGIs over 100k)
Earned income credit: $1,444 (reported on 9.7% of returns)
Here:
$1,444
State:
$1,520
Percentage of individuals using paid preparers for their 2004 taxes: 47.3%
Here:
47%
State:
53%
(% for various income ranges: 33.4% for AGIs below $10k, 43.7% for AGIs $10k-25k, 49.5% for AGIs $25k-50k, 52.4% for AGIs $50k-75k, 52.2% for AGIs $75k-100k, 62.6% for AGIs over 100k)
Likely homosexual households (counted as self-reported same-sex unmarried-partner households)
Lesbian couples: 0.0% of all households
Gay men: 0.1% of all households
Household received Food Stamps/SNAP in the past 12 months: 338 Household did not receive Food Stamps/SNAP in the past 12 months: 7,516
Women who had a birth in the past 12 months: 120 (76 now married, 44 unmarried) Women who did not have a birth in the past 12 months: 4,058 (1,925 now married, 2,133 unmarried)
Housing units in zip code 04062 with a mortgage: 4,484 (593 second mortgage, 528 both second mortgage and home equity loan) Houses without a mortgage: 197
Median monthly owner costs for units with a mortgage: $1,878 Median monthly owner costs for units without a mortgage: $600
Residents with income below the poverty level in 2022:
This zip code:
4.7%
Whole state:
10.8%
Residents with income below 50% of the poverty level in 2022:
This zip code:
2.4%
Whole state:
5.8%
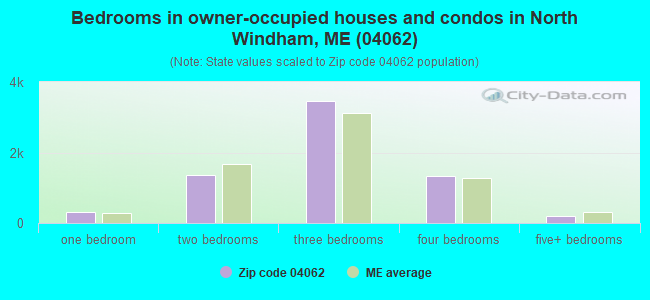
Median number of rooms in houses and condos:
Here:
6.1
State:
6.1
Median number of rooms in apartments:
Here:
4.0
State:
4.0
Notable locations in this zip code not listed on our city pages
Notable locations in zip code 04062: Land of Nod (A), Westerly Winds Golf Course (B), State Reformatory for Men (C), Windham Fire Rescue Department District 1 (D), East Windham Fire Department (E), Windham Fire Rescue Department District 4 Headquarters (F), Windham Town Hall (G), Windham Public Library (H), Windham Fire Rescue Department District 3 (I), Windham Fire Rescue Department District 2 (J). Display/hide their locations on the map
Churches in zip code 04062 include: Friends Church (A), Windham Plains Chapel (B), Highland Cliff Advent Church (C), Windham Hill United Church of Christ (D), Windham Christian Life Center (E), Windham Baptist Church (F), South Windham Community Church (G), Saint Anns Episcopal Church (H). Display/hide their locations on the map
Cemeteries: Mayberry Cemetery (1), Old Anderson Cemetery (2), Purington Cemetery (3), Mugford Family Cemetery (4), Loveitt Cemetery (5), Godd Cemetery (6), Arlington Cemetery (7). Display/hide their locations on the map
Lakes, reservoirs, and swamps: Chaffin Pond (A), Collins Pond (B), Forest Lake (C), Highland Lake (D), Little Duck Pond (E), Mud Ponds (F), Pettingill Pond (G), Tarkill Pond (H). Display/hide their locations on the map
Streams, rivers, and creeks: Anderson Brook (A), Baker Brook (B), Lincoln Weeks Brook (C), Small Brook (D), Outlet Brook (E), Inkhorn Brook (F), McIntosh Brook (G), Dutton Hills Brook (H), Elmer Brook (I). Display/hide their locations on the map
2,480 married couples with children.
580 single-parent households (228 men, 352 women).
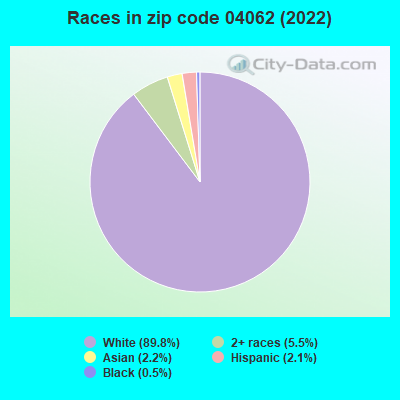
93.3% of residents of 04062 zip code speak English at home.
1.2% of residents speak Spanish at home (64% very well, 15% well, 21% not well).
3.8% of residents speak other Indo-European language at home (88% very well, 5% well, 7% not well).
1.7% of residents speak Asian or Pacific Island language at home (55% very well, 28% well, 17% not well).
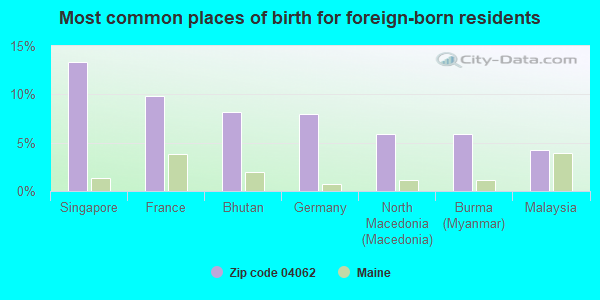
Foreign born population: 457 (2.4%) (65.8% of them are naturalized citizens)
This zip code:
2.4%
Whole state:
4.1%
13%Singapore
10%France
8%Bhutan
8%Germany
6%North Macedonia (Macedonia)
6%Burma (Myanmar)
4%Malaysia
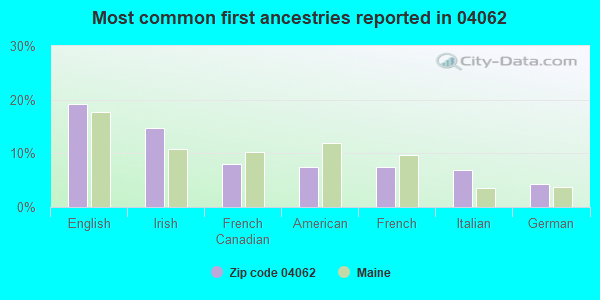
19%English
15%Irish
8%French Canadian
7%American
7%French
7%Italian
4%German
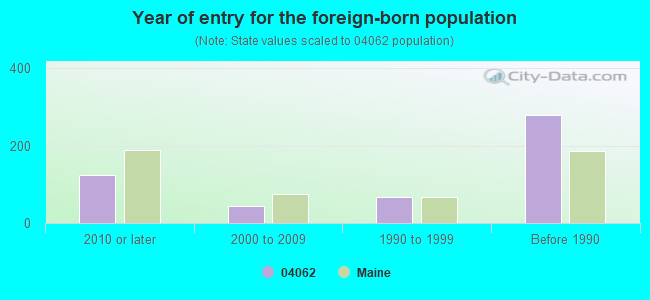
Year of entry for the foreign-born population
1252010 or later
442000 to 2009
671990 to 1999
279Before 1990
Major facilities with environmental interests located in this zip code:
ENFORCEMENT/COMPLIANCE ACTIVITY (Integrated Compliance Information System) - ICIS-01-2003-0159, FORMAL ENFORCEMENT ACTION (Integrated Compliance Information System) - ICIS-01-2003-0159, FORMAL ENFORCEMENT ACTION Small Quantity Generators, between 100 kg and 1000 kg of hazardous waste/month (Resource Conservation and Recovery Act (tracking hazardous waste)) Organizations: CUMBERLAND FARMS INC (CONTACT/OPERATOR)
BUSY BEE CLEANERS (771 ROOSEVELT TRAIL in WINDHAM, ME)
AIR MINOR (AIRS/AFS) (Resource Conservation and Recovery Act (tracking hazardous waste)) Business SIC classification: DRYCLEANING PLANTS, EXCEPT RUG CLEANING Organizations: GEORGE BARTLETT (CONTACT/OWNER)
, GEORGE BARTLETT JR (CONTACT/OWNER)
Alternative names: BUSY BEE LAUNDRY & DRY CLEANING, BUSY BEE LAUNDRY DRYCLEANING
MANCHESTER SCHOOL (709 ROOSEVELT TRAIL in WINDHAM, ME)
(Geographic Names Information System) (National Center for Education Statistics) - STATE ID-47809 Organizations: WINDHAM SCHOOL DEPARTMENT (SCHOOL DISTRICT)
Alternative names: ARLINGTON SCHOOL
RICH TOOL & DIE CO (3 MALLISON FALLS RD in WINDHAM, ME)
(Resource Conservation and Recovery Act (tracking hazardous waste))
ALTAS AUTO BODY INC (632 ROOSEVELT TRAIL in WINDHAM, ME)
USED OIL PROGRAM (Resource Conservation and Recovery Act (tracking hazardous waste)) Organizations: LEWIS S WEATHERBY (CONTACT/OPERATOR)
BUSHMASTER FIREARMS INTERNATIONAL LLC (999 ROOSEVELT TRAIL in WINDHAM, ME)
Small Quantity Generators, between 100 kg and 1000 kg of hazardous waste/month (Resource Conservation and Recovery Act (tracking hazardous waste)) Organizations: WINDHAM EXCAVATING CO (CONTACT/OWNER)
Alternative names: BUSHMASTER FIREARMS INC
CLOTHING CARE CENTER (RR 302 in WINDHAM, ME)
AIR MINOR (AIRS/AFS) Business SIC classification: DRYCLEANING PLANTS, EXCEPT RUG CLEANING
HOME DEPOT 2412 (799 ROOSEVELT TRAIL in WINDHAM, ME)
Small Quantity Generators, between 100 kg and 1000 kg of hazardous waste/month (Resource Conservation and Recovery Act (tracking hazardous waste)) Organizations: HOME DEPOT USA INC (CONTACT/OPERATOR)
PRATT - ABBOTT NORTH WINDHAM (RTE 302 in WINDHAM, ME)
AIR MINOR (AIRS/AFS) Business SIC classification: DRYCLEANING PLANTS, EXCEPT RUG CLEANING Alternative names: PRATT - ABBOTT CLEANERS
Small Quantity Generators, between 100 kg and 1000 kg of hazardous waste/month (Resource Conservation and Recovery Act (tracking hazardous waste)) - notification Organizations: RICHARD MITCHELL (CONTACT/OWNER)
C V S 0378 (770 ROOSEVELT TRAIL in WINDHAM, ME)
Small Quantity Generators, between 100 kg and 1000 kg of hazardous waste/month (Resource Conservation and Recovery Act (tracking hazardous waste)) - notification Organizations: SHAWS REALTY CO (CONTACT/OWNER)
LIBBY ENERGY INC (746 RIVER RD in WINDHAM, ME)
TRANSPORTER (Resource Conservation and Recovery Act (tracking hazardous waste)) Organizations: STEPHEN D & GLENN S LIBBY (CONTACT/OWNER)
Housing units lacking complete plumbing facilities: 1.3% Housing units lacking complete kitchen facilities: 0.5%
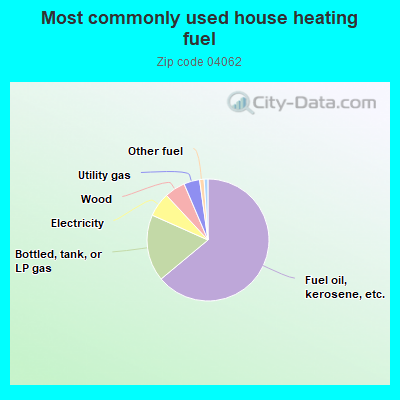
63.9%Fuel oil, kerosene, etc.
17.7%Bottled, tank, or LP gas
6.4%Electricity
5.5%Wood
4.2%Utility gas
1.2%Other fuel
Population in 1990: 13,482. Population change in the 1990s: +1,436 (+10.7%).
Place of birth for U.S.-born residents:
This state: 12,597
Northeast: 3,856
Midwest: 679
South: 605
West: 506
60% of the 04062 zip code residents lived in the same house 5 years ago. Out of people who lived in different houses, 66% lived in this county. Out of people who lived in different counties, 50% lived in Maine.
93% of the 04062 zip code residents lived in the same house 1 year ago. Out of people who lived in different houses, 49% moved from this county. Out of people who lived in different houses, 24% moved from different county within same state. Out of people who lived in different houses, 30% moved from different state. Out of people who lived in different houses, 1% moved from abroad.
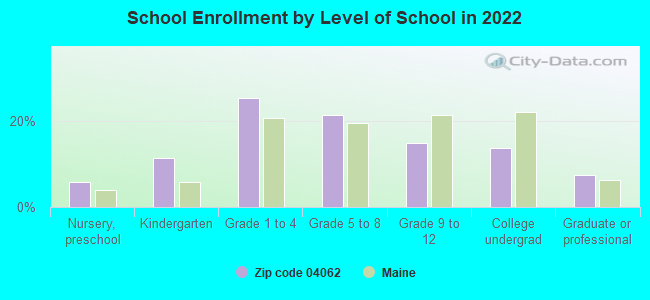
Private vs. public school enrollment:
Students in private schools in grades 1 to 8 (elementary and middle school): 39
Here:
2.4%
Maine:
12.7%
Students in private schools in grades 9 to 12 (high school): 17
Here:
3.4%
Maine:
12.6%
Students in private undergraduate colleges: 69
Here:
14.6%
Maine:
34.5%
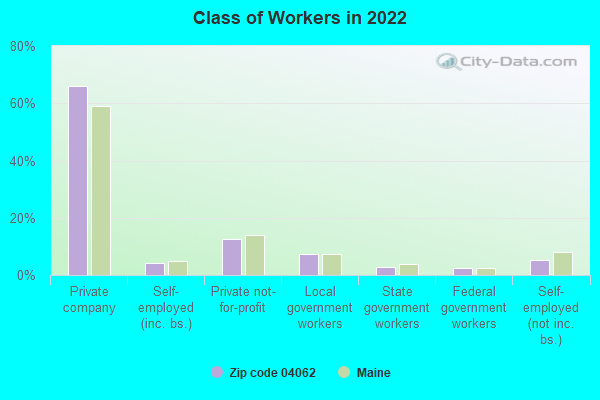
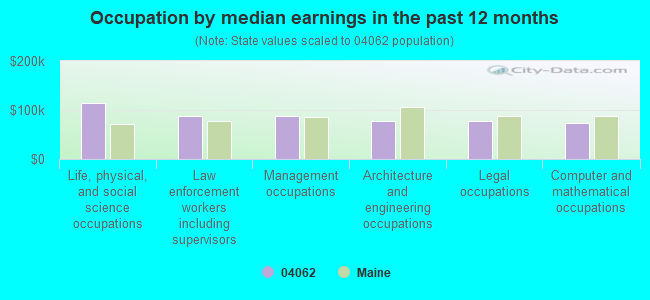
Occupation by median earnings in the past 12 months ($)
114,723Life, physical, and social science occupations
88,328Law enforcement workers including supervisors
86,791Management occupations
77,954Architecture and engineering occupations
76,804Legal occupations
74,082Computer and mathematical occupations
Companies with federal contracts located in this zip code:
TITAN MACHINE PRODUCTS, INC (15 COMMONS AVENUE in WINDHAM, ME; small business) : $4,365,932 in 55 contractsfrom 2002 to 2006
Contracts for Hardware, Commercial, Guns, through 30 mm, Guns, over 30 mm up to 75 mm by Defense Logistics Agency, Army Signed by year:2000: $0; 2001: $0; 2002: $8,028; 2003: $743,968; 2004: $531,877; 2005: $1,446,299; 2006: $1,635,760.
Biggest contracts:
$584,450 with Defense Logistics Agency for Hardware, Commercial. Signed on 2005-03-11. Completion date: 2005-09-10.
$415,064 with Army for Hardware, Commercial. Signed on 2003-05-15. Completion date: 2004-01-30.
$303,914 with Defense Logistics Agency for Hardware, Commercial. Signed on 2005-03-12. Completion date: 2005-09-11.
$233,780, same as above.Signed on 2005-10-26. Completion date: 2005-11-26.
SEAVEY'S FURNITURE & APPLIANCE (421 ROOSEVELT TRAIL in WINDHAM, ME; small business)
$19,574 with Navy for Household Furnishings. Signed on 2006-01-18. Completion date: 2006-02-17.
Top industries in this zip code by the number of employees in 2005:
2002 - 2018 National Fire Incident Reporting System (NFIRS) incidents
Based on the data from the years 2002 - 2018 the average number of fire incidents per year is 61. The highest number of reported fires - 109 took place in 2012, and the least - 4 in 2008. The data has a growing trend.
When looking into fire subcategories, the most reports belonged to: Structure Fires (58.5%), and Outside Fires (22.8%).
Fire incident types reported to NFIRS in Zip Code 04062


 Nearest zip codes: 04092, 04038, 04039, 04105, 04021, 04071.


 Based on the data from the years 2002 - 2018 the average number of fire incidents per year is 61. The highest number of reported fires - 109 took place in 2012, and the least - 4 in 2008. The data has a growing trend.
 When looking into fire subcategories, the most reports belonged to: Structure Fires (58.5%), and Outside Fires (22.8%).