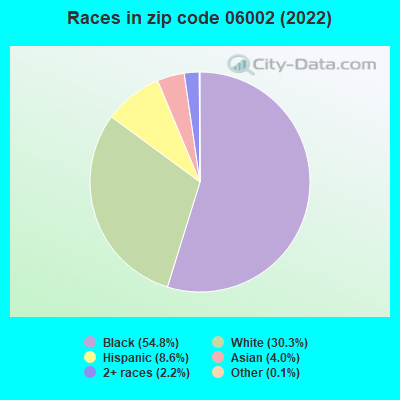
Estimated zip code population in 2022: 21,548 Zip code population in 2010: 20,486 Zip code population in 2000: 19,585
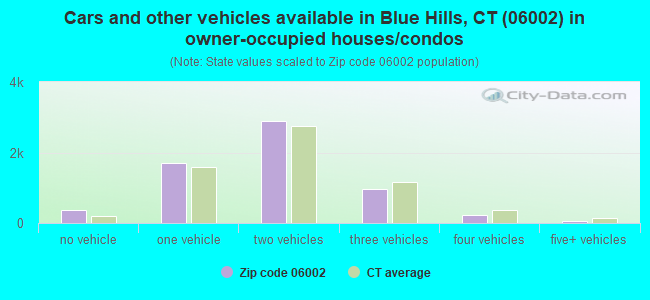
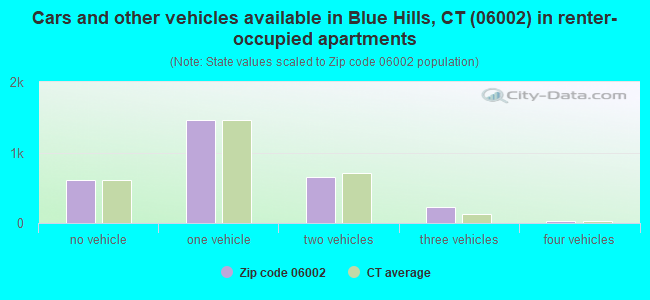
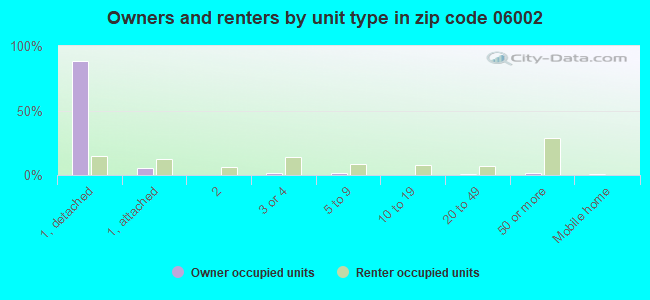
Houses and condos: 9,575 Renter-occupied apartments: 2,978
% of renters here:
33%
State:
34%
March 2022 cost of living index in zip code 06002: 104.4 (near average, U.S. average is 100)
Land area: 26.1 sq. mi. Water area: 0.2 sq. mi.
Population density: 827 people per square mile
(low).
OSM Map
Google Map
MSN Map
OSM Map
General Map
Google Map
MSN Map
OSM Map
Google Map
MSN Map
OSM Map
Google Map
MSN Map
Please wait while loading the map...
Real estate property taxes paid for housing units in 2022:
This zip code:
2.2% ($5,718)
Connecticut:
1.8% ($6,189)
Median real estate property taxes paid for housing units with mortgages in 2022: $5,607 (2.1%) Median real estate property taxes paid for housing units with no mortgage in 2022: $6,039 (2.3%)
Averages for the 2020 tax year for zip code 06002, filed in 2021:
Average Adjusted Gross Income (AGI) in 2020: $78,135 (Individual Income Tax Returns)
Here:
$78,135
State:
$105,931
Salary/wage: $63,039 (reported on 78.5% of returns)
Here:
$63,039
State:
$83,540
(% of AGI for various income ranges: 1062.5% for AGIs below $25k, 3659.6% for AGIs $25k-50k, 6643.0% for AGIs $50k-75k, 9348.1% for AGIs $75k-100k, 17436.2% for AGIs $100k-200k, 82333.7% for AGIs over 200k)
Taxable interest for individuals: $2,043 (reported on 29.3% of returns)
This zip code:
$2,043
Connecticut:
$3,402
(% of AGI for various income ranges: 15.4% for AGIs below $25k, 19.5% for AGIs $25k-50k, 26.7% for AGIs $50k-75k, 60.1% for AGIs $75k-100k, 197.4% for AGIs $100k-200k, 2051.6% for AGIs over 200k)
Ordinary dividends: $12,669 (reported on 21.8% of returns)
Here:
$12,669
State:
$12,683
(% of AGI for various income ranges: 29.9% for AGIs below $25k, 53.2% for AGIs $25k-50k, 106.8% for AGIs $50k-75k, 285.0% for AGIs $75k-100k, 826.2% for AGIs $100k-200k, 10977.9% for AGIs over 200k)
Net capital gain/loss in AGI: +$20,616 (reported on 19.5% of returns)
Here:
+$20,616
State:
+$44,158
(% of AGI for various income ranges: 20.2% for AGIs below $25k, 28.3% for AGIs $25k-50k, 68.1% for AGIs $50k-75k, 250.4% for AGIs $75k-100k, 780.7% for AGIs $100k-200k, 20511.6% for AGIs over 200k)
Profit/loss from business: +$14,815 (reported on 14.4% of returns)
Here:
+$14,815
State:
+$22,988
(% of AGI for various income ranges: 71.5% for AGIs below $25k, 72.3% for AGIs $25k-50k, 77.9% for AGIs $50k-75k, 279.4% for AGIs $75k-100k, 530.7% for AGIs $100k-200k, 7814.7% for AGIs over 200k)
Taxable individual retirement arrangement distribution: $23,082 (reported on 11.0% of returns)
06002:
$23,082
Connecticut:
$22,031
(% of AGI for various income ranges: 46.6% for AGIs below $25k, 76.9% for AGIs $25k-50k, 218.0% for AGIs $50k-75k, 362.3% for AGIs $75k-100k, 1305.0% for AGIs $100k-200k, 5170.5% for AGIs over 200k)
Self-employed (Keogh) retirement plans: $20,900 (reported on 0.8% of returns)
06002:
$20,900
Connecticut:
$29,016
(% of AGI for various income ranges: 10.7% for AGIs $25k-50k, 61.3% for AGIs $100k-200k, 646.8% for AGIs over 200k)
Total itemized deductions: $33,716 (reported on 17.3% of returns)
Here:
$33,716
State:
$37,613
(% of AGI for various income ranges: 117.4% for AGIs below $25k, 261.8% for AGIs $25k-50k, 611.9% for AGIs $50k-75k, 1173.4% for AGIs $75k-100k, 2036.9% for AGIs $100k-200k, 13043.2% for AGIs over 200k)
Charity contributions: $9,357 (reported on 14.7% of returns)
Here:
$9,357
State:
$13,557
(% of AGI for various income ranges: 7.7% for AGIs below $25k, 35.7% for AGIs $25k-50k, 89.3% for AGIs $50k-75k, 249.0% for AGIs $75k-100k, 507.4% for AGIs $100k-200k, 4114.2% for AGIs over 200k)
Taxes paid: $8,289 (reported on 17.2% of returns)
06002:
$8,289
State:
$9,096
(% of AGI for various income ranges: 27.0% for AGIs below $25k, 63.7% for AGIs $25k-50k, 190.2% for AGIs $50k-75k, 397.1% for AGIs $75k-100k, 630.6% for AGIs $100k-200k, 1678.4% for AGIs over 200k)
Earned income credit: $1,841 (reported on 10.8% of returns)
Here:
$1,841
State:
$2,059
(% of AGI for various income ranges: 57.8% for AGIs below $25k, 47.9% for AGIs $25k-50k)
Percentage of individuals using paid preparers for their 2020 taxes: 92.2%
Here:
92%
State:
93%
(% for various income ranges: 90.7% for AGIs below $25k, 92.9% for AGIs $25k-50k, 92.9% for AGIs $50k-75k, 92.9% for AGIs $75k-100k, 92.3% for AGIs $100k-200k, 91.7% for AGIs over 200k)
Averages for the 2012 tax year for zip code 06002, filed in 2013:
Average Adjusted Gross Income (AGI) in 2012: $72,943 (Individual Income Tax Returns)
Here:
$72,943
State:
$93,290
Salary/wage: $61,065 (reported on 79.5% of returns)
Here:
$61,065
State:
$73,117
(% of AGI for various income ranges: 66.0% for AGIs below $25k, 77.1% for AGIs $25k-50k, 73.7% for AGIs $50k-75k, 70.3% for AGIs $75k-100k, 67.1% for AGIs $100k-200k, 57.1% for AGIs over 200k)
Taxable interest for individuals: $1,684 (reported on 46.0% of returns)
This zip code:
$1,684
Connecticut:
$2,530
(% of AGI for various income ranges: 1.1% for AGIs below $25k, 0.8% for AGIs $25k-50k, 0.7% for AGIs $50k-75k, 0.9% for AGIs $75k-100k, 1.0% for AGIs $100k-200k, 1.5% for AGIs over 200k)
Ordinary dividends: $10,385 (reported on 25.8% of returns)
Here:
$10,385
State:
$10,909
(% of AGI for various income ranges: 2.4% for AGIs below $25k, 1.8% for AGIs $25k-50k, 2.0% for AGIs $50k-75k, 2.3% for AGIs $75k-100k, 3.8% for AGIs $100k-200k, 5.9% for AGIs over 200k)
Net capital gain/loss in AGI: +$13,790 (reported on 19.8% of returns)
Here:
+$13,790
State:
+$34,090
(% of AGI for various income ranges: 0.1% for AGIs $25k-50k, 0.7% for AGIs $50k-75k, 0.7% for AGIs $75k-100k, 1.8% for AGIs $100k-200k, 10.1% for AGIs over 200k)
Profit/loss from business: +$20,439 (reported on 13.3% of returns)
Here:
+$20,439
State:
+$22,741
(% of AGI for various income ranges: 5.1% for AGIs below $25k, 2.2% for AGIs $25k-50k, 2.0% for AGIs $50k-75k, 3.3% for AGIs $75k-100k, 3.5% for AGIs $100k-200k, 5.3% for AGIs over 200k)
Taxable individual retirement arrangement distribution: $19,266 (reported on 13.6% of returns)
06002:
$19,266
Connecticut:
$19,976
(% of AGI for various income ranges: 4.0% for AGIs below $25k, 1.9% for AGIs $25k-50k, 2.8% for AGIs $50k-75k, 2.7% for AGIs $75k-100k, 4.6% for AGIs $100k-200k, 4.0% for AGIs over 200k)
Self-employment retirement plans: $21,593 (reported on 1.3% of returns)
06002:
$21,593
Connecticut:
$24,004
(% of AGI for various income ranges: 0.3% for AGIs $50k-75k, 0.3% for AGIs $100k-200k, 0.8% for AGIs over 200k)
Total itemized deductions: $26,299 (23% of AGI, reported on 50.2% of returns)
Here:
$26,299
State:
$33,239
Here:
22.8% of AGI
State:
18.9% of AGI
(% of AGI for various income ranges: 16.7% for AGIs below $25k, 16.8% for AGIs $25k-50k, 19.8% for AGIs $50k-75k, 20.6% for AGIs $75k-100k, 20.2% for AGIs $100k-200k, 15.3% for AGIs over 200k)
Charity contributions: $4,230 (reported on 42.8% of returns)
Here:
$4,230
State:
$4,947
(% of AGI for various income ranges: 1.4% for AGIs below $25k, 2.0% for AGIs $25k-50k, 2.1% for AGIs $50k-75k, 2.8% for AGIs $75k-100k, 3.0% for AGIs $100k-200k, 2.4% for AGIs over 200k)
Taxes paid: $12,047 (reported on 50.0% of returns)
06002:
$12,047
State:
$17,397
(% of AGI for various income ranges: 5.3% for AGIs below $25k, 5.8% for AGIs $25k-50k, 7.6% for AGIs $50k-75k, 8.6% for AGIs $75k-100k, 9.5% for AGIs $100k-200k, 8.8% for AGIs over 200k)
Earned income credit: $1,819 (reported on 12.2% of returns)
Here:
$1,819
State:
$2,053
(% of AGI for various income ranges: 4.4% for AGIs below $25k, 0.7% for AGIs $25k-50k)
Percentage of individuals using paid preparers for their 2012 taxes: 55.7%
Here:
56%
State:
55%
(% for various income ranges: 47.1% for AGIs below $25k, 52.6% for AGIs $25k-50k, 59.1% for AGIs $50k-75k, 62.3% for AGIs $75k-100k, 62.4% for AGIs $100k-200k, 78.8% for AGIs over 200k)
Averages for the 2004 tax year for zip code 06002, filed in 2005:
Average Adjusted Gross Income (AGI) in 2004: $57,753 (Individual Income Tax Returns)
Here:
$57,753
State:
$73,265
Salary/wage: $49,276 (reported on 80.1% of returns)
Here:
$49,276
State:
$62,030
(% of AGI for various income ranges: 93.5% for AGIs below $10k, 69.3% for AGIs $10k-25k, 79.9% for AGIs $25k-50k, 76.8% for AGIs $50k-75k, 75.9% for AGIs $75k-100k, 57.3% for AGIs over 100k)
Taxable interest for individuals: $1,982 (reported on 58.4% of returns)
This zip code:
$1,982
Connecticut:
$2,287
(% of AGI for various income ranges: 5.4% for AGIs below $10k, 2.7% for AGIs $10k-25k, 1.7% for AGIs $25k-50k, 1.5% for AGIs $50k-75k, 1.4% for AGIs $75k-100k, 2.3% for AGIs over 100k)
Taxable dividends: $7,999 (reported on 31.2% of returns)
Here:
$7,999
State:
$5,735
(% of AGI for various income ranges: 6.8% for AGIs below $10k, 3.1% for AGIs $10k-25k, 1.9% for AGIs $25k-50k, 2.0% for AGIs $50k-75k, 2.7% for AGIs $75k-100k, 6.8% for AGIs over 100k)
Net capital gain/loss: +$13,507 (reported on 24.6% of returns)
Here:
+$13,507
State:
+$23,694
(% of AGI for various income ranges: -2.2% for AGIs below $10k, 0.3% for AGIs $10k-25k, 0.6% for AGIs $25k-50k, 1.2% for AGIs $50k-75k, 2.2% for AGIs $75k-100k, 11.7% for AGIs over 100k)
Profit/loss from business: +$12,735 (reported on 13.4% of returns)
Here:
+$12,735
State:
+$20,783
(% of AGI for various income ranges: 4.7% for AGIs below $10k, 2.5% for AGIs $10k-25k, 1.6% for AGIs $25k-50k, 1.9% for AGIs $50k-75k, 2.8% for AGIs $75k-100k, 4.0% for AGIs over 100k)
IRA payment deduction: $3,051 (reported on 2.2% of returns)
06002:
$3,051
Connecticut:
$3,216
(% of AGI for various income ranges: 0.2% for AGIs $10k-25k, 0.2% for AGIs $25k-50k, 0.1% for AGIs $50k-75k, 0.1% for AGIs $75k-100k, 0.1% for AGIs over 100k)
Self-employed pension: $15,637 (reported on 1.4% of returns)
Here:
$15,637
Connecticut:
$17,335
(% of AGI for various income ranges: 0.1% for AGIs $25k-50k, 0.1% for AGIs $50k-75k, 0.3% for AGIs $75k-100k, 0.7% for AGIs over 100k)
Total itemized deductions: $21,526 (25% of AGI, reported on 51.6% of returns)
Here:
$21,526
State:
$24,919
Here:
24.7% of AGI
State:
18.6% of AGI
(% of AGI for various income ranges: 30.6% for AGIs below $10k, 20.2% for AGIs $10k-25k, 19.8% for AGIs $25k-50k, 21.2% for AGIs $50k-75k, 20.8% for AGIs $75k-100k, 17.3% for AGIs over 100k)
Charity contributions deductions: $4,125 (5% of AGI, reported on 46.8% of returns)
Here:
$4,125
State:
$3,762
Here:
4.5% of AGI
State:
2.7% of AGI
(% of AGI for various income ranges: 1.3% for AGIs below $10k, 2.0% for AGIs $10k-25k, 2.6% for AGIs $25k-50k, 3.0% for AGIs $50k-75k, 3.2% for AGIs $75k-100k, 4.0% for AGIs over 100k)
Total tax: $9,225 (reported on 79.5% of returns)
06002:
$9,225
State:
$15,148
(% of AGI for various income ranges: 2.8% for AGIs below $10k, 3.9% for AGIs $10k-25k, 6.9% for AGIs $25k-50k, 9.8% for AGIs $50k-75k, 10.8% for AGIs $75k-100k, 18.1% for AGIs over 100k)
Earned income credit: $1,377 (reported on 10.0% of returns)
Here:
$1,377
State:
$1,570
Percentage of individuals using paid preparers for their 2004 taxes: 63.9%
Here:
64%
State:
59%
(% for various income ranges: 54.6% for AGIs below $10k, 64.5% for AGIs $10k-25k, 64.3% for AGIs $25k-50k, 66.3% for AGIs $50k-75k, 63.5% for AGIs $75k-100k, 70.0% for AGIs over 100k)
Likely homosexual households (counted as self-reported same-sex unmarried-partner households)
Lesbian couples: 0.1% of all households
Gay men: 0.3% of all households
Household received Food Stamps/SNAP in the past 12 months: 1,060 Household did not receive Food Stamps/SNAP in the past 12 months: 8,073
Women who had a birth in the past 12 months: 279 (217 now married, 59 unmarried) Women who did not have a birth in the past 12 months: 4,440 (1,485 now married, 2,966 unmarried)
Housing units in zip code 06002 with a mortgage: 4,206 (213 second mortgage, 127 both second mortgage and home equity loan) Houses without a mortgage: 129
Median monthly owner costs for units with a mortgage: $1,897 Median monthly owner costs for units without a mortgage: $960
Residents with income below the poverty level in 2022:
This zip code:
7.1%
Whole state:
9.8%
Residents with income below 50% of the poverty level in 2022:
This zip code:
3.4%
Whole state:
4.8%
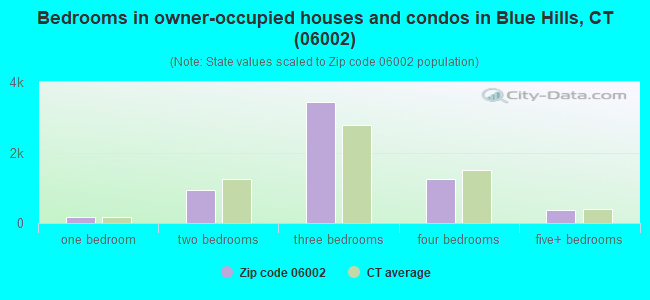
Median number of rooms in houses and condos:
Here:
6.4
State:
6.5
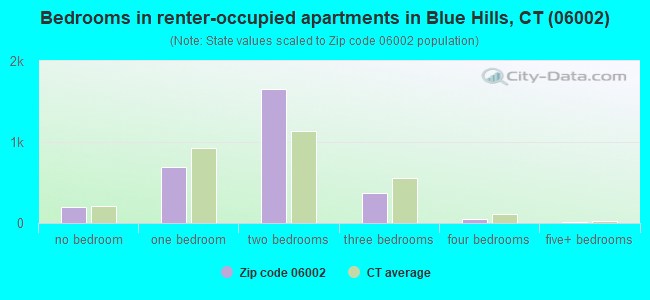
Median number of rooms in apartments:
Here:
3.9
State:
4.0
Notable locations in this zip code not listed on our city pages
Notable locations in zip code 06002: Blue Hills Industrial Park (A), Tumble Brook Country Club (B), Bloomfield Fire Department Company 2 (C), Prosser Public Library (D), Wintonbury Building (E), Bloomfield Fire Department Company 1 (F), Blue Hills Fire Department Station 4 (G), Blue Hills Fire Department Station 3 (H), Blue Hills Fire Department Station 1 Headquarters (I), Bloomfield Fire Department Company 3 (J), Archbishop Henry O'Brien Library (K), Bloomfield Volunteer Ambulance Service (L). Display/hide their locations on the map
Shopping Centers: Bloomfield Shopping Center (1), Tunxis Plaza Shopping Center (2), The Center of Bloomfield Shopping Center (3), Copacos Shopping Center (4). Display/hide their locations on the map
Churches in zip code 06002 include: Saint Andrews Church (A), Beth Hillel Synagogue (B), Bethel African Methodist Episcopal Church (C), Bloomfield United Methodist Church (D), Brothers of the Sacred Heart Church (E), Christ the King Church (F), First Congregational Church (G), Sacred Heart Parish Church (H), Saint Johns Full Gospel Deliverance Church (I). Display/hide their locations on the map
Cemeteries: Saint Andrews Cemetery (1), Old Wintonbury Cemetery (2), Latimer Hill Cemetery (3), Mount Saint Benedict Cemetery (4), Mountain View Cemetery (5). Display/hide their locations on the map
Lakes and reservoirs: Gale Pond (A), Lake Louise (B), Barber Pond (C), Bloomfield Reservoir (D), Bloomfield Reservoir 3A (E), Wintonbury Reservoir (F), Cold Spring Reservoir (G), Blue Hills Reservoir (H). Display/hide their locations on the map
Parks in zip code 06002 include: Bloomfield Town Green (1), Filley Park (2), Hubbard Street Tot Lot (3), Mill Brook State Park (4), Pershing Park Playground (5), West Eggleston Street Tot Lot (6), Marion K Wilcox Park (7), Penwood State Park (8), North Branch State Access Area (9). Display/hide their locations on the map
In group quarters: 589 (-1 institutionalized population)
Size of family households: 2,739 2-persons, 1,444 3-persons, 809 4-persons, 219 5-persons, 249 6-persons, 12 7-or-more-persons
Size of nonfamily households: 2,858 1-person, 835 2-persons, 24 3-persons
1,678 married couples with children.
942 single-parent households (147 men, 795 women).
86.0% of residents of 06002 zip code speak English at home.
5.5% of residents speak Spanish at home (82% very well, 16% well, 1% not well).
2.9% of residents speak other Indo-European language at home (62% very well, 33% well, 5% not well).
1.0% of residents speak Asian or Pacific Island language at home (73% very well, 27% well).
4.6% of residents speak other language at home (92% very well, 8% well).
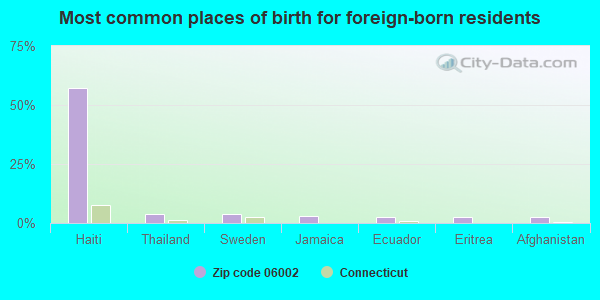
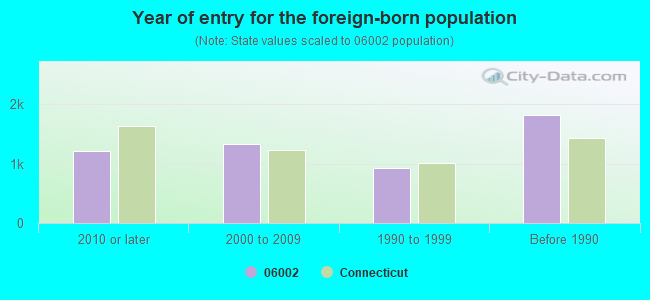
Foreign born population: 4,643 (21.5%) (79.7% of them are naturalized citizens)
Major facilities with environmental interests located in this zip code:
BIRKEN MANUFACTURING CO (3 OLD WINDSOR ROAD in BLOOMFIELD, CT)
AIR MINOR (AIRS/AFS) COMPLIANCE ACTIVITY (Tracking inspections of insecticide, fungicide, and rodenticide, and toxic substances) National Pollutant Discharge Elimination System NON-MAJOR (Tracking pollutant discharge elimination systems) - permit HAZARDOUS WASTE BIENNIAL REPORTER (Resource Conservation and Recovery Act (tracking hazardous waste)) Large Quantity Generators, more that 1000 kg of hazardous waste/month (Resource Conservation and Recovery Act (tracking hazardous waste)) - notification TSD (Resource Conservation and Recovery Act (tracking hazardous waste)) - notification TRI REPORTER (Tracking of toxic chemicals releasing facilities) Business SIC classification: AIRCRAFT ENGINES AND ENGINE PARTS; AIRCRAFT PARTS AND AUXILIARY EQUIPMENT; SEARCH, DETECTION, NAVIGATION, GUIDANCE, AERONAUTICAL, AND NAUTICAL SYSTEMS AND INSTRUMENTS Business NAICS classification: ELECTROPLATING, PLATING, POLISHING, ANODIZING, AND COLORING.; OTHER MEASURING AND CONTROLLING DEVICE MANUFACTURING.; AIRCRAFT ENGINE AND ENGINE PARTS MANUFACTURING. Alternative names: BIRKEN MFG.(BLOOMFIELD)
BASS PLATING COMPANY (82 OLD WINDSOR ROAD in BLOOMFIELD, CT)
AIR MINOR (AIRS/AFS) National Pollutant Discharge Elimination System NON-MAJOR (Tracking pollutant discharge elimination systems) - permit HAZARDOUS WASTE BIENNIAL REPORTER (Resource Conservation and Recovery Act (tracking hazardous waste)) Large Quantity Generators, more that 1000 kg of hazardous waste/month (Resource Conservation and Recovery Act (tracking hazardous waste)) - notification TSD (Resource Conservation and Recovery Act (tracking hazardous waste)) - notification TRI REPORTER (Tracking of toxic chemicals releasing facilities) Business SIC and NAICS classification: ELECTROPLATING, PLATING, POLISHING, ANODIZING, AND COLORING Organizations: ROCCO MASTROBATTISTA (CONTACT/OPERATOR)
Alternative names: BASS PLATING (BRANFORD)
BLOOMFIELD HIGH SCHOOL (5 HUCKLEBERRY LA in BLOOMFIELD, CT)
AIR MINOR (AIRS/AFS) (Geographic Names Information System) (National Center for Education Statistics) - STATE ID-61 Business SIC classification: ELEMENTARY AND SECONDARY SCHOOLS Organizations: BLOOMFIELD SCHOOL DISTRICT (SCHOOL DISTRICT)
ACCU CIRCUITS INC (81 OLD WINDSOR RD in BLOOMFIELD, CT)
(Integrated Compliance Information System) - ICIS-01-1995-0079, FORMAL ENFORCEMENT ACTION (Resource Conservation and Recovery Act (tracking hazardous waste)) Organizations: VIJAY R FALDU (CONTACT/OWNER)
I T W CONVERTED PRODUCTS (30-40 EAST NEWBERRY ROAD in BLOOMFIELD, CT)
AIR SYNTHETIC MINOR (AIRS/AFS) CRITERIA AND HAZARDOUS AIR POLLUTANT INVENTORY (Inventory of air pollution sources) HAZARDOUS WASTE BIENNIAL REPORTER (Resource Conservation and Recovery Act (tracking hazardous waste)) Large Quantity Generators, more that 1000 kg of hazardous waste/month (Resource Conservation and Recovery Act (tracking hazardous waste)) - notification TRI REPORTER (Tracking of toxic chemicals releasing facilities) Business SIC classification: PACKAGING PAPER AND PLASTICS FILM, COATED AND LAMINATED Business NAICS classification: COATED AND LAMINATED PACKAGING PAPER AND PLASTICS FILM MANUFACTURING.; ALL OTHER INDUSTRIAL MACHINERY MANUFACTURING. Organizations: IILLINOIS TOOL WORKS (CONTACT/OPERATOR)
, JEROME M SCHARR (CONTACT/OWNER)
Alternative names: I T W HOLOGRAPHIC & SPECIALTY FILMS, ITW CONVERTED PRODS., ITW HOLOGRAPHIC & SPECIALTY FILMS, ITW HOLOGRAPHIC & SPECIALTY PRODS.
COATING SCIENCES (FORMER) (46-48 EAST NEWBERRY RD in BLOOMFIELD, CT)
AIR MINOR (AIRS/AFS) SUPERFUND (Superfund database) (Resource Conservation and Recovery Act (tracking hazardous waste)) TRI REPORTER (Tracking of toxic chemicals releasing facilities) Business SIC classification: COATED AND LAMINATED PAPER Alternative names: COATING SCIENCES INC, COATING SCIENCES, INC. (FORMER)
HOMEBOUND (1133 BLUE HILLS AVENUE in BLOOMFIELD, CT)
(National Center for Education Statistics) - STATE ID-88 Organizations: BLOOMFIELD SCHOOL DISTRICT (SCHOOL DISTRICT)
GRANT HILL ASSOCIATES INC (21 GRANT HILL RD in BLOOMFIELD, CT)
(Integrated Compliance Information System) - ICIS-01-2000-0060, FORMAL ENFORCEMENT ACTION COMMUNITY WATER SYSTEM (SDWIS)
DADDARIO BROS (10 SOUTHWOOD RD in BLOOMFIELD, CT)
(Integrated Compliance Information System) - ICIS-01-1999-0023, FORMAL ENFORCEMENT ACTION
GRAPHIC CENTER, INC (26 TOBEY RD in BLOOMFIELD, CT)
AIR SYNTHETIC MINOR (AIRS/AFS) AIR MAJOR ("Best Available" air pollution technologies tracking) (Resource Conservation and Recovery Act (tracking hazardous waste)) Business SIC classification: COMMERCIAL PRINTING, LITHOGRAPHIC Organizations: CAMAR ASSOCIATES (CONTACT/OWNER)
PARK AVE CLEANERS (768 PARK AVE in BLOOMFIELD, CT)
(Resource Conservation and Recovery Act (tracking hazardous waste)) Small Quantity Generators, between 100 kg and 1000 kg of hazardous waste/month (Resource Conservation and Recovery Act (tracking hazardous waste)) - notification Organizations: OWNERNAME (CONTACT/OWNER)
, BLOOMFIELD DRY CLEANING CORP (CONTACT/OWNER)
Alternative names: BLOOMFIELD DRY CLEANING CORP
FAMILY DENTAL PRACTICE (800 COTTAGE GROVE RD in BLOOMFIELD, CT)
ADCO SERVICES, INC (27 PETERS RD in BLOOMFIELD, CT)
AIR MINOR (AIRS/AFS) Small Quantity Generators, between 100 kg and 1000 kg of hazardous waste/month (Resource Conservation and Recovery Act (tracking hazardous waste)) - notification Business SIC classification: COATING, ENGRAVING, AND ALLIED SERVICES Organizations: TERRY W WILCOX (CONTACT/OWNER)
Housing units lacking complete plumbing facilities: 0.9% Housing units lacking complete kitchen facilities: 1.4%
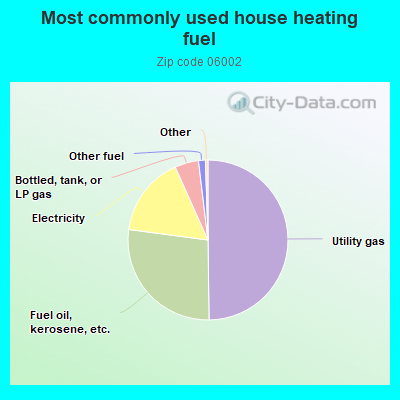
49.8%Utility gas
27.3%Fuel oil, kerosene, etc.
16.2%Electricity
4.8%Bottled, tank, or LP gas
1.4%Other fuel
Population in 1990: 19,524. Population change in the 1990s: +61 (+0.3%).
Place of birth for U.S.-born residents:
This state: 10,598
Northeast: 2,863
Midwest: 719
South: 1,771
West: 158
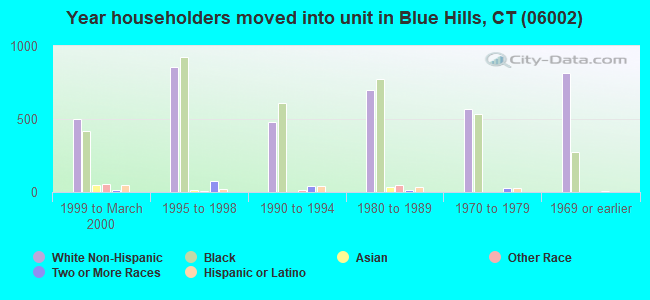
65% of the 06002 zip code residents lived in the same house 5 years ago. Out of people who lived in different houses, 79% lived in this county. Out of people who lived in different counties, 50% lived in Connecticut.
91% of the 06002 zip code residents lived in the same house 1 year ago. Out of people who lived in different houses, 53% moved from this county. Out of people who lived in different houses, 10% moved from different county within same state. Out of people who lived in different houses, 34% moved from different state. Out of people who lived in different houses, 3% moved from abroad.
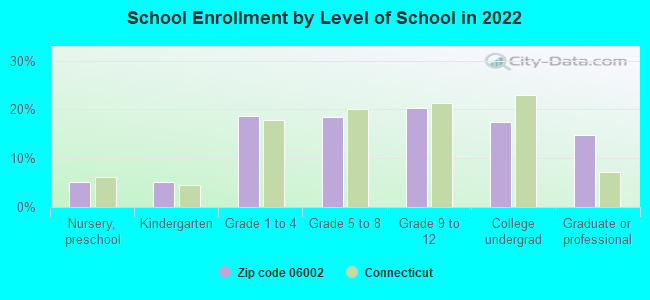
Private vs. public school enrollment:
Students in private schools in grades 1 to 8 (elementary and middle school): 108
Here:
6.9%
Connecticut:
9.5%
Students in private schools in grades 9 to 12 (high school): 151
Here:
17.5%
Connecticut:
12.9%
Students in private undergraduate colleges: 256
Here:
34.5%
Connecticut:
35.5%
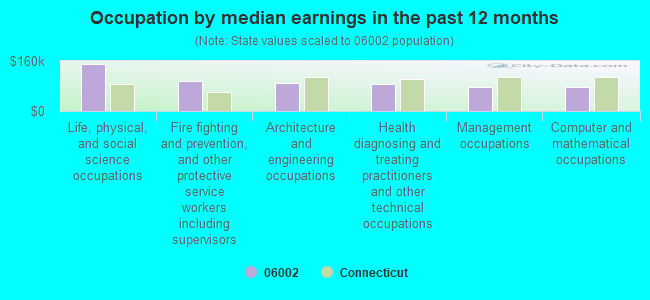
Occupation by median earnings in the past 12 months ($)
149,615Life, physical, and social science occupations
95,683Fire fighting and prevention, and other protective service workers including supervisors
88,620Architecture and engineering occupations
87,962Health diagnosing and treating practitioners and other technical occupations
78,309Management occupations
76,791Computer and mathematical occupations
Companies with biggest federal contracts located in this zip code (BLOOMFIELD, CT):
KAMAN AEROSPACE CORPORATION (OLD WINDSOR ROAD) : $87,905,723 in 240 contractsfrom 1999 to 2006
Contracts for Aircraft, Rotary Wing, Maintenance, Repair and Rebuilding of Equipment -- Engines, Turbines, and Components, Miscellaneous Aircraft Accessories and Components, Modification of Equipment -- Aircraft Components and Accessories, and moreby Department of State, Navy, Army, Air Force, and others Signed by year:2000: $12,456,305; 2001: $23,248,047; 2002: $8,494,703; 2003: $14,647,451; 2004: $13,020,605; 2005: $10,836,436; 2006: $4,242,152.
Biggest contracts:
$21,023,000 with Department of State for Aircraft, Rotary Wing. Signed on 2001-01-15. Completion date: 2005-02-15.
$4,300,403 with Navy for Maintenance, Repair and Rebuilding of Equipment -- Engines, Turbines, and Components. Signed on 2000-03-02. Completion date: 2000-12-31.
$3,923,329 with Army for Miscellaneous Aircraft Accessories and Components. Signed on 2004-01-30. Completion date: 2005-12-30.
$3,850,006 with Navy for Modification of Equipment -- Aircraft Components and Accessories. Signed on 2003-08-01. Completion date: 2004-07-31.
KAMATICS CORPORATION (1330 BLUE HILLS AVE; small business) : $31,218,603 in 426 contractsfrom 1999 to 2006
Contracts for Bearings, Plain, Unmounted, Helicopter Rotor Blades, Drive Mechanisms and Components, Gas Turbines and Jet Engines, Aircraft; Prime Moving, and Components, Bearings, Antifriction, Unmounted, and moreby Air Force, Army, Defense Logistics Agency, Navy, and others Signed by year:2000: $3,078,596; 2001: $3,344,922; 2002: $8,261,854; 2003: $2,760,215; 2004: $6,116,009; 2005: $4,642,971; 2006: $1,761,735.
Biggest contracts:
$1,430,055 with Air Force for Bearings, Plain, Unmounted. Signed on 2002-06-03. Completion date: 2003-01-31.
$1,265,490 with Army for Helicopter Rotor Blades, Drive Mechanisms and Components. Signed on 2004-04-29. Completion date: 2005-04-30.
$705,720, same as above.Signed on 2002-11-14. Completion date: 2004-12-31.
$628,298 with Air Force for Bearings, Plain, Unmounted. Signed on 2002-02-01. Completion date: 2003-01-31.
TURBINE CONTROLS, INC (5 OLD WINDSOR RD; small business) 100 employees, $0 revenue. : $22,614,122 in 100 contractsfrom 1999 to 2006
Contracts for Miscellaneous Engine Accessories, Aircraft, Engine Fuel System Components, Aircraft and Missile Prime Movers, Maintenance, Repair and Rebuilding of Equipment -- Engine Accessories, Gas Turbines and Jet Engines, Aircraft; Prime Moving, and Components, and moreby Air Force, Army, Defense Logistics Agency Signed by year:2000: $3,140,256; 2001: $526,652; 2002: $1,544,233; 2003: $3,165,517; 2004: $6,268,828; 2005: $4,812,954; 2006: $2,601,887.
Biggest contracts:
$1,171,469 with Air Force for Miscellaneous Engine Accessories, Aircraft. Signed on 2004-07-07. Completion date: 2005-02-28.
$1,107,071, same as above.Signed on 2004-11-24. Completion date: 2005-11-30.
$1,002,391, same as above.Signed on 2004-04-21. Completion date: 2004-12-31.
$928,050 with Air Force for Engine Fuel System Components, Aircraft and Missile Prime Movers. Signed on 2006-04-11. Completion date: 2006-04-11.
THE BIRKEN MANUFACTURING COMPA (3 OLD WINDSOR RD; small business) : $14,351,233 in 179 contractsfrom 1999 to 2006
Contracts for Aircraft Landing Gear Components, Gas Turbines and Jet Engines, Aircraft; Prime Moving, and Components, Bearings, Antifriction, Unmounted, Engine Fuel System Components, Aircraft and Missile Prime Movers, and moreby Army, Air Force, Defense Logistics Agency, Navy, and others Signed by year:2000: $2,036,450; 2001: $305,058; 2002: $2,283,847; 2003: $2,401,051; 2004: $4,402,697; 2005: $1,922,508; 2006: $904,774.
Biggest contracts:
$3,182,743 with Army for Aircraft Landing Gear Components. Signed on 2004-02-10. Completion date: 2007-09-15.
$1,246,875, same as above.Signed on 2003-01-08. Completion date: 2006-09-30.
$1,020,346 with Air Force for Gas Turbines and Jet Engines, Aircraft; Prime Moving, and Components. Signed on 2000-09-29. Completion date: 2005-09-30.
$997,500 with Army for Aircraft Landing Gear Components. Signed on 2002-09-29. Completion date: 2004-04-15.
BEACON IND , INC (85 GRANBY STREET; small business) 250 employees, $0 revenue. Woman Owned Business: $6,657,730 in 41 contractsfrom 1999 to 2006
Contracts for Gas Turbines and Jet Engines, Aircraft; Prime Moving, and Components by Air Force, Defense Logistics Agency, Army Signed by year:2000: $2,168,540; 2001: $1,072,692; 2002: $914,657; 2003: $95,096; 2004: $858,430; 2005: $1,194,234; 2006: $23,848.
Biggest contracts:
$825,456 with Air Force for Gas Turbines and Jet Engines, Aircraft; Prime Moving, and Components. Signed on 2004-07-01. Completion date: 2005-12-31.
$728,195, same as above.Signed on 2002-01-18. Completion date: 2003-03-31.
$644,785 with Defense Logistics Agency for Gas Turbines and Jet Engines, Aircraft; Prime Moving, and Components. Signed on 2000-04-10. Completion date: 2001-04-25.
$605,798, same as above.Signed on 2000-05-08. Completion date: 2001-09-22.
S & S PRECISION MACHINE CORP (4 BRITTON DR; small business) : $6,621,911 in 48 contractsfrom 1999 to 2006
Contracts for Nuts and Washers, Aircraft Landing Gear Components, Airframe Structural Components, Gas Turbines and Jet Engines, Aircraft; Prime Moving, and Components, and moreby Army, Defense Logistics Agency Signed by year:2000: $1,000,652; 2001: $795,714; 2002: $322,234; 2003: $793,692; 2004: $1,729,174; 2005: $1,787,067; 2006: $95,250.
Biggest contracts:
$1,452,370 with Army for Nuts and Washers. Signed on 2002-03-27. Completion date: 2005-05-31.
$675,122 with Army for Aircraft Landing Gear Components. Signed on 2005-06-20. Completion date: 2004-12-31.
$622,000 with Army for Nuts and Washers. Signed on 2003-04-03. Completion date: 2004-09-30.
$540,750 with Army for Airframe Structural Components. Signed on 2005-02-10. Completion date: 2007-09-30.
TRIUMPH GROUP INC (500 COTTAGE GROVE ROAD) : $4,231,442 in 3 contractsfrom 2005 to 2006
$2,474,217 with Army for Guns, over 150 mm through 200 mm. Signed on 2006-04-19. Completion date: 2009-03-16.
$1,739,558, same as above.Signed on 2005-03-17. Completion date: 2009-03-16.
$17,667, same as above.Signed on 2005-06-20. Completion date: 2009-03-16.
PDS ENGINEERING & CONSTRUCTION (107 OLD WINDSOR RD; small business) : $1,974,790 in 3 contractsfrom 2002 to 2005
$1,968,000 with Army for Construction of Structures and Facilities -- Other Administrative Facilities and Service Buildings. Signed on 2002-09-26. Completion date: 2003-05-16.
$22,368, same as above.Signed on 2005-06-10. Completion date: 2003-05-16.
-$15,578, same as above.Signed on 2004-05-07. Completion date: 2003-05-16.
DEMARIA ELECTRO OPTICS SYSTEMS (1280 BLUE HILLS AVE) : $1,453,086 in 5 contractsfrom 1999 to 2001
Contracts for Defense Ships -- Basic Research (R&D), Physical Properties Testing and Inspection, Other Research and Development -- Basic Research (R&D), Optical Instruments, Test Equipment, Components and Accessories by Navy, Air Force, National Oceanic and Atmospheric Administration/Under Secretary for Oceans and Atmosphere, Army, and others Signed by year:2000: $674,485; 2001: $638,501; 2002: $0; 2003: $0; 2004: $0; 2005: $0; 2006: $0.
Biggest contracts:
$599,485 with Navy for Defense Ships -- Basic Research (R&D). Signed on 2001-01-29. Completion date: 2002-01-11.
$599,485, same as above.Signed on 2000-01-12. Completion date: 2002-01-11.
$140,100 with Air Force for Physical Properties Testing and Inspection. Signed on 1999-11-03. Completion date: 2000-03-31.
$75,000 with National Oceanic and Atmospheric Administration/Under Secretary for Oceans and Atmosphere for Other Research and Development -- Basic Research (R&D). Signed on 2000-07-15. Completion date: 2001-02-15.
HARTFORD AIRCRAFT PRODUCTS, IN (94 OLD POQUONOCK RD; small business) : $1,382,321 in 16 contractsfrom 2000 to 2005
Contracts for Screws, Nuts and Washers, Bolts, Guns, 75 mm through 125 mm by Defense Logistics Agency Signed by year:2000: $66,861; 2001: $0; 2002: $196,250; 2003: $423,900; 2004: $98,125; 2005: $597,185; 2006: $0.
Biggest contracts:
$368,000 with Defense Logistics Agency for Screws. Signed on 2005-02-24. Completion date: 2005-04-10.
$219,800, same as above.Signed on 2003-10-21. Completion date: 2004-04-11.
$200,000, same as above.Signed on 2005-02-24. Completion date: 2005-04-10.
$98,910, same as above.Signed on 2002-02-28. Completion date: 2002-03-30.
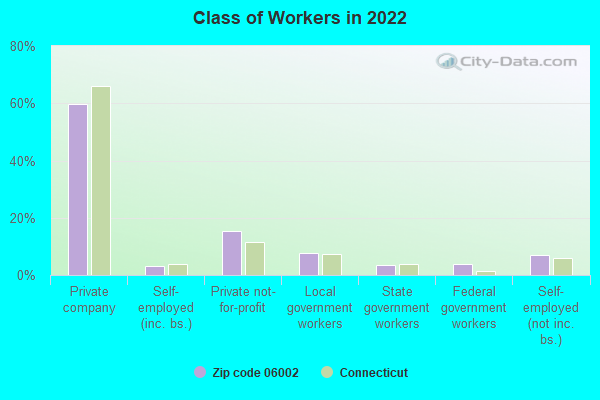
Top industries in this zip code by the number of employees in 2005:
Finance and Insurance: Direct Health and Medical Insurance Carriers (over 1000 employees: 1 establishment, 100-249 employees: 2 establishments, 20-49 employees: 1 establishment, 5-9 employees: 1 establishment)
Health Care and Social Assistance: Continuing Care Retirement Communities (250-499: 2)
Management of Companies and Enterprises: Corporate, Subsidiary, and Regional Managing Offices (250-499: 1, 100-249: 1, 50-99: 1, 10-19: 1)
Health Care and Social Assistance: Nursing Care Facilities (100-249: 3)
Construction: Highway, Street, and Bridge Construction (250-499: 1, 20-49: 2, 10-19: 1, 5-9: 1, 1-4: 2)
Health Care and Social Assistance: Offices of Physicians (except Mental Health Specialists) (20-49: 4, 10-19: 7, 5-9: 11, 1-4: 15)
People in group quarters in 2010:
473 people in nursing facilities/skilled-nursing facilities
54 people in correctional residential facilities
52 people in other noninstitutional facilities
39 people in group homes intended for adults
11 people in group homes for juveniles (non-correctional)
6 people in residential treatment centers for adults
People in group quarters in 2000:
491 people in nursing homes
24 people in homes for the mentally ill
17 people in religious group quarters
15 people in homes for the mentally retarded
6 people in other group homes
Fatal accident statistics in 2014:
Fatal accident count: 5
Vehicles involved in fatal accidents: 8
Fatal accidents caused by drunken drivers: 0
Fatalities: 5
Persons involved in fatal accidents: 10
Pedestrians involved in fatal accidents: 2
Fatal accident statistics in 2013:
Fatal accident count: 3
Vehicles involved in fatal accidents: 4
Fatal accidents caused by drunken drivers: 0
Fatalities: 3
Persons involved in fatal accidents: 5
Pedestrians involved in fatal accidents: 1
Home Mortgage Disclosure Act Aggregated Statistics For Year 2009 (Based on 7 full and 2 partial tracts)
A) FHA, FSA/RHS & VA Home Purchase Loans
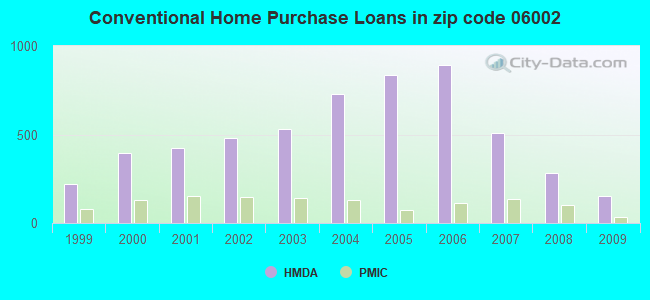
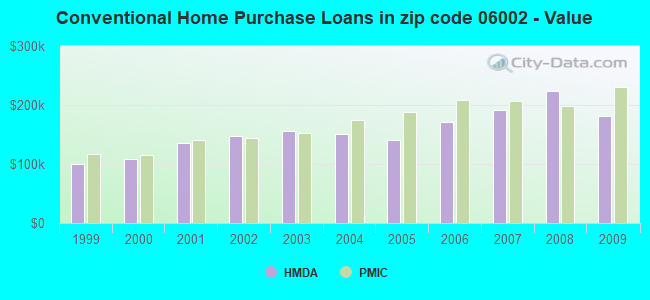
B) Conventional Home Purchase Loans
C) Refinancings
D) Home Improvement Loans
E) Loans on Dwellings For 5+ Families
F) Non-occupant Loans on < 5 Family Dwellings (A B C & D)
Number
Average Value
Number
Average Value
Number
Average Value
Number
Average Value
Number
Average Value
Number
Average Value
LOANS ORIGINATED
215
$175,479
153
$181,913
669
$191,126
61
$77,478
2
$599,820
13
$147,835
APPLICATIONS APPROVED, NOT ACCEPTED
13
$160,373
22
$262,883
119
$178,800
17
$64,855
0
$0
4
$349,895
APPLICATIONS DENIED
65
$165,052
19
$154,897
384
$175,621
69
$51,273
0
$0
15
$179,367
APPLICATIONS WITHDRAWN
36
$146,632
15
$207,397
180
$180,188
18
$57,118
0
$0
0
$0
FILES CLOSED FOR INCOMPLETENESS
17
$147,411
11
$264,592
51
$154,707
2
$179,945
0
$0
2
$187,795
Aggregated Statistics For Year 2008 (Based on 7 full and 2 partial tracts)
A) FHA, FSA/RHS & VA Home Purchase Loans
B) Conventional Home Purchase Loans
C) Refinancings
D) Home Improvement Loans
E) Loans on Dwellings For 5+ Families
F) Non-occupant Loans on < 5 Family Dwellings (A B C & D)
Number
Average Value
Number
Average Value
Number
Average Value
Number
Average Value
Number
Average Value
Number
Average Value
LOANS ORIGINATED
159
$188,051
280
$222,936
492
$168,866
148
$28,849
4
$13,146,055
41
$136,083
APPLICATIONS APPROVED, NOT ACCEPTED
19
$198,216
56
$240,208
124
$139,826
32
$45,088
0
$0
20
$153,576
APPLICATIONS DENIED
86
$160,202
63
$176,059
586
$168,914
188
$37,135
2
$146,285
27
$142,196
APPLICATIONS WITHDRAWN
20
$193,317
20
$182,646
172
$187,100
10
$125,478
0
$0
12
$192,226
FILES CLOSED FOR INCOMPLETENESS
4
$166,450
8
$241,798
57
$206,812
8
$82,591
0
$0
2
$160,120
Aggregated Statistics For Year 2007 (Based on 7 full and 2 partial tracts)
A) FHA, FSA/RHS & VA Home Purchase Loans
B) Conventional Home Purchase Loans
C) Refinancings
D) Home Improvement Loans
F) Non-occupant Loans on < 5 Family Dwellings (A B C & D)
Number
Average Value
Number
Average Value
Number
Average Value
Number
Average Value
Number
Average Value
LOANS ORIGINATED
117
$199,888
510
$190,776
829
$161,258
217
$50,956
62
$149,768
APPLICATIONS APPROVED, NOT ACCEPTED
10
$182,021
85
$216,806
241
$158,474
67
$56,804
9
$129,339
APPLICATIONS DENIED
23
$233,512
160
$159,826
906
$156,912
238
$57,033
43
$164,280
APPLICATIONS WITHDRAWN
6
$181,877
75
$183,675
374
$167,094
27
$66,133
22
$127,210
FILES CLOSED FOR INCOMPLETENESS
2
$312,905
28
$147,590
82
$162,361
6
$32,725
2
$183,740
Aggregated Statistics For Year 2006 (Based on 7 full and 2 partial tracts)
A) FHA, FSA/RHS & VA Home Purchase Loans
B) Conventional Home Purchase Loans
C) Refinancings
D) Home Improvement Loans
F) Non-occupant Loans on < 5 Family Dwellings (A B C & D)
G) Loans On Manufactured Home Dwelling (A B C & D)
Number
Average Value
Number
Average Value
Number
Average Value
Number
Average Value
Number
Average Value
Number
Average Value
LOANS ORIGINATED
89
$187,631
895
$170,516
1,140
$151,900
256
$54,542
93
$158,591
2
$104,605
APPLICATIONS APPROVED, NOT ACCEPTED
8
$160,860
179
$164,200
342
$137,841
67
$58,371
23
$137,787
0
$0
APPLICATIONS DENIED
16
$180,091
309
$133,389
997
$155,376
220
$73,348
69
$114,583
0
$0
APPLICATIONS WITHDRAWN
16
$163,803
127
$166,177
648
$156,350
53
$86,480
26
$142,980
0
$0
FILES CLOSED FOR INCOMPLETENESS
0
$0
53
$147,485
140
$171,285
17
$102,001
12
$119,452
0
$0
Aggregated Statistics For Year 2005 (Based on 7 full and 2 partial tracts)
A) FHA, FSA/RHS & VA Home Purchase Loans
B) Conventional Home Purchase Loans
C) Refinancings
D) Home Improvement Loans
E) Loans on Dwellings For 5+ Families
F) Non-occupant Loans on < 5 Family Dwellings (A B C & D)
G) Loans On Manufactured Home Dwelling (A B C & D)
Number
Average Value
Number
Average Value
Number
Average Value
Number
Average Value
Number
Average Value
Number
Average Value
Number
Average Value
LOANS ORIGINATED
62
$165,537
838
$140,555
1,379
$147,092
225
$72,481
2
$299,910
55
$150,907
2
$124,825
APPLICATIONS APPROVED, NOT ACCEPTED
11
$166,376
123
$158,121
317
$133,508
30
$64,626
0
$0
15
$150,263
0
$0
APPLICATIONS DENIED
10
$152,696
241
$137,117
1,137
$137,453
214
$54,811
2
$211,705
61
$115,699
2
$54,575
APPLICATIONS WITHDRAWN
8
$156,746
173
$127,351
1,012
$150,680
82
$170,998
0
$0
28
$149,522
2
$108,725
FILES CLOSED FOR INCOMPLETENESS
2
$122,560
28
$119,028
120
$138,621
10
$84,655
0
$0
14
$92,049
0
$0
Aggregated Statistics For Year 2004 (Based on 7 full and 2 partial tracts)
A) FHA, FSA/RHS & VA Home Purchase Loans
B) Conventional Home Purchase Loans
C) Refinancings
D) Home Improvement Loans
F) Non-occupant Loans on < 5 Family Dwellings (A B C & D)
G) Loans On Manufactured Home Dwelling (A B C & D)
Number
Average Value
Number
Average Value
Number
Average Value
Number
Average Value
Number
Average Value
Number
Average Value
LOANS ORIGINATED
99
$150,827
728
$150,771
1,392
$134,875
189
$51,895
72
$130,096
4
$58,482
APPLICATIONS APPROVED, NOT ACCEPTED
11
$127,872
133
$140,611
385
$125,120
62
$54,060
18
$93,662
0
$0
APPLICATIONS DENIED
24
$144,340
189
$124,688
1,029
$131,595
187
$33,691
54
$109,164
4
$88,905
APPLICATIONS WITHDRAWN
19
$140,056
105
$131,372
1,061
$142,556
49
$72,049
19
$143,346
0
$0
FILES CLOSED FOR INCOMPLETENESS
0
$0
34
$151,615
127
$137,890
13
$38,236
3
$104,980
0
$0
Aggregated Statistics For Year 2003 (Based on 7 full and 2 partial tracts)
A) FHA, FSA/RHS & VA Home Purchase Loans
B) Conventional Home Purchase Loans
C) Refinancings
D) Home Improvement Loans
F) Non-occupant Loans on < 5 Family Dwellings (A B C & D)
Number
Average Value
Number
Average Value
Number
Average Value
Number
Average Value
Number
Average Value
LOANS ORIGINATED
127
$127,118
531
$156,754
2,279
$128,864
123
$21,931
75
$111,498
APPLICATIONS APPROVED, NOT ACCEPTED
13
$128,211
104
$150,378
441
$130,440
35
$21,496
11
$119,686
APPLICATIONS DENIED
17
$134,561
127
$125,135
1,064
$120,863
171
$24,561
33
$99,458
APPLICATIONS WITHDRAWN
12
$110,667
78
$133,995
727
$122,674
31
$26,016
4
$163,270
FILES CLOSED FOR INCOMPLETENESS
2
$85,990
16
$111,648
89
$124,170
16
$23,381
4
$43,938
Aggregated Statistics For Year 2002 (Based on 7 full and 2 partial tracts)
A) FHA, FSA/RHS & VA Home Purchase Loans
B) Conventional Home Purchase Loans
C) Refinancings
D) Home Improvement Loans
F) Non-occupant Loans on < 5 Family Dwellings (A B C & D)
Number
Average Value
Number
Average Value
Number
Average Value
Number
Average Value
Number
Average Value
LOANS ORIGINATED
183
$124,952
479
$147,464
1,220
$116,613
123
$35,024
41
$100,101
APPLICATIONS APPROVED, NOT ACCEPTED
19
$114,588
54
$161,445
269
$118,752
41
$20,867
15
$109,271
APPLICATIONS DENIED
26
$122,436
70
$118,406
713
$94,173
145
$24,948
37
$65,768
APPLICATIONS WITHDRAWN
10
$135,480
51
$142,322
448
$110,553
42
$30,374
10
$79,291
FILES CLOSED FOR INCOMPLETENESS
4
$75,395
17
$111,606
89
$101,999
0
$0
0
$0
Aggregated Statistics For Year 2001 (Based on 7 full and 2 partial tracts)
A) FHA, FSA/RHS & VA Home Purchase Loans
B) Conventional Home Purchase Loans
C) Refinancings
D) Home Improvement Loans
F) Non-occupant Loans on < 5 Family Dwellings (A B C & D)
Number
Average Value
Number
Average Value
Number
Average Value
Number
Average Value
Number
Average Value
LOANS ORIGINATED
217
$113,000
425
$135,445
954
$106,889
137
$19,483
42
$76,941
APPLICATIONS APPROVED, NOT ACCEPTED
8
$125,685
35
$141,683
150
$97,409
29
$17,634
6
$87,570
APPLICATIONS DENIED
24
$118,316
83
$133,673
809
$87,566
215
$14,688
23
$71,790
APPLICATIONS WITHDRAWN
10
$119,337
24
$123,370
378
$102,908
47
$21,204
4
$43,475
FILES CLOSED FOR INCOMPLETENESS
8
$139,971
15
$110,215
140
$102,003
15
$23,590
1
$128,000
Aggregated Statistics For Year 2000 (Based on 7 full and 2 partial tracts)
A) FHA, FSA/RHS & VA Home Purchase Loans
B) Conventional Home Purchase Loans
C) Refinancings
D) Home Improvement Loans
E) Loans on Dwellings For 5+ Families
F) Non-occupant Loans on < 5 Family Dwellings (A B C & D)
Number
Average Value
Number
Average Value
Number
Average Value
Number
Average Value
Number
Average Value
Number
Average Value
LOANS ORIGINATED
217
$111,282
397
$109,034
324
$90,905
133
$21,460
4
$3,994,400
29
$58,920
APPLICATIONS APPROVED, NOT ACCEPTED
9
$90,687
47
$119,668
119
$91,795
82
$17,013
0
$0
8
$58,188
APPLICATIONS DENIED
20
$108,194
115
$120,992
579
$75,126
256
$21,248
0
$0
8
$119,910
APPLICATIONS WITHDRAWN
16
$107,234
48
$109,669
203
$75,100
37
$49,700
0
$0
4
$143,422
FILES CLOSED FOR INCOMPLETENESS
2
$148,955
19
$109,546
129
$97,937
4
$12,992
0
$0
0
$0
Aggregated Statistics For Year 1999 (Based on 4 full and 1 partial tracts)
A) FHA, FSA/RHS & VA Home Purchase Loans
B) Conventional Home Purchase Loans
C) Refinancings
D) Home Improvement Loans
F) Non-occupant Loans on < 5 Family Dwellings (A B C & D)
2002 - 2018 National Fire Incident Reporting System (NFIRS) incidents
Based on the data from the years 2002 - 2018 the average number of fires per year is 106. The highest number of fire incidents - 162 took place in 2011, and the least - 36 in 2002. The data has a rising trend.
When looking into fire subcategories, the most reports belonged to: Structure Fires (65.0%), and Outside Fires (18.8%).
Fire incident types reported to NFIRS in Zip Code 06002


 Nearest zip codes: 06117, 06081, 06112, 06095, 06070, 06105.


 Based on the data from the years 2002 - 2018 the average number of fires per year is 106. The highest number of fire incidents - 162 took place in 2011, and the least - 36 in 2002. The data has a rising trend.
 When looking into fire subcategories, the most reports belonged to: Structure Fires (65.0%), and Outside Fires (18.8%).