Estimated zip code population in 2022: 13,652 Zip code population in 2010: 13,881 Zip code population in 2000: 13,951
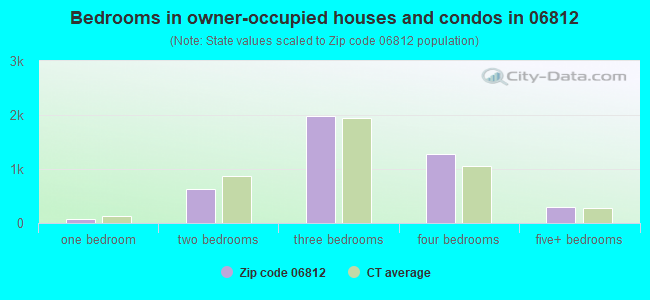
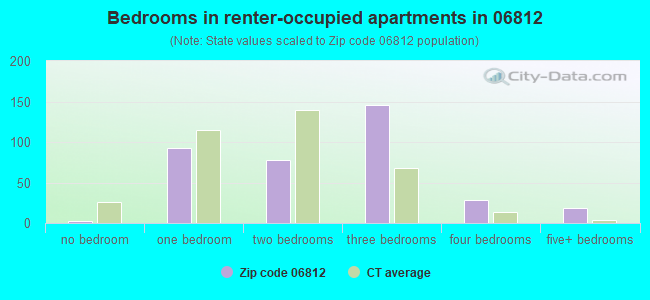
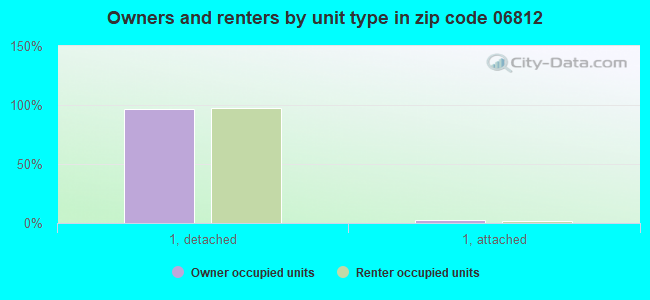
Houses and condos: 5,335 Renter-occupied apartments: 376
% of renters here:
8%
State:
34%
March 2022 cost of living index in zip code 06812: 129.1 (high, U.S. average is 100)
Land area: 20.4 sq. mi. Water area: 4.7 sq. mi.
Population density: 668 people per square mile
(low).
OSM Map
Google Map
MSN Map
OSM Map
General Map
Google Map
MSN Map
OSM Map
Google Map
MSN Map
OSM Map
Google Map
MSN Map
Please wait while loading the map...
Real estate property taxes paid for housing units in 2022:
This zip code:
1.5% ($6,727)
Connecticut:
1.8% ($6,189)
Median real estate property taxes paid for housing units with mortgages in 2022: $6,834 (1.5%) Median real estate property taxes paid for housing units with no mortgage in 2022: $6,518 (1.5%)
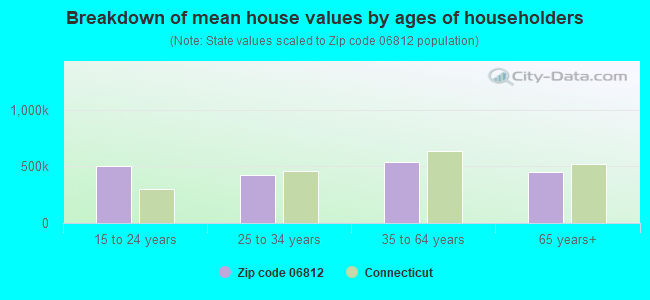
Estimated median house/condo value in 2022: $447,166
06812:
$447,166
Connecticut:
$347,200
According to our research of Connecticut and other state lists, there were 3 registered sex offenders living in 06812 zip code as of April 27, 2024. The ratio of all residents to sex offenders in zip code 06812 is 4,759 to 1. The ratio of registered sex offenders to all residents in this zip code is much lower than the state average.
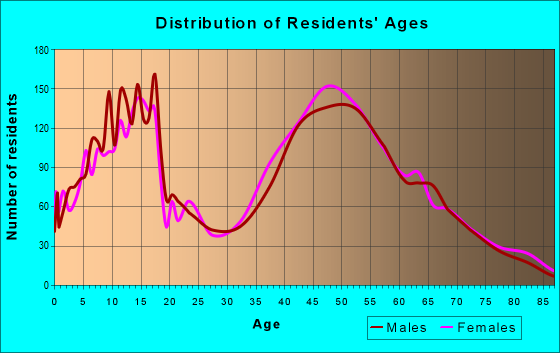
Median resident age:
This zip code:
42.3 years
Connecticut median age:
40.9 years
Average household size:
This zip code:
2.9 people
Connecticut:
2.5 people
Averages for the 2020 tax year for zip code 06812, filed in 2021:
Average Adjusted Gross Income (AGI) in 2020: $113,757 (Individual Income Tax Returns)
Here:
$113,757
State:
$105,931
Salary/wage: $101,487 (reported on 80.4% of returns)
Here:
$101,487
State:
$83,540
(% of AGI for various income ranges: 1087.4% for AGIs below $25k, 3444.0% for AGIs $25k-50k, 6252.5% for AGIs $50k-75k, 9104.8% for AGIs $75k-100k, 18450.8% for AGIs $100k-200k, 89859.0% for AGIs over 200k)
Taxable interest for individuals: $2,100 (reported on 43.4% of returns)
This zip code:
$2,100
Connecticut:
$3,402
(% of AGI for various income ranges: 30.0% for AGIs below $25k, 43.2% for AGIs $25k-50k, 62.0% for AGIs $50k-75k, 98.8% for AGIs $75k-100k, 170.0% for AGIs $100k-200k, 1069.7% for AGIs over 200k)
Ordinary dividends: $7,679 (reported on 35.6% of returns)
Here:
$7,679
State:
$12,683
(% of AGI for various income ranges: 50.0% for AGIs below $25k, 88.5% for AGIs $25k-50k, 150.0% for AGIs $50k-75k, 265.6% for AGIs $75k-100k, 467.1% for AGIs $100k-200k, 3687.7% for AGIs over 200k)
Net capital gain/loss in AGI: +$13,932 (reported on 30.6% of returns)
Here:
+$13,932
State:
+$44,158
(% of AGI for various income ranges: 25.8% for AGIs below $25k, 67.7% for AGIs $25k-50k, 90.5% for AGIs $50k-75k, 311.9% for AGIs $75k-100k, 600.6% for AGIs $100k-200k, 6965.7% for AGIs over 200k)
Profit/loss from business: +$23,277 (reported on 18.4% of returns)
Here:
+$23,277
State:
+$22,988
(% of AGI for various income ranges: 170.7% for AGIs below $25k, 308.0% for AGIs $25k-50k, 314.3% for AGIs $50k-75k, 334.2% for AGIs $75k-100k, 824.5% for AGIs $100k-200k, 4769.0% for AGIs over 200k)
Taxable individual retirement arrangement distribution: $23,015 (reported on 13.2% of returns)
06812:
$23,015
Connecticut:
$22,031
(% of AGI for various income ranges: 86.5% for AGIs below $25k, 185.9% for AGIs $25k-50k, 273.7% for AGIs $50k-75k, 451.7% for AGIs $75k-100k, 848.2% for AGIs $100k-200k, 2286.7% for AGIs over 200k)
Self-employed (Keogh) retirement plans: $20,518 (reported on 1.6% of returns)
06812:
$20,518
Connecticut:
$29,016
(% of AGI for various income ranges: 22.5% for AGIs $25k-50k, 52.2% for AGIs $100k-200k, 530.7% for AGIs over 200k)
Total itemized deductions: $29,356 (reported on 18.3% of returns)
Here:
$29,356
State:
$37,613
(% of AGI for various income ranges: 101.9% for AGIs below $25k, 350.1% for AGIs $25k-50k, 582.2% for AGIs $50k-75k, 863.1% for AGIs $75k-100k, 1234.8% for AGIs $100k-200k, 4676.0% for AGIs over 200k)
Charity contributions: $6,424 (reported on 15.1% of returns)
Here:
$6,424
State:
$13,557
(% of AGI for various income ranges: 5.9% for AGIs below $25k, 18.3% for AGIs $25k-50k, 45.3% for AGIs $50k-75k, 106.0% for AGIs $75k-100k, 201.7% for AGIs $100k-200k, 1263.7% for AGIs over 200k)
Taxes paid: $9,239 (reported on 18.3% of returns)
06812:
$9,239
State:
$9,096
(% of AGI for various income ranges: 31.6% for AGIs below $25k, 109.7% for AGIs $25k-50k, 184.3% for AGIs $50k-75k, 326.7% for AGIs $75k-100k, 436.2% for AGIs $100k-200k, 1233.3% for AGIs over 200k)
Earned income credit: $1,650 (reported on 5.8% of returns)
Here:
$1,650
State:
$2,059
(% of AGI for various income ranges: 38.2% for AGIs below $25k, 39.6% for AGIs $25k-50k)
Percentage of individuals using paid preparers for their 2020 taxes: 93.2%
Here:
93%
State:
93%
(% for various income ranges: 92.0% for AGIs below $25k, 91.4% for AGIs $25k-50k, 94.1% for AGIs $50k-75k, 94.4% for AGIs $75k-100k, 93.5% for AGIs $100k-200k, 94.7% for AGIs over 200k)
Averages for the 2012 tax year for zip code 06812, filed in 2013:
Average Adjusted Gross Income (AGI) in 2012: $100,933 (Individual Income Tax Returns)
Here:
$100,933
State:
$93,290
Salary/wage: $86,740 (reported on 84.2% of returns)
Here:
$86,740
State:
$73,117
(% of AGI for various income ranges: 71.2% for AGIs below $25k, 71.3% for AGIs $25k-50k, 69.8% for AGIs $50k-75k, 71.0% for AGIs $75k-100k, 80.9% for AGIs $100k-200k, 66.8% for AGIs over 200k)
Taxable interest for individuals: $1,769 (reported on 59.5% of returns)
This zip code:
$1,769
Connecticut:
$2,530
(% of AGI for various income ranges: 2.6% for AGIs below $25k, 1.5% for AGIs $25k-50k, 1.2% for AGIs $50k-75k, 1.0% for AGIs $75k-100k, 0.7% for AGIs $100k-200k, 1.1% for AGIs over 200k)
Ordinary dividends: $4,782 (reported on 37.5% of returns)
Here:
$4,782
State:
$10,909
(% of AGI for various income ranges: 2.8% for AGIs below $25k, 1.5% for AGIs $25k-50k, 1.9% for AGIs $50k-75k, 2.0% for AGIs $75k-100k, 1.4% for AGIs $100k-200k, 2.0% for AGIs over 200k)
Net capital gain/loss in AGI: +$7,421 (reported on 28.1% of returns)
Here:
+$7,421
State:
+$34,090
(% of AGI for various income ranges: 0.1% for AGIs $25k-50k, 1.1% for AGIs $50k-75k, 0.3% for AGIs $75k-100k, 0.6% for AGIs $100k-200k, 4.2% for AGIs over 200k)
Profit/loss from business: +$21,409 (reported on 18.4% of returns)
Here:
+$21,409
State:
+$22,741
(% of AGI for various income ranges: 9.3% for AGIs below $25k, 5.7% for AGIs $25k-50k, 4.2% for AGIs $50k-75k, 4.1% for AGIs $75k-100k, 2.7% for AGIs $100k-200k, 4.1% for AGIs over 200k)
Taxable individual retirement arrangement distribution: $18,483 (reported on 13.5% of returns)
06812:
$18,483
Connecticut:
$19,976
(% of AGI for various income ranges: 4.5% for AGIs below $25k, 4.4% for AGIs $25k-50k, 3.8% for AGIs $50k-75k, 4.3% for AGIs $75k-100k, 2.4% for AGIs $100k-200k, 1.5% for AGIs over 200k)
Self-employment retirement plans: $21,280 (reported on 1.5% of returns)
06812:
$21,280
Connecticut:
$24,004
(% of AGI for various income ranges: 0.3% for AGIs $100k-200k, 0.5% for AGIs over 200k)
Total itemized deductions: $30,509 (20% of AGI, reported on 58.4% of returns)
Here:
$30,509
State:
$33,239
Here:
19.9% of AGI
State:
18.9% of AGI
(% of AGI for various income ranges: 21.7% for AGIs below $25k, 20.6% for AGIs $25k-50k, 21.2% for AGIs $50k-75k, 21.4% for AGIs $75k-100k, 20.4% for AGIs $100k-200k, 13.5% for AGIs over 200k)
Charity contributions: $2,767 (reported on 51.9% of returns)
Here:
$2,767
State:
$4,947
(% of AGI for various income ranges: 1.0% for AGIs below $25k, 1.2% for AGIs $25k-50k, 1.3% for AGIs $50k-75k, 1.8% for AGIs $75k-100k, 1.6% for AGIs $100k-200k, 1.3% for AGIs over 200k)
Taxes paid: $16,017 (reported on 58.1% of returns)
06812:
$16,017
State:
$17,397
(% of AGI for various income ranges: 8.2% for AGIs below $25k, 8.0% for AGIs $25k-50k, 8.6% for AGIs $50k-75k, 9.5% for AGIs $75k-100k, 10.2% for AGIs $100k-200k, 8.7% for AGIs over 200k)
Earned income credit: $1,869 (reported on 5.4% of returns)
Here:
$1,869
State:
$2,053
(% of AGI for various income ranges: 2.4% for AGIs below $25k, 0.5% for AGIs $25k-50k)
Percentage of individuals using paid preparers for their 2012 taxes: 58.4%
Here:
58%
State:
55%
(% for various income ranges: 46.8% for AGIs below $25k, 56.5% for AGIs $25k-50k, 61.4% for AGIs $50k-75k, 65.7% for AGIs $75k-100k, 65.4% for AGIs $100k-200k, 66.7% for AGIs over 200k)
Averages for the 2004 tax year for zip code 06812, filed in 2005:
Average Adjusted Gross Income (AGI) in 2004: $79,186 (Individual Income Tax Returns)
Here:
$79,186
State:
$73,265
Salary/wage: $73,160 (reported on 84.2% of returns)
Here:
$73,160
State:
$62,030
(% of AGI for various income ranges: 145.4% for AGIs below $10k, 62.0% for AGIs $10k-25k, 72.6% for AGIs $25k-50k, 77.3% for AGIs $50k-75k, 82.6% for AGIs $75k-100k, 77.6% for AGIs over 100k)
Taxable interest for individuals: $1,435 (reported on 73.2% of returns)
This zip code:
$1,435
Connecticut:
$2,287
(% of AGI for various income ranges: 12.9% for AGIs below $10k, 4.5% for AGIs $10k-25k, 2.1% for AGIs $25k-50k, 1.4% for AGIs $50k-75k, 1.0% for AGIs $75k-100k, 1.1% for AGIs over 100k)
Taxable dividends: $3,242 (reported on 45.4% of returns)
Here:
$3,242
State:
$5,735
(% of AGI for various income ranges: 15.2% for AGIs below $10k, 3.0% for AGIs $10k-25k, 1.5% for AGIs $25k-50k, 1.7% for AGIs $50k-75k, 1.1% for AGIs $75k-100k, 1.9% for AGIs over 100k)
Net capital gain/loss: +$8,980 (reported on 35.9% of returns)
Here:
+$8,980
State:
+$23,694
(% of AGI for various income ranges: -4.5% for AGIs below $10k, 0.7% for AGIs $10k-25k, 0.6% for AGIs $25k-50k, 0.2% for AGIs $50k-75k, 0.9% for AGIs $75k-100k, 6.0% for AGIs over 100k)
Profit/loss from business: +$19,932 (reported on 18.1% of returns)
Here:
+$19,932
State:
+$20,783
(% of AGI for various income ranges: 4.5% for AGIs below $10k, 9.7% for AGIs $10k-25k, 7.9% for AGIs $25k-50k, 4.9% for AGIs $50k-75k, 4.8% for AGIs $75k-100k, 3.8% for AGIs over 100k)
IRA payment deduction: $3,361 (reported on 4.0% of returns)
06812:
$3,361
Connecticut:
$3,216
(% of AGI for various income ranges: 0.5% for AGIs $10k-25k, 0.4% for AGIs $25k-50k, 0.4% for AGIs $50k-75k, 0.2% for AGIs $75k-100k, 0.1% for AGIs over 100k)
Self-employed pension: $13,860 (reported on 2.3% of returns)
Here:
$13,860
Connecticut:
$17,335
(% of AGI for various income ranges: 0.2% for AGIs $25k-50k, 0.3% for AGIs $50k-75k, 0.3% for AGIs $75k-100k, 0.5% for AGIs over 100k)
Total itemized deductions: $25,908 (22% of AGI, reported on 60.1% of returns)
Here:
$25,908
State:
$24,919
Here:
22.0% of AGI
State:
18.6% of AGI
(% of AGI for various income ranges: 26.6% for AGIs below $10k, 25.7% for AGIs $10k-25k, 21.3% for AGIs $25k-50k, 23.3% for AGIs $50k-75k, 23.3% for AGIs $75k-100k, 17.8% for AGIs over 100k)
Charity contributions deductions: $2,787 (2% of AGI, reported on 56.6% of returns)
Here:
$2,787
State:
$3,762
Here:
2.3% of AGI
State:
2.7% of AGI
(% of AGI for various income ranges: 1.1% for AGIs below $10k, 1.5% for AGIs $10k-25k, 1.5% for AGIs $25k-50k, 2.1% for AGIs $50k-75k, 2.2% for AGIs $75k-100k, 2.0% for AGIs over 100k)
Total tax: $13,925 (reported on 83.1% of returns)
06812:
$13,925
State:
$15,148
(% of AGI for various income ranges: 4.1% for AGIs below $10k, 5.4% for AGIs $10k-25k, 7.9% for AGIs $25k-50k, 8.6% for AGIs $50k-75k, 9.4% for AGIs $75k-100k, 17.9% for AGIs over 100k)
Earned income credit: $1,332 (reported on 4.2% of returns)
Here:
$1,332
State:
$1,570
Percentage of individuals using paid preparers for their 2004 taxes: 61.5%
Here:
61%
State:
59%
(% for various income ranges: 50.0% for AGIs below $10k, 56.9% for AGIs $10k-25k, 62.4% for AGIs $25k-50k, 68.4% for AGIs $50k-75k, 64.7% for AGIs $75k-100k, 66.0% for AGIs over 100k)
Likely homosexual households (counted as self-reported same-sex unmarried-partner households)
Lesbian couples: 0.1% of all households
Gay men: 0.0% of all households
Household received Food Stamps/SNAP in the past 12 months: 158 Household did not receive Food Stamps/SNAP in the past 12 months: 4,488
Women who had a birth in the past 12 months: 115 (100 now married, 13 unmarried) Women who did not have a birth in the past 12 months: 2,537 (1,176 now married, 1,340 unmarried)
Housing units in zip code 06812 with a mortgage: 2,826 (449 second mortgage, 361 both second mortgage and home equity loan) Houses without a mortgage: 245
Median monthly owner costs for units with a mortgage: $2,608 Median monthly owner costs for units without a mortgage: $1,007
Residents with income below the poverty level in 2022:
This zip code:
5.1%
Whole state:
9.8%
Residents with income below 50% of the poverty level in 2022:
This zip code:
1.7%
Whole state:
4.8%
Median number of rooms in houses and condos:
Here:
6.9
State:
6.5
Median number of rooms in apartments:
Here:
5.6
State:
4.0
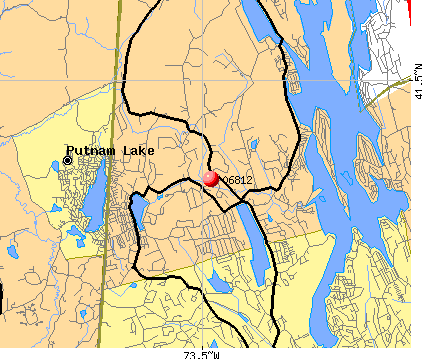
Notable locations in this zip code not listed on our city pages
Notable locations in zip code 06812: Camp Ludington (A), Hidden Valley Nature Center (B), Cadndlewood Lake Golf and Country Club (C), New Fairfield Town Hall (D), New Fairfield Free Public Library (E), Squantz Engine Company (F), Ball Pond Volunteer Fire Company (G), New Fairfield Fire Company A (H). Display/hide their locations on the map
Churches in zip code 06812 include: Beaver Bog Church (A), Good Shepherd Lutheran Church (B), Saint Edwards Church (C). Display/hide their locations on the map
Lakes, reservoirs, and swamps: Disbrow Pond (A), Gerow Millpond (B), Ball Pond (C), Squantz Pond (D), Forest Lake (E), Merton Mill Pond (F), Lake Candlewood (G), Beaver Bog (H). Display/hide their locations on the map
In group quarters: 23 (-1 institutionalized population)
Size of family households: 1,493 2-persons, 626 3-persons, 891 4-persons, 341 5-persons, 192 6-persons, 46 7-or-more-persons
Size of nonfamily households: 879 1-person, 128 2-persons, 16 3-persons
2,389 married couples with children.
573 single-parent households (249 men, 324 women).
87.2% of residents of 06812 zip code speak English at home.
6.8% of residents speak Spanish at home (76% very well, 19% well, 5% not well).
4.6% of residents speak other Indo-European language at home (73% very well, 25% well, 2% not well).
1.0% of residents speak Asian or Pacific Island language at home (45% very well, 15% well, 40% not well).
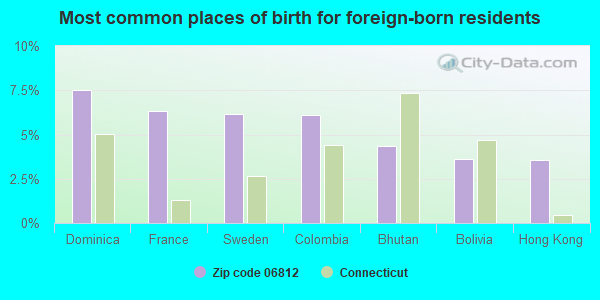
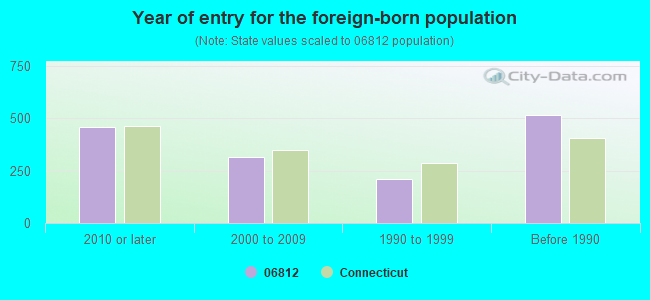
Foreign born population: 1,374 (10.1%) (57.5% of them are naturalized citizens)
This zip code:
10.1%
Whole state:
15.7%
7%Dominica
6%France
6%Sweden
6%Colombia
4%Bhutan
4%Bolivia
4%Hong Kong
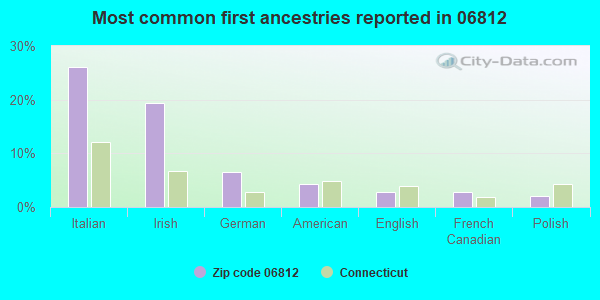
26%Italian
19%Irish
7%German
4%American
3%English
3%French Canadian
2%Polish
Year of entry for the foreign-born population
4562010 or later
3152000 to 2009
2121990 to 1999
515Before 1990
Facilities with environmental interests located in this zip code:
CONSOLIDATED SCHOOL (12 GILLOTTI ROAD in NEW FAIRFIELD, CT)
(National Center for Education Statistics) - STATE ID-1 Organizations: NEW FAIRFIELD SCHOOL DISTRICT (SCHOOL DISTRICT)
HOMEBOUND (3 BRUSH HILL ROAD in NEW FAIRFIELD, CT)
(National Center for Education Statistics) - STATE ID-88 Organizations: NEW FAIRFIELD SCHOOL DISTRICT (SCHOOL DISTRICT)
C.L.E.P. POLE # 5581 (WEST LAKE RESERVOIR in DANBURY, CT)
COMPLIANCE ACTIVITY (Tracking inspections of insecticide, fungicide, and rodenticide, and toxic substances) Alternative names: C.L. & P. POLE # 5581, C.L.E.P.TRANS. POLE # 5581
A T & T NEW FAIRFIELD RADIO STATION (TITICUS MOUNT ROAD in NEW FAIRFIELD, CT)
INNISFREE (54 PEMBROKE RTE 37 in NEW FAIRFIELD, CT)
(Resource Conservation and Recovery Act (tracking hazardous waste))
ZERRENNERS GARAGE (RTE 37 in NEW FAIRFIELD, CT)
(Resource Conservation and Recovery Act (tracking hazardous waste))
HEIDELBACH RESIDENCE (217 BALL POND ROAD in NEW FAIRFIELD, CT)
COMPLIANCE ACTIVITY (Tracking inspections of insecticide, fungicide, and rodenticide, and toxic substances)
CONSOLADATED SCHOOL (12 GILOTTI ROAD in NEW FAIRFIELD, CT)
COMPLIANCE ACTIVITY (Tracking inspections of insecticide, fungicide, and rodenticide, and toxic substances)
NU SPILL (CANDEL HILL RD in NEW FAIRFIELD, CT)
COMPLIANCE ACTIVITY (Tracking inspections of insecticide, fungicide, and rodenticide, and toxic substances)
NU SPILL (EAGLE DR in DANBURY, CT)
COMPLIANCE ACTIVITY (Tracking inspections of insecticide, fungicide, and rodenticide, and toxic substances)
NU SPILL (YE OLDE RD in NEW FAIRFIELD, CT)
COMPLIANCE ACTIVITY (Tracking inspections of insecticide, fungicide, and rodenticide, and toxic substances)
PARTENIO RESIDENCE (2 BIRCH DR in NEW FAIRFIELD, CT)
COMPLIANCE ACTIVITY (Tracking inspections of insecticide, fungicide, and rodenticide, and toxic substances)
Housing units lacking complete plumbing facilities: 1.8% Housing units lacking complete kitchen facilities: 0.0%
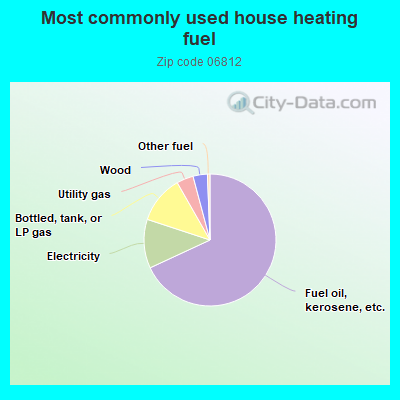
67.6%Fuel oil, kerosene, etc.
11.9%Electricity
11.6%Bottled, tank, or LP gas
4.1%Utility gas
3.5%Wood
0.6%Other fuel
Population in 1990: 13,013. Population change in the 1990s: +938 (+7.2%).
Place of birth for U.S.-born residents:
This state: 4,636
Northeast: 6,546
Midwest: 409
South: 406
West: 273
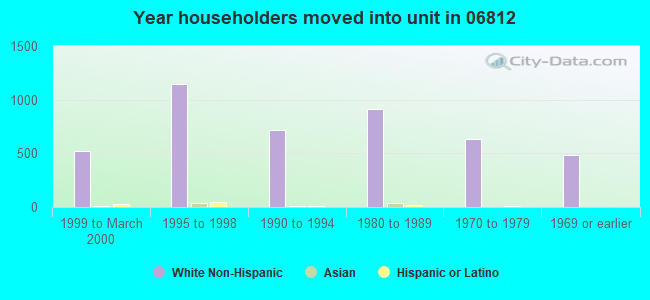
64% of the 06812 zip code residents lived in the same house 5 years ago. Out of people who lived in different houses, 43% lived in this county. Out of people who lived in different counties, 50% lived in Connecticut.
94% of the 06812 zip code residents lived in the same house 1 year ago. Out of people who lived in different houses, 38% moved from this county. Out of people who lived in different houses, 2% moved from different county within same state. Out of people who lived in different houses, 66% moved from different state. Out of people who lived in different houses, 7% moved from abroad.
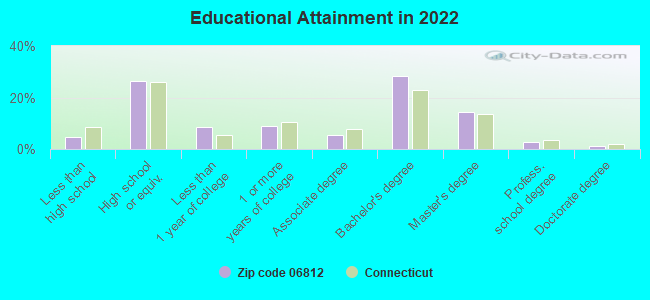
Private vs. public school enrollment:
Students in private schools in grades 1 to 8 (elementary and middle school): 35
Here:
2.7%
Connecticut:
9.5%
Students in private schools in grades 9 to 12 (high school): 81
Here:
10.0%
Connecticut:
12.9%
Students in private undergraduate colleges: 243
Here:
31.7%
Connecticut:
35.5%
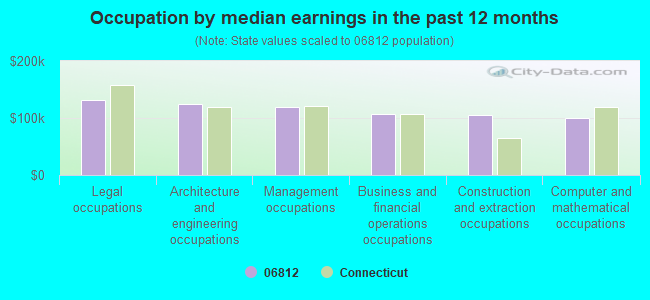
Occupation by median earnings in the past 12 months ($)
132,358Legal occupations
124,423Architecture and engineering occupations
118,739Management occupations
106,751Business and financial operations occupations
105,101Construction and extraction occupations
99,733Computer and mathematical occupations
Companies with federal contracts located in this zip code:
VIDEO AUTOMATION SYSTEMS, INC (13 ARROW MEADOW ROAD in NEW FAIRFIELD, CT; small business) : $2,885,233 in 16 contractsfrom 2000 to 2004
Contracts for Video Recording and Reproducing Equipment by Navy Signed by year:2000: $2,419,881; 2001: $173,066; 2002: $67,490; 2003: $83,814; 2004: $140,982; 2005: $0; 2006: $0.
Biggest contracts:
$2,340,703 with Navy for Video Recording and Reproducing Equipment. Taking place in NY. Signed on 2000-09-11. Completion date: 2005-09-10.
$108,840, same as above.Signed on 2001-05-07. Completion date: 2001-08-08.
$79,178, same as above.Signed on 2000-08-11. Completion date: 2000-11-11.
$71,424 with Navy for Video Recording and Reproducing Equipment. Signed on 2004-01-14. Completion date: 2004-03-15.
Top industries in this zip code by the number of employees in 2005:
Health Care and Social Assistance: Child Day Care Services (20-49 employees: 2 establishments, 5-9 employees: 1 establishment, 1-4 employees: 2 establishments)
Wholesale Trade: Other Electronic Parts and Equipment Merchant Wholesalers (50-99: 1)
Health Care and Social Assistance: Residential Mental Retardation Facilities (20-49: 2)
Accommodation and Food Services: Snack and Nonalcoholic Beverage Bars (20-49: 1, 10-19: 1, 5-9: 2)
Health Care and Social Assistance: Offices of Dentists (10-19: 3, 5-9: 2, 1-4: 1)
Health Care and Social Assistance: Offices of Physicians (except Mental Health Specialists) (20-49: 1, 5-9: 2, 1-4: 3)
Other Services (except Public Administration): Religious Organizations (20-49: 1, 5-9: 2)
2002 - 2018 National Fire Incident Reporting System (NFIRS) incidents
Based on the data from the years 2002 - 2018 the average number of fires per year is 33. The highest number of fires - 53 took place in 2002, and the least - 11 in 2014. The data has a dropping trend.
When looking into fire subcategories, the most reports belonged to: Structure Fires (42.8%), and Outside Fires (33.0%).
Fire incident types reported to NFIRS in Zip Code 06812


 Nearest zip codes: 06811, 06784, 06804, 12563, 06810, 10509.


 Based on the data from the years 2002 - 2018 the average number of fires per year is 33. The highest number of fires - 53 took place in 2002, and the least - 11 in 2014. The data has a dropping trend.
 When looking into fire subcategories, the most reports belonged to: Structure Fires (42.8%), and Outside Fires (33.0%).